in the population sciences published by the Max Planck Institute for Demographic Research Konrad-Zuse Str. 1, D-18057 Rostock · GERMANY www.demographic-research.org
DEMOGRAPHIC RESEARCH
VOLUME 18, ARTICLE 12, PAGES 337-376
PUBLISHED 29 APRIL 2008
http://www.demographic-research.org/Volumes/Vol18/12/ DOI: 10.4054/DemRes.2008.18.12
Research Article
The transition to early fatherhood:
National estimates based on multiple surveys
Kathryn Hynes
Kara Joyner
H. Elizabeth Peters
Felicia Yang DeLeone
© 2008 Hynes et al.
This open-access work is published under the terms of the Creative Commons Attribution NonCommercial License 2.0 Germany, which permits use, reproduction & distribution in any medium for non-commercial purposes, provided the original author(s) and source are given credit.
1 Introduction 338
2 Background 339
2.1 Early fertility rates and trends 339
2.2 Defining “early” male fertility 340
2.3 Theory and prior research on factors associated with early fertility transitions
341
2.3.1 Sex 342
2.3.2 Age 343
2.3.3 Race 344
2.3.4 Cohort 344
3 The current study 344
4 Data 346
5 Measures 347
5.1 Age at first birth 347
5.2 Quality of male fertility data 347
5.3 Family background characteristics 348
6 Methods 351
7 Results 352
7.1 Describing early male fertility 352
7.2 The association between family background and early fertility 359
8 Discussion 367
9 Acknowledgments 370
References 371
The transition to early fatherhood:
National estimates based on multiple surveys
Kathryn Hynes1 Kara Joyner2 H. Elizabeth Peters3 Felicia Yang DeLeone4
Abstract
This study provides systematic information about the prevalence of early male fertility and the relationship between family background characteristics and early parenthood across three widely used data sources: the 1979 and 1997 National Longitudinal Surveys of Youth and the 2002 National Survey of Family Growth. We provide descriptive statistics on early fertility by age, sex, race, cohort, and data set. Because each data set includes birth cohorts with varying early fertility rates, prevalence estimates for early male fertility are relatively similar across data sets. Associations between background characteristics and early fertility in regression models are less consistent across data sets. We discuss the implications of these findings for scholars doing research on early male fertility.
1 Pennsylvania State University. Please direct all correspondence to Kathryn Hynes, 105 White Building, Pennsylvania State University, University Park, PA, 16802. Phone: (814) 863-6422. Fax: (814) 865-4470, E-mail: [email protected].
2 Bowling Green State University 3 Cornell University
1. Introduction
Early childbearing has long been of concern to scholars, policy makers, and the general public because of its potential negative consequences for teen parents and their children. Children born to teenage mothers are more likely than those with mothers who were older at the time of birth to grow up in poverty, drop out of high school, and become teen parents themselves (Haveman, Wolfe, and Pence 2001). Teen parents are also less likely to be married than older parents (Ventura and Bachrach 2000). In comparison to youth living with two parents, those living apart from their biological fathers are more likely to live in poverty, receive welfare, drop out of high school, be “idle,” have children as teenagers, marry early, and dissolve their marriages (Hernandez 1993; McLanahan 1985; McLanahan and Bumpass 1988; McLanahan and Sandefur 1994). More recent research has cast doubt on the causality of these associations (Hotz, McElroy, and Sanders 2005), but concerns about teen fertility, particularly in the policymaking community, still abound.
Compared to the body of literature on early female fertility, research focusing specifically on the transition to fatherhood is limited (Goldscheider and Kaufman 1996). However, scholars and policymakers are increasingly recognizing the importance of men’s contributions to fertility and marriage outcomes, as evidenced by a number of policies that have been directed at men. For example, beginning in the mid-1980s, Congress passed a series of acts aimed at increasing the payment of child support and the establishment of legal paternity for children born outside of marriage (Committee on Ways & Means 2004). More recently, efforts to promote healthy marriages have focused on both men and women (Administration for Children and Families 2006).
Due in part to this policy interest, research on men’s family formation behaviors has increased rapidly. While some consistent patterns, such as the positive association between disadvantaged family backgrounds and early fertility, have emerged in the literature (Rindfuss, Morgan, and Swicegood 1988), there have been some inconsistencies in this early research as well. Additionally, while data on female fertility appears to be quite consistent across surveys (Swicegood, Morgan, and Rindfuss 1984), questions have been raised in the past about the quality of men’s fertility data (Cherlin, Griffith, and McCarthy 1983; Rendall et al. 1999).
design, and data collection strategies. The comparisons presented in this paper provide researchers with a clear understanding of differences and similarities in descriptive and multivariate results across the three data sources.
We describe patterns of early fertility for men using a broad definition of early fertility that includes births through age 24. We compare patterns of male and female fertility and examine differences in the prevalence of early parenthood by age, race, and cohort. In addition, we examine the family background characteristics associated with early fatherhood. With the large sample sizes available, we are able to empirically test whether the influence of these background characteristics differs based on the respondent’s age, sex, or race.
With a few exceptions, estimates of the prevalence of early male fertility are relatively similar across data sets because each data set includes respondents born in cohorts with varying rates of early fertility. Multiple regression results indicate that while disadvantage is associated with first births to teenagers and with fertility in the early 20s, the association weakens after the teenage years. These regression results are more robust for white men than for men from racial minorities. We find only sporadic evidence that the background characteristics associated with early fertility differ for women and men, and little evidence of cohort differences. Finally, while prevalence estimates are relatively consistent across data sets, associations in regression models between background characteristics and early male fertility are not entirely consistent. We discuss the implications of these findings for scholars doing research on the causes and consequences of men’s family formation behaviors.
2. Background
2.1 Early fertility rates and trends
One might expect trends in early parenthood among men to mirror those previously found among women. However, levels of early parenthood may differ for men and women due to age differences between teen mothers and the fathers of their children. Research based on the 1995 NSFG finds that more than half of the women who were sexually active in their teens had their first sexual intercourse with partners who were two or more years older than they were (Elo, King, and Furstenberg 1999). Data based on the 1988 National Maternal and Infant Health Survey (NMIHS) indicates that 52–60% of infants born to teen mothers had fathers who were two or more years older than the mother (Landry and Forrest 1995). Not surprisingly, studies show that men are substantially less likely to have teen births than are women (Glick, Ruf, White, and Goldscheider 1996; Michael and Tuma 1985). It is also plausible that changes across cohorts in rates of early parenthood differ for men and women. To the extent that age differences between teen mothers and their partners are increasing or decreasing over time, we would expect sex differences in levels of teen parenthood to become more or less pronounced.
2.2 Defining “early” male fertility
Early fertility is a relative term, implying that there is also on-time fertility and late
fertility (Hogan and Astone 1986;Rindfuss, Morgan, and Swicegood 1988). But how
should we define early fertility and might the definition of early fertility differ for women and men (Hogan and Astone 1986)? A developmental approach would identify early fertility as occurring early enough in the life course to systematically lead to negative outcomes for parents and children. With only limited research on the impacts of early fertility for men (Nock 1998), however, we do not have enough guidance to know the age at which men are likely to be prepared for parenthood. In addition, men are likely not prepared for parenthood at a standard age, but after they have reached a certain level of maturity and have completed transitions into stable employment and relationships (Rindfuss, Morgan, and Swicegood 1988). However, these precursors are difficult to measure and are often not one-way transitions.
Given the difficulty in identifying an adequate definition of “early” fatherhood, we have chosen to take a life course approach (George 1993) by examining fatherhood
from ages 15 – 24 in order to understand the dynamics of early fertility.5 This age
range spans the early teenage years, the years when some men are working and others are in college, and beyond. Examining fatherhood through the mid-20s should provide information on fertility patterns for different subgroups of the population. It also allows
us to examine whether the family background characteristics associated with early fatherhood change in salience across the early adult years.
2.3 Theory and prior research on factors associated with early fertility transitions
A large body of work examines the correlates of early female fertility (see Hofferth and Hayes 1987 for a review), and a small but rapidly growing literature explicitly looks at early male fertility (Jaffee, Caspi, and Moffitt 2001; Michael and Tuma 1985; Rindfuss, Morgan, and Swicegood 1988). Much of the work on early fertility has used an economic or rational choice model that highlights the role of opportunity costs in decisions about childbearing (Duncan and Hoffman 1990; Leibowitz, Eisen, and Chow 1986; Lundberg and Plotnick 1995). According to this theoretical model, childbearing and childrearing interfere with educational and labor market experiences that are important for career attainment and financial well-being because of both the time and financial costs involved. Individuals who perceive fewer long-term opportunities for higher education or professional careers are more likely to have early births because the opportunity costs of these births are lower, whereas those who expect greater opportunities are likely to delay fertility.
Of course the assumption of rational decision-making may be more applicable to the behavior of adults than adolescents. Appropriately, studies of early parenthood focus not only on the role of opportunity costs, but on socialization, social control, stress, and risk preferences as well (McLanahan and Bumpass 1988; Plotnick 1992; Scaramella, Conger, Simons, and Whitbeck 1998; Wu and Martinson 1993). In demographic studies, these various theoretical constructs are often proxied by the same variables due to the limited information available in large data sets. For example, growing up in a single parent family and having parents with low education levels could capture low educational aspirations and low wage prospects, or could be associated with low levels of monitoring, stressful life events, and living in a neighborhood with peers who are also engaging in risky behavior.
possible to examine whether there are variations in the association between background characteristics and early fertility by sex, age, race, and cohort.
2.3.1 Sex
Theoretically, opportunity costs may differ for men and women because of the traditionally different roles mothers and fathers play in childrearing. Most studies have focused on women’s fertility and assume that mothers do most of the caregiving, making child-rearing time intensive for women. Studies generally find that the competing time demands of school/work and family roles reduce the fertility of women in young adulthood. In particular, high educational aspirations and variables that are proxies for anticipated higher education and wages are negatively associated with early female fertility (Plotnick 1992; Duncan and Hoffman 1990; Duncan et al.1998; Harris, Duncan, and Boisjoly 2002).
The more limited research on early male fertility indicates that men with fewer opportunities are similarly more likely to experience early fertility than their counterparts from more advantaged backgrounds (Glick, Ruf, White, and Goldscheider 2006; Hanson, Morrison, and Ginsburg 1989; Pears et al. 2005; Rindfuss, Morgan, and Swicegood 1988). As men’s family roles are changing, however, defining opportunity costs for men is arguably less straightforward than it is for women and will likely depend on whether the birth occurs within marriage. The typical role for men is that of an economic provider, not a caregiver. Early fatherhood may result in men leaving school to enter the workforce in order to support their children (Nock 1998). This may be a salient consequence, especially for teens with high educational aspirations. However, for men after their early 20s or for those who do not intend to attend college, becoming a father may not alter the timing of labor market participation. Therefore, we might expect the deterrent effect of family background variables that proxy higher educational attainment to be weaker for men than for women after the teenage years and particularly after age 22, when many men have completed college. On the other hand, men tend to be partnered with women from similar socio-economic and educational backgrounds who are several years younger than they are, thus women’s opportunity costs of early fertility may reduce men’s fertility later in the life course.
coercing women into engaging in behaviors that perhaps they otherwise would not
(Gowen et al. 2004).
There is some empirical evidence suggesting differences in the background factors associated with early fertility for women and men, but the evidence is not consistent. Some studies indicate that the effects of socioeconomic status or maternal education on early fertility may be weaker for men than for women (Michael and Tuma 1985; Xie, Cairns, and Cairns 2001), though others find roughly equivalent effects of socioeconomic status on fertility for women and men (Barber 2001; Rindfuss, Morgan, and Swicegood 1988; Glick, Ruf, White, and Goldscheider 2006). Studies also have inconsistent conclusions about whether family structure during youth is associated with early fertility for men, with some studies corroborating the link between single parent households and early fertility found for women (Jaffee et al. 2001; Ku, Sonenstein, and Pleck 1993), but others finding no association between family structure and early male fertility (Glick, Ruf, White, and Goldscheider 2006; Hanson, Morris, and Ginsburg 1989; Pears et al. 2005).
Lack of consistency in the literature on early male fertility is not surprising. Several of the studies are from small samples (Jaffee, Caspi, and Moffitt 2001; Pears et al. 2005; Xie, Cairns, and Cairns 2001) or samples drawn from birth cohorts spanning a period of rapid demographic and social change, and the measures of family structure and socioeconomic status are not consistent across studies. It is unclear whether these differences in results are due to variation in sample size and composition, data quality, variable construction, or historical circumstances.
2.3.2 Age
2.3.3 Race
There may be differences in the effect of background variables by race, to the extent that race/ethnicity is associated with multiple unmeasured constructs. For example, mother’s education or family structure may be proxies for neighborhood and peer group effects, but the relationship between these observable and unobservable characteristics is likely to vary across race/ethnicity in part because of differences in neighborhood segregation and the concentration of poverty across different race/ethnic groups. In addition, if social mobility differs across race/ethnic groups, then mother’s education may be differentially associated with the youth’s expected economic and educational opportunities across race/ethnic groups. Studies that are large enough to examine whether there are race differences in the association between family background characteristics and early fertility note that background characteristics are more strongly associated with early fertility for white men than for African-American men (Rindfuss,
Morgan, and Swicegood 1988).
2.3.4 Cohort
It is unclear whether there will be differences in the influence of family background characteristics on very early male fertility by cohort. The costs of early births were high for men from early cohorts where marriage was more common, but are likely to have diminished for men from more recent cohorts where non-marital births are more prevalent. Offsetting this trend, however, is an increase in child support enforcement that should reduce the likelihood of early fertility by increasing men’s costs. Both non-marital births and the enforcement of child support have increased over the past decades (Karant and Sorensen 1999), making it difficult to predict whether the net change in opportunity costs is positive or negative. In addition, it is possible that child support is more of a deterrent for advantaged than for disadvantaged men. Mothers with low education levels are less likely to have a child support award in place than mothers with higher education levels (Committee on Ways and Means 2004). If child support primarily deters early fertility for more advantaged men who already have incentives to avoid fatherhood, then cohort differences may not be as apparent.
3. The current study
by race, cohort, and data set. Additionally, this research systematically examines whether characteristics of the respondent’s family of origin such as family structure, maternal education, maternal employment, nativity, and race are associated with early transitions to fatherhood. We organize our analyses around the following hypotheses:
Hypothesis 1: Disadvantaged family background will be associated with early fertility. This pattern is suggested by both the economic and sociological frameworks discussed previously.
Hypothesis 2: The association between family background and early fertility will be weaker for men than for women (when such differences exist).
Hypothesis 3: The association between family background characteristics and fertility will weaken at older ages for both women and men. This weakening may be more apparent for men than for women.
Hypothesis 4: The association between family background characteristics and early fertility will differ based on race/ethnicity given the limited set of background characteristics included in the models. In particular, the associations are likely to be stronger for whites than for minorities.
Hypothesis 5: Cohort differences in the association between family background and early male fertility are uncertain, given the offsetting trends in non-marital births and child support enforcement.
Hypothesis 6: Despite coding the data in similar ways, we expect to observe some differences between data sets in the factors that are significantly associated with early male fertility due to differences in sample composition, methods of data collection, and cohort.
Most researchers run analyses in a single data set given the considerable time costs involved in preparing data sources for analyses. The aim of this paper is not to tease out the cause of these differences or to provide tests for whether observed differences between data sets are statistically significant. Instead, our goal is to provide researchers with information about where results are robust across data sets and where analyses conducted in different data sets net different results.
4. Data
This study relies on data from three sources: The 1979 National Longitudinal Survey of Youth (NLSY79), the 1997 National Longitudinal Survey of Youth (NLSY97), and the 2002 National Survey of Family Growth (NSFG). These data sets were selected because they provide information on men’s fertility behavior from large, nationally representative samples. In addition, the data sets provide overlapping information on male fertility across birth cohorts ranging from 1957–1984, allowing for an examination of fertility behavior over time and an assessment of the consistency of fertility reports across data sets.
The 1979 and 1997 National Longitudinal Surveys of Youth are cohort data sets, providing large, nationally representative samples of women and men born between 1957–1964 (NLSY79) and 1980–1984 (NLSY97). Both surveys are prospective: Respondents were interviewed annually or biennially over time in order to collect detailed economic and demographic histories. Both surveys provide extensive information on respondents’ family background as well as their employment, income, and family formation behavior. In 2002, respondents in the NLSY79 were ages 38–45 and had largely completed their reproductive years. Respondents in the NLSY97 were 19–23 in 2003, and therefore only contribute information about very early births to this study.6
The 2002 National Survey of Family Growth, in contrast, is a nationally representative cross-sectional sample of women and men aged 15–44 who reside in households. The NSFG is designed to provide estimates of factors affecting the U.S. birth rate, family formation, and reproductive health among males and females (Abma 2002). Due to the age range of respondents in the NSFG, we can break the NSFG sample into three groups (those born in 1957–1964, 1965–1974, 1975–1984) that overlap significantly with the two NLSY cohorts. This strategy allows us to compare
patterns of early fertility over time and across data sets. All three data sets include
minority over-samples, allowing us to conduct analyses separately by race.7
5. Measures
5.1 Age at first birth
The dependent variable in this study is based on the respondent’s age at first birth. Fertility data is collected differently across the surveys. In the NLSY79 and the NLSY97, respondents are asked at each interview about their fertility behavior. Fertility data is collected separately from information about changes in the respondent’s
relationship status.8 In contrast, the NSFG collects male fertility data in the context of
relationship data in hopes of eliciting higher reports of non-marital fertility (Lindberg et
al. 1998).9 It is unclear which data set will contain better male fertility information,
given that the NLSY surveys have the advantage of a shorter recall period while the NSFG has the advantage of collecting fertility data in the context of relationship histories.
5.2 Quality of male fertility data
Previous research has found substantial reporting of fathering and under-representation of fathers in a number of national data sets (Rendall et al. 1999; Cherlin and Griffith 1998). There are several reasons why data quality issues may be less of a problem in these data sets. First, two of our data sets (NLSY79 and NLSY97) are panel data sets, allowing for the collection of fertility data shortly after births occur. Rendall et al. (1999) suggest that panel data are likely to capture a higher proportion of male fertility than retrospective data. Second, in response to a general lack of available data
7 The original NLSY79 included a military sample, a minority sample, and a poor white over-sample. Only the minority over-sample was retained for analyses. Descriptive results are weighted using the sample of respondents still in the survey in 2002.
on male fertility and concerns about male fertility data quality, improved practices for collecting male fertility were incorporated into data collection efforts such as the NSFG.
We are currently assessing the quality of male fertility reports in these three data sets. Comparisons of age-specific fertility rates (ASFRs) in each data set to estimates of men’s fertility from Vital Statistics data show slightly lower ASFRs for men in the surveys compared to Vital Statistics data. However, the ASFRs calculated from Vital Statistics data generally fall within the confidence intervals surrounding the ASFRs from the three data sets used in this analysis, with only the youngest cohort in the NSFG falling outside of the confidence interval at ages 18–19 (Peters et al. 2006). This conclusion is tempered because Vital Statistics data on father’s age is missing from a substantial proportion of records, and the strategy employed for imputing the father’s age may bias the Vital Statistics calculations (see Rendall et al. 2006, for a description of the methods and its limitations).
Third, Rendall et al. (2006) used the NSFG to compare men’s ASFRs calculated using the mother’s reports of the father’s age, with those rates calculated using reports from men in the sample for the period of 1991-2000. Similar to our findings comparing men’s reports in the NSFG to imputed Vital Statistics data, men were found to be under-reporting births when they were young (ages 18–21), leading us again to worry about under-reporting of early births in the NSFG. Some of the discrepancies between female and male reports in the NSFG may be due to the under-representation of men who may be in prison or other institutions. The problem of under-representation may be less of an issue for panel data sets (such as the NLSY surveys) that observe respondents closer to the time of the child’s birth.
5.3 Family background characteristics
Because of our interest in comparing results across data sets, the multivariate models in this analysis rely on family background characteristics that are likely to be associated with early fertility and are available in all three data sets. Due to well-documented differences in family formation behavior by race, results are presented for three race/ethnic groups when possible: Hispanics, non-Hispanic African-Americans, and Hispanic whites (respondents who specify other races are included in the
non-Hispanic white category).10 The education level of the respondent’s mother (or
mother-figure in the NSFG) is included as a categorical variable: less than a high school
education, high school degree or GED, and more than a high school education. The respondent’s family structure during adolescence is measured with a series of dummy
variables:11 respondent lived with both biological parents, respondent lived with one
biological parent and a step-parent,12 respondent lived with a single parent, and
respondent lived with neither biological parent. Analyses include a dummy variable indicating whether the respondent is foreign born (1=yes, 0=no) and another indicating whether the respondent’s mother (or adult female figure in the household) was
employed when the respondent was 14(1=employed, 0=not employed).13 Descriptive
statistics for all independent variables are presented for men in Table 1a and for women
in Table 1b.14
Descriptive statistics are weighted and the sample used in descriptive analyses varies slightly across tables due to censoring. In both the NLSY97 and the NSFG, there are individuals who have not completed the risk period (for instance, who were 18 at the last wave of data collection). Logistic regression models can handle censoring; these individuals can contribute spells up to the point they are censored. Tables 1a and 1b include weighted descriptive statistics for all individuals included in the logistic regression analyses. Later tables on the prevalence of early fertility require that we remove these censored individuals from our analyses so we can calculate the percent of the sample experiencing a birth, given completion of the risk period. Therefore, later descriptive tables have smaller sample sizes for the NSFG and the NLSY97.
11 In the NLSY97, family structure and maternal employment were measured at the first interview, when respondents were between the ages of 12 – 17; in the NSFG and NLSY79 the variable reports family structure at age 14.
12 These questions did not specifically ask if the step-parent was married to or cohabiting with the respondent’s biological parent, thus it was up to the respondent to decide whether their parent’s partner constituted a “step-parent”.
13
In the NSFG the question is about mother’s usual employment “when you were growing up, that is when you were between the ages of 5 and 15.”
Table 1a: Descriptive statistics for men’s analysis variables, by race and data set
White African-American Hispanic NLSY79 NSFG NLSY97 NLSY79 NSFG NLSY97 NLSY79 NSFG NLSY97 Race distribution 0.80 0.72 0.71 0.13 0.12 0.15 0.06 0.16 0.13
Maternal education
Less than high school 0.23 0.13 0.10 0.44 0.22 0.19 0.61 0.60 0.38 High school degree 0.50 0.42 0.33 0.32 0.45 0.32 0.20 0.25 0.26 More than high school 0.23 0.45 0.46 0.14 0.34 0.28 0.10 0.14 0.23 Missing maternal educ. 0.05 - 0.11 0.10 - 0.20 0.10 - 0.13
Family structure at age 14
Two biological parents 0.80 0.76 0.62 0.52 0.61 0.28 0.66 0.77 0.57 Step-parent 0.08 0.09 0.14 0.08 0.08 0.12 0.09 0.05 0.10 Single parent 0.11 0.12 0.22 0.33 0.24 0.50 0.22 0.13 0.31 Neither parent 0.02 0.02 0.02 0.08 0.08 0.10 0.04 0.04 0.03 Child was foreign born 0.03 0.08 0.03 0.02 0.11 0.02 0.28 0.55 0.16 Mother employed at age 14 0.51 0.67 0.69 0.64 0.80 0.62 0.48 0.55 0.57 Missing maternal empl. - - 0.07 - - 0.09 - - 0.08 Flag for imputed cases 0.03 0.02 0.01 0.03 0.04 0.02 0.03 0.04 0.03 N 2,365 2,551 2401 1,405 826 1151 918 972 956
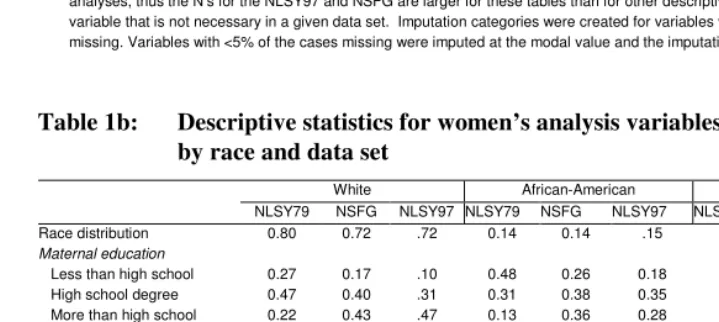
Notes: Descriptive statistics are weighted. These tables include information for all individuals included in the logistic regression analyses, thus the N’s for the NLSY97 and NSFG are larger for these tables than for other descriptive tables. (-) indicates a variable that is not necessary in a given data set. Imputation categories were created for variables with >5% of the cases missing. Variables with <5% of the cases missing were imputed at the modal value and the imputation flag was coded 1.
Table 1b: Descriptive statistics for women’s analysis variables, by race and data set
White African-American Hispanic NLSY79 NSFG NLSY97 NLSY79 NSFG NLSY97 NLSY79 NSFG NLSY97 Race distribution 0.80 0.72 .72 0.14 0.14 .15 0.06 0.14 .12
Maternal education
Less than high school 0.27 0.17 .10 0.48 0.26 0.18 0.68 0.62 0.39 High school degree 0.47 0.40 .31 0.31 0.38 0.35 0.19 0.20 0.25 More than high school 0.22 0.43 .47 0.13 0.36 0.28 0.07 0.17 0.23 Missing maternal educ. 0.04 - .11 0.08 - 0.19 0.07 - 0.13
Family structure at age 14
Two biological parents 0.79 0.76 .58 0.50 0.54 0.29 0.66 0.75 0.52 Step-parent 0.09 0.10 .15 0.08 0.09 0.12 0.08 0.06 0.11 Single parent 0.11 0.11 .25 0.35 0.27 0.49 0.20 0.12 0.33 Neither parent 0.02 0.03 .03 0.08 0.10 0.11 0.06 0.06 0.04 Foreign born 0.03 0.08 .02 0.03 0.11 0.02 0.24 0.52 0.17 Mother employed at age 14 0.53 0.68 .69 0.61 0.82 0.63 0.48 0.56 0.56 Missing maternal empl. - - .07 - - 0.09 - - 0.08 Flag for imputed cases 0.01 0.02 .01 0.03 0.03 0.02 0.03 0.02 0.02 N 2,415 4,210 2239 1,426 1,387 1131 948 1,381 902
Table 1a and 1b show clear differences between race/ethnic groups and between data sets in these basic demographic characteristics. Differences between race/ethnic
groups on these characteristics are well-documented elsewhere (Blau, Ferber, and
Winkler, 2006; U.S. Census Bureau, 2004). Differences between data sets are also not surprising for two reasons. First, there have been significant changes in maternal education, family structure, and maternal employment across the cohorts covered by these datasets (Bianchi and Casper 2000; Blau, Ferber, and Winkler 2006; U.S. Census Bureau, 2004). Data from the oldest cohort, the NLSY79 shows lower maternal education, more two-parent families, and less maternal employment than the NLSY97. The NSFG includes data from respondents born from many cohorts spanning these two longitudinal surveys, thus estimates are generally between those of the NLSY79 and the NLSY97.
Second, the Hispanic sample in the NSFG is substantially different from the Hispanic sample in the NLSY surveys: Hispanics in the NLSY surveys would have been born in the U.S. or immigrated as children, whereas Hispanics in the NSFG could have been born in the U.S. or immigrated at various points in adulthood. Note the difference in the percent foreign born between the Hispanics in the NLSYs and in the NSFG. This sample composition difference is reflected perhaps most strongly in the low levels of maternal education found among Hispanics in the NSFG.
6. Methods
We first provide a detailed description of early fertility behavior by age, sex, race, data set, and cohort. Results from the NLSY97 are only presented through age 19, as the sample size of respondents who were older than 19 in 2003 declines for each subsequent age. Only respondents who reached age 20 in the NLSY97 and age 25 in the NLSY79 and NSFG are included in descriptive results of the prevalence of early fertility. All descriptive statistics are weighted.
We run all models separately for women and men (Hypothesis 2) and present results for models from each data set side-by-side to facilitate comparisons of results (Hypothesis 6). We estimate separate logistic regression models on spells within each age range in order to observe the association between the background characteristics and the likelihood of a first birth during those ages. We then estimate a model that includes spells from ages 15–24 and interacts age with each of the independent variables to test for significant differences in the effects of the independent variables by age (Hypothesis 3). Significant interactions by age are indicated by bold coefficients in
the tables.15 Models in the NLSY surveys are clustered by household to account for
siblings in the data; all models use robust standard errors.
We then estimate very similar models but test for race differences in the association between family background and fertility behavior. Within each age group and sex, we estimate models separately for whites, African-Americans, and Hispanics, then pool the data to test for significant differences in the effects of the covariates by race (Hypothesis 4). We also pool the data for women and men in each race/ethnic group and present a summary table highlighting effects that are significantly different by sex (Hypothesis 2).
The last set of multivariate results relies on the NSFG to test for cohort differences in the effects of family background characteristics, as the NSFG is the only data set that includes respondents from multiple birth cohorts (Hypothesis 5). Due to the small sample sizes that result when the NSFG is broken down by cohort, multivariate models
cannot be further subdivided by race.16
7. Results
7.1 Describing early male fertility
In order to understand early fertility, it is useful to see the full distribution of ages at first birth. Figures 1a and 1b present the weighted age distribution of first births for women and men by race. These figures are based on the NLSY79, as this is the only data set in which the majority of respondents are nearing the end of their prime reproductive years. As previous research has shown, African-American and Hispanic women and men experience earlier first births than white women and men. Not only are the births earlier, but the distribution is much more sharply skewed toward early
15 Results from all interaction models are available from the authors on request.
births. For both African-American and Hispanic women and men, there are clear “peak” fertility years, when a large percent of the population experiences a first birth. After these early peaks, the rate of first births slows considerably and, especially for women, drops well below the white rate of first births at older ages. For white women and men, the peak fertility years are more evenly distributed across a larger number of years and older ages.
Figure 1a: Distribution of men’s age at first birth in the NLSY79, by race
0 1 2 3 4 5 6 7 8 9 10 11
11 13 15 17 19 21 23 25 27 29 31 33 35 37 39 41
Age at First Birth
P
e
rc
e
n
t
White Men Af. Am Men Hispanic Men
Figure 1b: Distribution of women’s age at first birth in the NLSY79, by race
0 1 2 3 4 5 6 7 8 9 10 11
11 13 15 17 19 21 23 25 27 29 31 33 35 37 39 41
Age at First Birth
P
e
rc
e
n
t
White Women Af. Am Women Hispanic Women
Notes: Descriptive statistics are weighted. Percent experiencing a first birth at each age is out of the full sample of respondents including those who never experienced a birth. Results and weight based on sample still in panel in 2002 in order to avoid miscoding attrition as no birth, thus percent with birth a particular age differs slightly from numbers reported in Table 2 which uses respondents in the panel through age 25.
While the shape of the age distribution of first births is similar for women and men, the timing of these births differs. As prior research has shown, women experience earlier first births than men. For white women from the NLSY79, peak fertility is from the late teenage years through the mid-20s, while for white men high rates of first births are apparent from the early 20s until about age 30. The risk period that we have identified for multivariate models in this study goes through age 24. Thus for men of all races, fertility before these peak first birth years has been captured and the risk period covers several years into, and in some cases beyond, the peak ages of first births.
25–27% of white men. While teenage births for white men are rare, teenage births for minority men are more common, but still occur at a substantially lower rate than for minority women. Only 11–12% of Hispanic men experience a first birth before age 20, compared to 29–32% of Hispanic women. Births to African-American male teens are slightly more common (15–17%) but are still rare compared to African-American female teens (32–39%).
Research by Landry and Forrest (1995) indicates that the average age difference between women who give birth before age 20 and the fathers of their children is 3.2–3.6 years. Looking within race/ethnicity groups, these tables largely confirm that early male fertility is about 3 years later than early female fertility. For instance, 25 – 31% of American women have had a first birth by age 18, while 27–33% of African-American males have had a first birth by age 21. Similarly, 22–23% of Hispanic women have had a first birth by age 18, while 24–25% of Hispanic men have had a first birth by age 21.
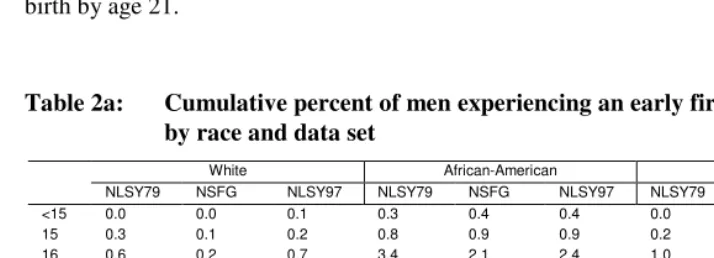
Table 2a: Cumulative percent of men experiencing an early first birth, by race and data set
White African-American Hispanic
NLSY79 NSFG NLSY97 NLSY79 NSFG NLSY97 NLSY79 NSFG NLSY97 <15 0.0 0.0 0.1 0.3 0.4 0.4 0.0 0.9 0.3 15 0.3 0.1 0.2 0.8 0.9 0.9 0.2 1.1 0.9 16 0.6 0.2 0.7 3.4 2.1 2.4 1.0 1.6 2.1 17 1.1 1.7 1.8 6.9 4.7 5.7 3.6 3.6 4.6 18 2.7 4.5 3.8 11.8 9.3 10.2 6.7 6.2 8.0 19 5.5 7.0 6.5 17.0 15.4 16.6 12.2 10.8 12.2 20 8.9 10.4 - 25.0 20.8 - 18.3 18.3 - 21 12.9 13.6 - 32.5 27.2 - 25.0 23.9 - 22 17.5 16.4 - 38.1 34.2 - 31.2 32.7 - 23 22.4 20.9 - 43.2 40.0 - 37.0 40.0 - 24 26.9 25.3 - 47.2 43.8 - 42.5 45.8 - N 2,365 1,624 1780 1,411 586 877 918 622 711
Table 2b: Cumulative percent of women experiencing an early first birth, by race and data set
White African-American Hispanic NLSY79 NSFG NLSY97 NLSY79 NSFG NLSY97 NLSY79 NSFG NLSY97 <15 0.3 0.3 0.2 1.4 2.8 2.6 0.3 1.4 0.4 15 1.2 0.9 1.0 5.2 6.3 6.0 2.1 4.3 2.6 16 3.5 2.5 3.1 12.8 12.3 10.3 6.9 8.7 7.1 17 7.0 5.5 6.3 22.0 19.3 16.7 14.5 15.0 12.6 18 11.1 10.0 10.6 30.4 30.8 25.1 22.8 23.2 21.7 19 17.0 14.7 15.7 38.9 38.3 31.9 32.3 30.5 29.4 20 22.6 19.5 - 47.6 46.3 - 40.1 39.1 - 21 27.1 25.4 - 53.7 53.0 - 44.9 45.9 - 22 33.2 29.2 - 58.1 57.3 - 50.7 51.8 - 23 36.8 34.1 - 62.5 61.0 - 56.4 56.8 - 24 41.6 39.7 - 66.1 64.3 - 61.3 61.8 - N 2,421 3,019 1698 1,449 1,094 888 951 1,025 695
Notes: Cumulative percent estimates include all individuals including those who have not experienced a birth. Descriptive statistics are weighted. The sample for each data set includes only individuals for whom we have data through age 20 (in the NLSY97) and age 25 (in the NSFG or the NLSY79). Thus individuals who left the longitudinal samples before these ages or who had not yet reached these ages at the time of data collection are excluded.
Differences across data sets are small but apparent. For instance, the NSFG data shows lower rates of early male fertility for African-American men than do the other two data sets. This may be due to data quality issues or it may be due to sample composition differences (institutionalized men are not in the NSFG sample). Further, prevalence differences may be due to the different cohorts spanned by the data sets. For the cohort analyses, the NSFG has been divided into three birth cohorts (1957–1964, 1965–1974, and 1975–1984). The first and third cohorts overlap with the NLSY cohorts (NLSY79 spans 1957–1974; NSLY97 spans 1980–1984). Presenting descriptive statistics on trends in early fertility across cohorts, however, is challenging for two reasons. First, when divided into cohorts these subgroups are small in the NSFG. Second, as research on women’s early fertility indicates, trends in teen fertility from the 1970s on were not linear, but rather the rates of teen fertility fluctuated. Figure 2 presents our calculations of trends in teen fertility from the Vital Statistics for
women and men.17
Figure 2: Vital statistics estimates for teen fertility rates from 1972 – 2002 0 0.01 0.02 0.03 0.04 0.05 0.06 0.07
72 74 76 78 80 82 84 86 88 90 92 94 96 98 00 02
Year B ir th s to I n d iv id u a ls 1 5 t o 1 9 / P o p u la ti o n 1 5 t o 1 9 Women Men
C1 - NLSY79
C2
C3
NLSY97
Notes: Estimates based on authors’ calculations from Vital Statistics data. Fertility rates are for all births ages 15 – 19, not just first births. Cases with missing age of first birth for fathers were imputed. See Rendall et al. 2006 for a description of the method.
The Vital Statistics data includes all births to teens, not just first births, but it provides a basis for discussing descriptive information on first births across cohorts. Using Vital Statistics data to calculate age-specific fertility rates for women is straightforward. As noted earlier, the substantial proportion of missing data for father’s age (especially for the fathers of births to teen mothers) makes our calculation of these rates for men more problematic. Figure 2 shows the downward trend in women’s teen fertility across the 1970s, then the sharp upturn in the early 1990s and the more gradual decline across the late 1990s. As discussed previously, men’s rates of early fertility are much lower and they follow a pattern that is similar in shape but less pronounced.
however, that women in Cohort 3 from the NSFG have higher rates of first births as teens than women in the NLSY97. For men, it is less likely that we will see these differences, because the peaks and valleys in the Vital Statistics data are far less pronounced.
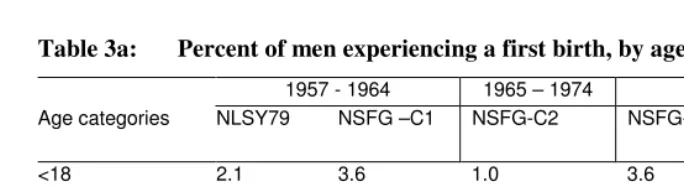
Table 3a: Percent of men experiencing a first birth, by age and cohort
1957 - 1964 1965 – 1974 1975 - 1984
Age categories NLSY79 NSFG –C1 NSFG-C2 NSFG-C3 NLSY97
(1980-84)
<18 2.1 3.6 1.0 3.6 2.77
18 – 19 5.4 6.9 6.2 4.2 6.08
20 – 22 13.6 14.4 11.3 10.7 -
23 – 24 9.5 7.7 10.7 11.5 -
Sample N 4,694 1,029 1,468 375 3,368
Notes: Percent estimates include all individuals including those who have not experienced a birth. Descriptive statistics are weighted. Only individuals who have reached age 20 in the NLSY97 and 25 in the NSFG are included.
Table 3b: Percent of women experiencing a first birth, by age and cohort
1957 - 1964 1965 – 1974 1975 - 1984
Age categories NLSY79 NSFG –C1 NSFG-C2 NSFG-C3 NLSY97
(1980-84)
<18 9.6 8.1 8.9 10.2 8.71
18 – 19 11.5 12.7 10.2 12.9 11.26
20 – 22 16.0 16.1 15.9 16.7 -
23 – 24 9.3 10.9 9.5 8.5 -
Sample N 4,821 1,758 2,671 709 3,281
Notes: Percent estimates include all individuals including those who have not experienced a birth. Descriptive statistics are weighted. Only individuals who have reached age 20 in the NLSY97 and 25 in the NSFG are included.
be due to differences in either fertility reports or the sample composition of the two data sets. As mentioned earlier, sample composition differences occur because the NSFG collects retrospective fertility data on a cross-section of the non-institutionalized U.S. population in 2002, whereas the NLSY79 collects panel data on respondents who were living in the U.S. prior to the beginning of the survey (when respondents were ages 14– 21). Thus, the NSFG has a much larger proportion of Hispanics than are in the NLSY79, because NSFG respondents could have migrated to the U.S. after the ages of 14–21. In addition, the NSFG may include a smaller sample of fathers reporting early births, because the risk of early fathering is likely to be correlated with the risk of incarceration, and institutionalized men are not in the NSFG sampling frame. Cohort 3 of the NSFG shows the expected pattern of slightly higher average early fertility for women compared to the NLSY97. For men however, the pattern is not clear, with more births in C3 of the NSFG (3.6% vs. 2.8%) for men younger than 18 but fewer births (4.2% vs. 6.1%) in the 18–19 range.
7.2 The association between family background and early fertility
We present several sets of multivariate models. The first seeks to understand whether there are differences in the effects of family background characteristics across the early fertility age range (Hypothesis 3). The second set of analyses examine whether there are race differences in these results (Hypothesis 4), and whether there are sex differences within racial groups (Hypothesis 2). The third tests for cohort differences in the NSFG (Hypothesis 5). All analyses are presented for men, replicated for women (Hypothesis 2), and run separately by data set (Hypothesis 6). Given the large number of multivariate results presented, we focus our discussion of results on these hypotheses.
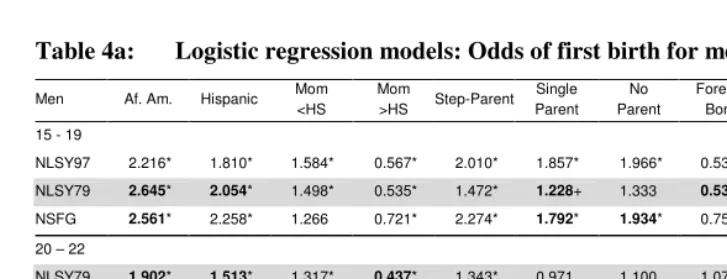
variable. Coefficients that are in bold indicate that the odds of experiencing a first birth between ages 15–19 (or 20–22) differ significantly from the odds of experiencing a birth between ages 23–24 (the comparison group in the interaction models).
Table 4a: Logistic regression models: Odds of first birth for men, by age
Men Af. Am. Hispanic Mom <HS
Mom
>HS Step-Parent Single Parent
No Parent
Foreign Born
Matern.
Empl. N of spells 15 - 19
NLSY97 2.216* 1.810* 1.584* 0.567* 2.010* 1.857* 1.966* 0.535* 0.855 20,537 NLSY79 2.645* 2.054* 1.498* 0.535* 1.472* 1.228+ 1.333 0.533* 0.930 23,552 NSFG 2.561* 2.258* 1.266 0.721* 2.274* 1.792* 1.934* 0.752+ 1.032 20,546 20 – 22
NLSY79 1.902* 1.513* 1.317* 0.437* 1.343* 0.971 1.100 1.077 0.894 12,015 NSFG 2.098* 2.357* 1.259+ 0.508* 1.620* 1.190 1.130 0.817 1.144 9,219 23 – 24
NLSY79 1.174 1.094 1.563* 0.721* 1.120 0.798 1.047 1.106 0.927 6,642 NSFG 1.514* 2.136* 1.093 0.584* 1.930* 1.133 0.722 0.989 0.966 4,713
Notes: Each row represents a separate logistic regression model. N of spells is the number of spells in each separate regression model. All models include controls for age dummies, imputation flags and cohort where relevant (results not shown). Omitted comparison groups for categorical variables are white, respondent’s mother has a high school degree, and respondent lived with both biological parents. Robust standard errors in parentheses; NLSY models are clustered by household. * p < .05; + p < .10. Coefficients in bold indicate a significant difference (p<.10) based on models that include a series of age dummy variables and interactions between all substantive independent variables and a categorical age variables (age 23-24 = omitted category).
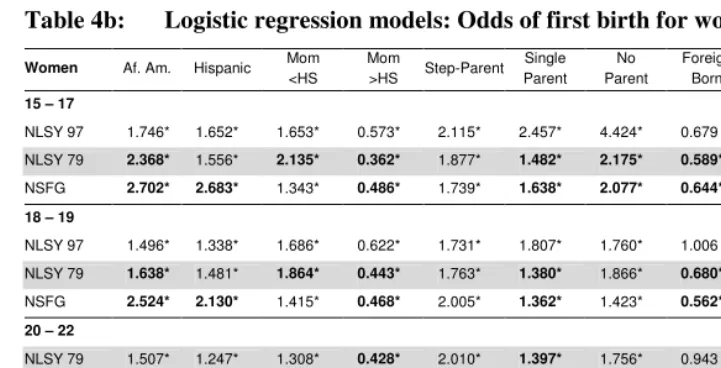
Table 4b: Logistic regression models: Odds of first birth for women, by age
Women Af. Am. Hispanic Mom <HS
Mom
>HS Step-Parent Single Parent
No Parent
Foreign Born
Matern.
Empl. N of spells 15 – 17
NLSY 97 1.746* 1.652* 1.653* 0.573* 2.115* 2.457* 4.424* 0.679 0.906 12,396 NLSY 79 2.368* 1.556* 2.135* 0.362* 1.877* 1.482* 2.175* 0.589* 1.087 14,252 NSFG 2.702* 2.683* 1.343* 0.486* 1.739* 1.638* 2.077* 0.644* 1.045 20,445 18 – 19
NLSY 97 1.496* 1.338* 1.686* 0.622* 1.731* 1.807* 1.760* 1.006 0.821+ 6,404 NLSY 79 1.638* 1.481* 1.864* 0.443* 1.763* 1.380* 1.866* 0.680* 0.991 8,251 NSFG 2.524* 2.130* 1.415* 0.468* 2.005* 1.362* 1.423* 0.562* 0.866+ 11,554 20 – 22
NLSY 79 1.507* 1.247* 1.308* 0.428* 2.010* 1.397* 1.756* 0.943 1.067 9,837 NSFG 1.741* 1.779* 1.454* 0.676* 1.385* 1.241* 1.523* 0.730* 1.061 13,104 23 – 24
NLSY 79 1.273+ 1.305+ 1.305* 0.628* 1.669* 0.993 1.346 1.130 0.982 5,220 NSFG 1.309* 1.455* 1.454* 0.881 1.608* 1.015 1.247 1.053 1.017 6,458
Notes: Each row represents a separate logistic regression model. N of spells is the number of spells in each separate regression model. All models include controls for age dummies, imputation flags and cohort where relevant (results not shown). Omitted comparison groups for categorical variables are white, respondent’s mother has a high school degree, and respondent lived with both biological parents. Robust standard errors in parentheses; NLSY models are clustered by household. * p < .05; + p < .10. Coefficients in bold indicate a significant difference (p<.10) based on models that include a series of age dummy variables and interactions between all substantive independent variables and a categorical age variables (age 23-24 = omitted category).
Men raised in single parent families are more likely to have a teen birth than men raised in a household with both biological parents. Like the race/ethnicity effects, however, the coefficients become smaller with age, and being raised in a single parent family is not associated with births at ages 20–22 or 23–24. Living in a step-family at age 14 is consistently associated with early births: This family structure effect is consistent for births through ages 20–22 and in the NSFG is still significant at ages 23–24.
Respondents who were born outside of the U.S. are less likely to experience a teen birth than respondents born in the U.S., controlling for other family background characteristics. This difference in fertility behavior by nativity is not apparent at older ages. Maternal employment during the respondent’s adolescence is not associated with early fertility in any data set.
Table 4b shows results from the same models for women. The results for women are largely consistent across data sets although the difference in magnitude of the coefficients is sometimes large (e.g. the coefficient for low maternal education ranges from 1.3 to 2.1). As Hypothesis 1 predicts, women from more disadvantaged backgrounds (e.g. women growing up in non-traditional family structures, racial minorities, and women with less educated mothers) are more likely to experience early first births. Similar to our findings for men, being foreign born reduces the likelihood of fertility as a teenager, though not in the NLSY97. As Hypothesis 3 predicts, these associations are stronger in the teenage years and weaker (though often still significant) by ages 23–24.
Hypothesis 3 suggests that the weakening relationship between disadvantage and early fertility with age may be more pronounced for men than for women. Results from Tables 4a and 4b show that this weakening occurs for both women and men. Although differences by sex are not pronounced, the models for women contain more significant associations and are more consistent across data sources at 23–24 than the models for men.
Table 5a:
Logistic regression models: Odds of first birth for men, by age and raceMEN Mom <HS
Mom
>HS Step-Parent Single Parent
No Parent
Foreign Born
Matern.
Empl. N of spells 15 – 19
White NLSY97 2.798* 0.657+ 2.633* 1.172 1.387 - 0.756 11,044 White NLSY79 1.724* 0.339* 2.664* 2.026* 4.567* - 0.753 12,026 White NSFG 1.755* 0.657+ 2.979* 2.053* 2.808* 0.349* 0.889 12,090 Af-Am NLSY97 1.294 0.624* 2.094* 2.236* 2.482* 0.283 0.825 5,194 Af-Am NLSY79 1.262 0.860 0.958 1.102 0.964 0.376 0.961 6,915 Af-Am NSFG 1.531 1.037 2.595* 1.455 1.296* 0.583 0.886 3,873 Hispanic NLSY97 1.188 0.410* 0.678 2.146* 1.892 0.751 1.164 4,299 Hispanic NLSY79 1.730* 0.141+ 1.187 0.997 1.328 0.606* 1.040 4,611 Hispanic NSFG 0.723 0.507+ 1.134 1.987* 2.111+ 1.121 1.208 4,583 20 – 22
White NLSY79 1.870* 0.415* 1.350 0.936 1.416 0.725 0.992 6,532 White NSFG 1.655* 0.515* 1.730* 1.564+ 1.852 0.576 1.178 5,518 Af-Am NLSY79 0.981 0.363* 1.280 0.927 1.146 1.136 0.847 3,223 Af-Am NSFG 0.865 0.637+ 1.996* 1.262 1.071 0.503+ 0.953 1,701 Hispanic NLSY79 1.148 0.782 1.338 1.095 0.698 1.193 0.748+ 2,260 Hispanic NSFG 1.166 0.397* 1.381 0.804 0.824 1.047 1.238 2,000 23 – 24
White NLSY79 1.989* 0.680+ 1.567+ 0.597+ 2.115+ 0.463 1.018 3,777 White NSFG 0.856 0.475* 2.205* 1.026 1.743 0.669 1.130 2,912 Af-Am NLSY79 1.075 0.676 0.687 0.587* 0.466+ 0.678 0.703+ 1,667 Af-Am NSFG 1.124 0.640 1.835 0.847 0.296* 0.743 0.983 834 Hispanic NLSY79 1.499 1.197 0.678 1.456 1.886 1.508+ 1.009 1,198 Hispanic NSFG 1.583 1.039 1.554 1.547 0.655 1.178 0.778 967
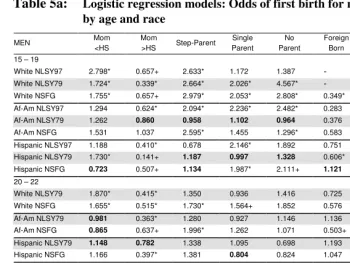
Notes: Each row represents a separate logistic regression model. (-) indicates a variable that drops from analyses due to inadequate variation. N of spells is the number of spells in each separate regression model. All models include controls for imputation flags, cohort where relevant, and a linear age variable (results not shown). Omitted comparison groups for categorical variables are respondent’s mother has a high school degree and respondent lived with both biological parents. Robust standard errors in parentheses; NLSY surveys are clustered by household. * p < .05; + p < .10. Coefficients in bold indicate a significant difference (white = omitted category) based on models interacting all substantive independent variables with race (p<.10). All interactions are tested within age groups.
living in a step-parent family and teen fertility in the NSFG and the NLSY97, but not in the NLSY79.
Results for men raised in single parent families are also mixed. There is some evidence that living in a single parent family during adolescence is associated with higher teen fertility for men of all races, although this association is not consistent across data sets. At ages 20–22 there are few associations between living in a single parent family and male fertility. By ages 23–24 for white and African-American men, there is some indication that being raised in a single parent family is associated with fewer births, though this result does not hold for Hispanics and is not consistent across data sets. Maternal employment is not associated with teenage first births for men in any model.
In sum, results from our analyses support Hypothesis 4, indicating that there are some differences in the associations between family background and early male fertility by race/ethnicity, with stronger results for whites than for minorities. When there are significant associations between family background and early male fertility for minorities, they are in the expected direction (a disadvantaged background is associated with a greater likelihood of an early first birth), but the associations are less consistent across data sources. Thus the possibility raised in Hypothesis 6 of inconsistencies across data sets for men is clear when models are run separately by race. Future research will formally test whether these differences are due to cohort changes or data set differences, but scholars performing analyses using these data sources should be aware of these differences and should exercise caution when interpreting results.
Table 5b: Logistic regression models: Odds of first birth for women, by age and race
WOMEN Mom <HS
Mom
>HS Step-Parent Single Parent No Parent Foreign Born Matern.
Empl. N of spells 15 – 17
White NLSY97 2.358* 0.751 3.595* 3.399* 7.201* 0.312 0.834 6,573 White NLSY79 2.795* 0.411* 1.911* 1.568+ 2.219* 0.540 0.956 7,301 White NSFG 1.653* 0.417* 1.846* 1.576* 3.840* 0.543* 0.975 12,477 Af-Am NLSY97 1.441 0.491* 0.947 1.697* 3.601* - 0.929 3,225 Af-Am NLSY79 1.543* 0.279* 1.789* 1.483* 2.247* 0.099* 1.196 4,118 Af-Am NSFG 1.134 0.608* 0.997 1.384* 1.360 0.240* 1.294 3,974 Hispanic NLSY97 1.742+ 0.473 1.557 2.145* 3.353* 0.847 0.953 2,598 Hispanic NLSY79 4.496* 0.830 1.837* 1.470+ 1.811+ 0.742 1.059 2,833 Hispanic NSFG 1.331 0.461* 2.839* 1.885* 2.183* 0.883 0.949 3,994 18 - 19
White NLSY97 3.098* 0.621* 1.808* 2.181* 3.521* 0.326 0.739+ 3,520 White NLSY79 2.518* 0.432* 1.792* 1.119 1.827 0.444 1.075 4,485 White NSFG 1.758* 0.416* 2.312* 1.652* 2.458* 0.499* 0.888 7,368 Af-Am NLSY97 1.233 0.630* 1.851* 1.790* 1.409 0.582 0.943 1,586 Af-Am NLSY79 1.414* 0.399* 1.754* 1.607* 1.962* 0.950 0.870 2,168 Af-Am NSFG 1.029 0.450* 1.631* 1.214 0.932 0.190* 0.912 2,053 Hispanic NLSY97 1.344 0.753 1.464 1.384 1.102 1.262 0.849 1,298 Hispanic NLSY79 1.712* 0.673 1.632+ 1.244 1.602 0.722 1.053 1,598 Hispanic NSFG 1.539* 0.781 1.648* 1.122 1.384 0.789 0.825 2,133 20 – 22
White NLSY79 1.590* 0.353* 2.278* 1.296 3.065* 0.882 1.322* 5,692 White NSFG 1.753* 0.583* 1.481* 1.298* 2.084* 0.567* 1.036 8,727 Af-Am NLSY79 0.941 0.570* 1.461 1.250 1.435 0.327* 0.955 2,355 Af-Am NSFG 1.331 0.848 0.989 0.833 1.025 0.499* 1.167 2,128 Hispanic NLSY79 1.367 0.504 1.851* 1.681* 1.368 1.190 0.779 1,790 Hispanic NSFG 1.325 0.937 1.221 1.674 * 1.671+ 1.043 1.077 2,249 23 – 24
White NLSY79 1.396* 0.619* 1.499 0.747 0.771 1.707+ 1.190 3,160 White NSFG 1.433* 0.909 1.796* 1.107 1.772+ 0.884 1.081 4,449 Af-Am NLSY79 0.987 0.537+ 2.789* 1.098 0.867 0.351 0.922 1,164 Af-Am NSFG 0.851 0.691 1.511 0.697 1.010 0.911 1.094 996 Hispanic NLSY79 1.654+ 0.834 1.041 1.206 4.026* 1.121 0.681+ 896 Hispanic NSFG 2.197* 0.905 0.890 1.361 1.020 1.254 0.921 1,014
Table 5c: Summary of significant interactions by sex for logistic regression models, by age and race
Mom <HS
Mom
>HS Step-Parent Single Parent
No Parent
Born out of Marriage
Foreign Born
Matern.
Empl. N of spells 15 – 19
White NLSY97 W+ W+ - 20,845 White NLSY79 W+ M+ M+ - 23,812
White NSFG 31,935
Af-Am NLSY97 M+ - 10,005
Af-Am NLSY79 W- W+ W+ 13,201
Af-Am NSFG W- M+ W- 9,900
Hispanic NLSY97 W+ 8,195
Hispanic NLSY79 9,042
Hispanic NSFG W+ 10,710
20 – 22
White NLSY79 W+ 12,224
White NSFG 14,245
Af-Am NLSY79 W- 5,578
Af-Am NSFG M+ 3,829
Hispanic NLSY79 4,050
Hispanic NSFG M- W+ 4,249
23 – 24
White NLSY79 W+ 6,937
White NSFG M- 7,361
Af-Am NLSY79 W+ M- 2,831
Af-Am NSFG 1,829
Hispanic NLSY79 2,094
Hispanic NSFG 1,981
Notes: Each row represents a separate logistic regression model. (-) indicates a variable that is not included from a particular data set. Cells with any marks indicate a significant difference between women and men based on models interacting all substantive independent variables with a dummy variable for sex (p < .10). Cells include a (W) or (M) based on whether the effect is stronger for women or men and a (+) or (-) depending on whether the variable for the stronger sex is positively or negatively associated with early fertility. All interactions are tested within age and race groups. All models include controls for imputation flags, cohort where relevant, and a linear age variable (results not shown). N of spells is the number of spells in the interaction model that combines data from women and men. Omitted comparison groups for categorical variables are respondent’s mother has a high school degree and respondent lived with both biological parents.
whether the variable is more strongly associated with first births for women or men and a (+) or (-) depending on whether the variable for the sex with the larger association is positively or negatively associated with early fertility. For example, a “W+” indicates that women with a particular characteristic are more likely to have an early first birth than men with this same characteristic. Strong evidence of sex differences would be apparent if effects were similar across data sets and if the evidence followed a consistent pattern. In Table 5c, sex differences appear to be sporadic, not consistent. While we do not feel there is strong evidence of consistent, theoretically-relevant sex differences, a few rough patterns deserve mention. Of twenty-three significant sex differences, fourteen are in the 15–19 age range and ten of these fourteen indicate stronger effects of background characteristics for women than men. In addition, eleven of the twenty-three sex differences are in the African-American sample, with five of the seven effects that are stronger for women than men occurring during the teenage years. These patterns may indicate that the factors associated with teen fertility are slightly stronger for women than men, particularly in the African-American sample, though we have been unable to identify a consistent pattern with theoretical implications. These findings lend the most support to Hypothesis 6, which states that there will be differences across data sets. For example, results from only the NLSY79 would indicate that family structure is more strongly associated with teen fertility for men than for women, but results from the NLSY97 would lead one to the opposite conclusion.
Hypothesis 5 indicates that there may not be significant differences in the effects of family background characteristics on early first births for men across cohorts. In analyses conducted with the NSFG, very few significant differences in the effects of covariates were found by cohort, despite large changes over time in patterns of maternal
employment, education, and family structure.18 However, we are hesitant to conclude
that these differences do not exist, as we cannot analyze the NSFG by race and cohort simultaneously due to small cell sizes. Further research is necessary to test for cohort differences in the effects of family background characteristics over time.
8. Discussion
This study seeks to provide systematic baseline information on early male fertility by conducting parallel analyses in three large nationally representative data sets. Despite the various methods used to collect fertility data across the data sets and the small number of births on which some of the early estimates are based, descriptive estimates of men’s ages at first birth by race appear relatively consistent. Our descriptive results
indicate that having a first birth as a teenager is far more common for women than for men. There are clear race differences in early male fertility, with minority men experiencing much higher rates of early first births than white men. Even in minority groups, however, only a small proportion of men experience their first birth during the high school years. The NSFG data shows slightly lower rates of early fertility for men, and further research should examine whether this is due to cohort differences, the composition of the NSFG sample, or retrospective data collection. The gap between early male fertility and early female fertility is approximately three years and is consistent within race/ethnic groups. The findings from all three data sets are consistent with prior research.
Multivariate results yielded both substantive findings and differences across data sets. Substantively, as prior studies have shown and theory predicts, men from disadvantaged backgrounds are more likely to experience early first births than men from more advantaged backgrounds. Models testing for age differences show that many associations between family background and fertility are weaker at older ages than during the teenage years, but some indicators, particularly maternal education, have not disappeared by ages 23–24 for women or men. Births at these ages may still carry opportunity costs for both women and men seeking to establish careers or invest in graduate education. Given the age difference between partners, it is unclear whether these births have opportunity costs for men or whether these men are likely to partner with younger women for whom having a birth at 20–22 has significant costs.
The association between family background characteristics and early fertility is less consistent and weaker for minority men than for white men, similar to findings of Rindfuss, Morgan, and Swicegood (1988). It is unclear whether this is due to smaller sample sizes for minority men or whether these family background characteristics are not as good proxies for the opportunities available to minority men as they are for white men. Future analyses with the NLSY surveys will address this limitation by including a richer set of variables, such as local labor market conditions and social policy contexts in order to examine this question further.