in the population sciences published by the Max Planck Institute for Demographic Research Konrad-Zuse Str. 1, D-18057 Rostock · GERMANY www.demographic-research.org
DEMOGRAPHIC RESEARCH
VOLUME 19, ARTICLE 51, PAGES 1759-1780
PUBLISHED 02 OCTOBER 2008
http://www.demographic-research.org/Volumes/Vol19/51/ DOI: 10.4054/DemRes.2008.19.51
Research Article
Trends in educational mortality differentials
in Austria between 1981/82 and 2001/2002:
A study based on a linkage of
census data and death certificates
Johannes Klotz
Gabriele Doblhammer
© 2008 Klotz & Doblhammer.
1 Introduction 1760
2 Data and methods 1761
2.1 Data sources 1761
2.2 Educational levels 1762
2.3 Methods and measures 1762
3 Results 1764
3.1 Life expectancy at age 35 by educational level 1764 3.2 Age standardized death rates and regression-based measures 1765
3.3 Age-specific analysis 1769
3.4 Cause-specific analysis 1770
4 Discussion 1770
4.1 Main findings of the study 1770 4.2 Limitations of the study 1771 4.3 Comparison with results from other countries in the 1990s 1772
5 Acknowledgements 1776
Trends in educational mortality differentials
in Austria between 1981/82 and 2001/2002:
A study based on a linkage of census data and death certificates
Johannes Klotz1
Gabriele Doblhammer2
Abstract
Background—Many studies for European populations found an increase in socio-economic mortality differentials during the last decades of the 20th century, at least in
relative terms. The aim of our paper is to explore the situation in Austria, for a wide age range, over a period of 20 years.
Methods—Based on a linkage of census information and death certificates, we computed age and education specific death rates. We calculate life expectancies at age 35 by educational level as well as regression-based measures of absolute (SII) and relative (RII) inequality, for the periods 1981/82, 1991/92, and 2001/2002.
Results—Life expectancy increased faster for the higher educated in the 1980s, whereas this trend reversed in the following decade. For males at working ages an increase in relative mortality differentials was observed during the 1980s. Absolute mortality differentials decreased among elderly females in the 1990s, particularly for circulatory disease mortality. Altogether the educational pattern of mortality was rather stable in Austria at the end of the 20th century.
Conclusions—Compared with results from other countries, trends in educational mortality differentials seem to be rather favorable in Austria in the 1990s. A stable health care system, the healthy migrant effect, and relatively low unemployment rates may have contributed to stable mortality differentials. However, an important explanation is also the inclusion of higher ages in our study.
1 Statistics Austria, Vienna. E-mail: [email protected]
1. Introduction
The existence of a relationship between socio-economic status (SES) and mortality is nowadays beyond dispute. All available studies on the topic show that people with a higher SES face lower mortality risks, regardless of whether the SES is measured by education, occupation, income, or place of residence (Blakely et al. 2004; Boyle et al. 2004; Cesaroni et al. 2006; Huisman 2004; Kunst 1997; Vallin et al. 2001). This finding holds for both sexes, most causes of death, and all age groups. Even in the age group 75+, beyond premature mortality, significant mortality advantages of the better-off can be observed (Huisman et al. 2005).
Large mortality differentials by SES are also documented for Austria. Doblhammer (1996) reported significant excess mortality of manual workers and people with no further education in the early 1980s, particularly among males at working ages. A very high cause specific social gradient was found for accidents,
suicide, and certain types of cancer. Klotz (2007) estimated that at the turn of the 21st
century the life expectancy gap at age 35 between the highest and the lowest educational group was 6.2 years for males and 2.8 years for females. International comparisons of European populations in the 1990s suggested for Austria an over-proportional educational gradient in stroke mortality (Avendano et al. 2004) and an average educational gradient in ischemic heart disease mortality (Avendano et al. 2006).
For many European populations it was reported that relative socio-economic mortality differentials increased during the 1980s, whereas absolute differentials were rather stable (Huisman 2004; Kunst 1997). The life expectancy gap between the higher and lower social strata widened for instance in England/Wales, Sweden, Finland, or the city of Turin (Vallin et al. 2001). Mackenbach et al. (2003) mention a faster decline in circulatory disease mortality among the non-manual classes as a major explanation for increasing inequality in a series of countries; also alcohol-associated mortality and external causes of death are cited as influential (Mackenbach et al. 2003; Martikainen et al. 2001).
Concerning trends in Europe in the entire 1990s, studies found that the socio-economic mortality gap was widening further in England/Wales (Davey Smith et al. 2002) and in Denmark (Brønnum-Hansen and Baadsgard 2008). For the city of Rome an increase in relative differentials during the 1990s and a stabilization at the very end
of the 20th century was reported (Cesaroni et al. 2006), whereas for Barcelona relative
A more extreme picture was observed for former communist Middle and Eastern European transformation countries, where the introduction of market economy after 1989 went along with a huge increase in the social gradient of mortality. In Russia mortality rates increased for both the higher and the lower educated, but stronger for the lower educated (Vallin et al. 2001), whereas in Estonia and in the city of Budapest mortality rates declined among the better-off and were stable or increased among the lower classes (Leinsalu et al. 2003; Józan and Forster 1999).
Time series data for Austria are yet only sparsely available. A comparison of educational and occupational mortality risks in 1981/82 and 1991/92 suggested an increase in relative mortality differentials among males at ages 50-69 (Doblhammer et al. 2005). Rau et al. (2007) mentioned that a faster reduction of circulatory disease mortality, particularly ischemic heart disease mortality, among the higher educated in the 1980s was also observed for Austria. Regression-based measures for the same data were calculated by Schwarz (2006), but restricted to premature mortality.
The aim of our paper is to present trends in educational inequalities in mortality for the entire range of adult ages in Austria in the 1980s and 1990s. We compare mortality risks for the population aged 35-94 years by educational level, based on a linkage of census information and death certificates. We calculate life expectancies for educational groups as well as regression-based measures (to account for the change in the educational distribution of the population over time). Trends in both absolute and relative mortality differentials are examined specifically for working and retirement ages as well as for circulatory disease mortality and all other causes of death. This analysis of a German-speaking country might be a useful complement in international comparisons.
2. Data and methods
2.1 Data sources
2.2 Educational levels
Education is a desirable predictor of the SES, since it is available for the entire population (regardless of whether in the labor force or not), and it is usually constant at adult ages. Additionally, because of the public regulation of the educational system, educational grades are standardized and widely known, so it is easy to collect them in a census. Furthermore, the item nonresponse rate is low (in the 2001 census it was overall 3.6%), and there is no evidence of a large misreport rate.
The highest education completed is classified into five categories: primary, which means no education completed or compulsory school only; apprenticeship, that is lower vocational training; lower secondary, meaning intermediate technical and vocational education; higher secondary, providing a general qualification for university entrance; and tertiary, which means a university degree or similar.
After WW II, particularly since the 1970s, Austria has experienced a substantial educational expansion of the population (Bauer 2005). Therefore the educational distribution of the population differed substantially at the three censuses, as given by Table 1, where also the educational distribution of the matched deaths is reported (the actual number of deaths is around 10% higher than the matched number of deaths).
2.3 Methods and measures
We analyzed mortality risks for the entire Austrian population aged 35-94 years. All analyses were stratified by sex.
Age and education specific death rates for 5-year age groups were computed by dividing the adjusted number of deaths by the risk population, with the adjusted number of deaths obtained by dividing the matched number of deaths by the age and sex specific merging rate.
As a summary measure for mortality, we calculated period life expectancies at age 35. We used the 5-year age and education specific death rates, from 35-39 to 90-94 years, and the general death rate for males and females at age 95+ from the official life tables. Standard errors were calculated by the method of Chiang (1984: ch. 8).
and Mackenbach (1994). The SII indicates absolute mortality differentials between the hypothetically lowest and highest educated, the RII the respective excess mortality. When applied to disjoint events like deaths from different causes of death, the overall SII equals the sum of the partial SII’s, whereas the overall RII is a weighted mean of the partial RII’s. Asymptotic standard errors of SII and RII were calculated by first-order Taylor series expansions (Wolter 1985: ch. 6).
Table 1: Educational distribution of male and female population (aged 35-94 years) and matched deaths by census year
Distribution by educational level in % Census or
period Total Primary Apprentice-ship
Lower Secondary
Upper Secondary
Tertiary
Male population
1981 1634089 40.7 39.4 7.3 7.1 5.6
1991 1789191 31.5 45.1 7.8 8.1 7.4
2001 2101547 22.7 50.6 7.4 9.7 9.5
Male matched deaths
1981/82 36982 52.5 32.7 6.1 5.0 3.7
1991/92 32799 45.2 38.9 6.2 5.5 4.1
2001/2002 31139 39.7 42.8 5.6 6.5 5.4
Female population
1981 2096683 68.1 13.8 11.9 4.5 1.6
1991 2171803 57.6 19.6 13.9 5.5 3.4
2001 2406892 45.9 23.6 16.6 7.2 6.7
Female matched deaths
1981/82 41574 81.5 8.0 7.4 2.4 0.6
1991/92 39044 77.2 11.3 7.9 2.7 1.0
2001/2002 35614 71.0 13.5 9.7 3.8 1.9
only a minority of all deaths at age 35-94 (in 2001/2002 the proportion was 26.2% for males and 11.7% for females), but because the number of potential years of life lost is high, they can have a relatively large impact on life expectancy differentials (Klotz 2007; for theoretical considerations see Keyfitz 1977: ch. 3).
Circulatory disease mortality is often cited as a major explanation of socio-economic mortality differentials in developed countries (Avendano et al. 2006; Fawcett et al. 2005; Huisman et al. 2005) as well as their widening (Mackenbach et al. 2003; Martikainen et al. 2001). Therefore we also calculated specific SII and RII for circulatory disease mortality and all other causes of death. That distinction is also of particular interest for Austria because circulatory disease mortality roughly accounts for half of all deaths in the analyzed age range (in 2001/2002 the proportion was 45.4% for males and 55.4% for females).
3. Results
3.1 Life expectancy at age 35 by educational level
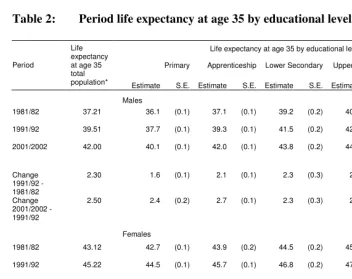
For males in the 1980s we observe a widening life expectancy gap between the higher and the lower educated (Table 2). Period life expectancy at age 35 increased by 2.8 years for men with tertiary education, but only by 1.6 years for men with primary education. The increases of the intermediate educational groups ranged between 2.1 and 2.3 years. This trend did not continue in the 1990s, when life expectancy gains were highest for men with apprenticeship (2.7 years) and second highest for men with primary education (2.4 years), whereas in the highest educational group the increase was lowest (1.9 years). Total male life expectancy at age 35 increased by 4.8 years in the 1980s and 1990s combined, what is more than all but one education specific gains. That phenomenon can be explained by the educational expansion of the population (more males belonged to higher education groups in 2001 than in 1981, cf. Table 1).
Table 2: Period life expectancy at age 35 by educational level
Life expectancy at age 35 by educational level
Primary Apprenticeship Lower Secondary Upper secondary Tertiary Period
Life expectancy at age 35 total
population* Estimate S.E. Estimate S.E. Estimate S.E. Estimate S.E. Estimate S.E.
Males
1981/82 37.21 36.1 (0.1) 37.1 (0.1) 39.2 (0.2) 40.3 (0.2) 41.5 (0.3)
1991/92 39.51 37.7 (0.1) 39.3 (0.1) 41.5 (0.2) 42.5 (0.2) 44.3 (0.2)
2001/2002 42.00 40.1 (0.1) 42.0 (0.1) 43.8 (0.2) 44.5 (0.2) 46.2 (0.2)
Change 1991/92 - 1981/82
2.30 1.6 (0.1) 2.1 (0.1) 2.3 (0.3) 2.2 (0.3) 2.8 (0.4)
Change 2001/2002 - 1991/92
2.50 2.4 (0.2) 2.7 (0.1) 2.3 (0.3) 2.1 (0.3) 1.9 (0.3)
Females
1981/82 43.12 42.7 (0.1) 43.9 (0.2) 44.5 (0.2) 45.0 (0.3) 46.0 (0.5)
1991/92 45.22 44.5 (0.1) 45.7 (0.1) 46.8 (0.2) 47.5 (0.3) 48.2 (0.4)
2001/2002 47.28 46.6 (0.1) 47.8 (0.1) 48.6 (0.1) 48.8 (0.2) 49.4 (0.3)
Change 1991/92 - 1981/82
2.09 1.8 (0.1) 1.8 (0.2) 2.3 (0.2) 2.5 (0.4) 2.1 (0.7)
Change 2001/2002 - 1991/92
2.06 2.1 (0.1) 2.0 (0.2) 1.7 (0.2) 1.3 (0.3) 1.2 (0.5)
* Values taken from the official life tables for Austria 1980/82, 1990/92, and 2000/2002, respectively (www.statistik.at).
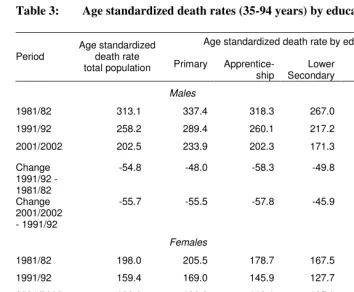
3.2 Age standardized death rates and regression-based measures
Table 3: Age standardized death rates (35-94 years) by educational level
Age standardized death rate by educational level Period
Age standardized death rate
total population Primary Apprentice-ship
Lower Secondary
Upper secondary
Tertiary
Males
1981/82 313.1 337.4 318.3 267.0 242.4 224.9 1991/92 258.2 289.4 260.1 217.2 199.1 175.6 2001/2002 202.5 233.9 202.3 171.3 165.9 141.2
Change 1991/92 - 1981/82
-54.8 -48.0 -58.3 -49.8 -43.4 -49.3
Change 2001/2002 - 1991/92
-55.7 -55.5 -57.8 -45.9 -33.2 -34.4
Females
1981/82 198.0 205.5 178.7 167.5 163.5 142.9 1991/92 159.4 169.0 145.9 127.7 120.4 110.0 2001/2002 123.8 132.2 118.1 105.9 102.5 97.8
Change 1991/92 - 1981/82
-38.6 -36.5 -32.8 -39.8 -43.1 -33.0
Change 2001/2002 - 1991/92
-35.6 -36.8 -27.8 -21.8 -18.0 -12.2
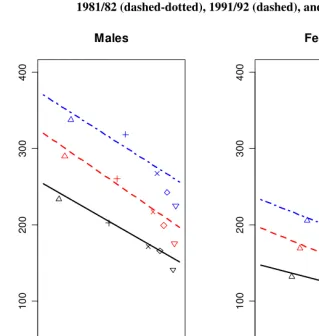
Figure 1: Weighted least squares regression of age standardized death rates: 1981/82 (dashed-dotted), 1991/92 (dashed), and 2001/2002 (solid)
0.0 0.2 0.4 0.6 0.8 1.0
0
1
0
0
2
0
0
3
0
0
4
0
0
Males
Educational level percentile
0.0 0.2 0.4 0.6 0.8 1.0
0
1
0
0
2
0
0
3
0
0
4
0
0
Females
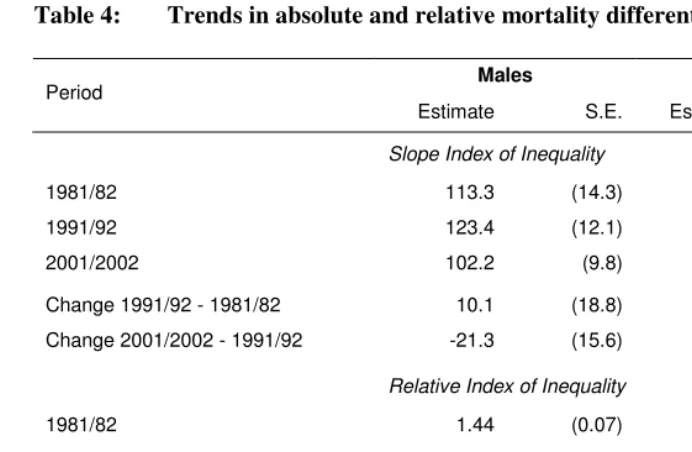
Table 4: Trends in absolute and relative mortality differentials
Males Females
Period
Estimate S.E. Estimate S.E.
Slope Index of Inequality
1981/82 113.3 (14.3) 70.8 (10.8)
1991/92 123.4 (12.1) 73.5 (8.1)
2001/2002 102.2 (9.8) 46.1 (6.7)
Change 1991/92 - 1981/82 10.1 (18.8) 2.7 (13.5) Change 2001/2002 - 1991/92 -21.3 (15.6) -27.4 (10.5)
Relative Index of Inequality
1981/82 1.44 (0.07) 1.44 (0.08)
1991/92 1.63 (0.08) 1.60 (0.09)
2001/2002 1.67 (0.09) 1.46 (0.08)
Change 1991/92 - 1981/82 0.19 (0.11) 0.16 (0.12) Change 2001/2002 - 1991/92 0.05 (0.12) -0.14 (0.12)
For males we observe a slight widening of absolute differentials in the 1980s and a reversion in the subsequent decade. As absolute mortality differentials did not change substantially but the general level of mortality declined, relative differentials have increased. The RII was 1.67 in 2001/2002, compared with 1.44 in 1981/82. However, standard errors indicate that the results are only partly statistically significant. For women we observe stable absolute differentials in the 1980s—the regression lines are
almost parallel. On the contrary, in the 1990s the SII decreased significantly (p =
0.005), by about one third. Relative differentials among females in the entire age range 35-94 were fairly stable. The RII was 1.46 in 2001/2002, compared with 1.44 in 1981/82.
3.3 Age-specific analysis
Absolute mortality differentials among men at working ages (35-64) as well as at retirement ages (65-94) did not change significantly from 1981/82 to 2001/2002 (Table 5). However, relative mortality differentials at ages 35-64 statistically increased in the
1980s (p = 0,015). We see that the RII was much larger at working ages than at
retirement ages, with increasing discrepancy. Deaths at ages 35-64 contribute about one third to total absolute mortality differentials among males.
Table 5: Age specific trends in absolute and relative mortality differentials
Males Females
Deaths at ages 35-64
Deaths at ages 65-94
Deaths at ages 35-64
Deaths at ages 65-94 Period
Estimate S.E. Estimate S.E. Estimate S.E. Estimate S.E.
Slope Index of Inequality
1981/82 38.5 (5.1) 74.8 (13.4) 9.2 (3.5) 61.6 (10.2) 1991/92 43.7 (4.0) 79.8 (11.4) 9.6 (2.9) 63.9 (7.6) 2001/2002 34.6 (3.4) 67.6 (9.2) 9.6 (2.4) 36.5 (6.2)
Change 1991/92 - 1981/82
5.2 (6.5) 4.9 (17.6) 0.3 (4.6) 2.3 (12.7)
Change 2001/2002 - 1991/92
-9.1 (5.3) -12.2 (14.7) 0.0 (3.8) -27.4 (9.8)
Relative Index of Inequality
1981/82 1.86 (0.16) 1.35 (0.07) 1.38 (0.17) 1.45 (0.09) 1991/92 2.50 (0.24) 1.48 (0.08) 1.52 (0.20) 1.61 (0.10) 2001/2002 2.68 (0.30) 1.52 (0.09) 1.69 (0.24) 1.42 (0.09)
Change 1991/92 - 1981/82
0.64 (0.29) 0.12 (0.11) 0.14 (0.26) 0.17 (0.13)
Change 2001/2002 - 1991/92
For women we observe a significant decrease of absolute differentials at ages
65-94 in the 1990s (p = 0,003), whereas no changes at working ages occurred. Absolute
mortality differentials at ages 35-64 play only a minor role for females. Compared with the male population, we see that relative inequalities among females are smaller at working ages, whereas they are similar at retirement ages.
3.4 Cause-specific analysis
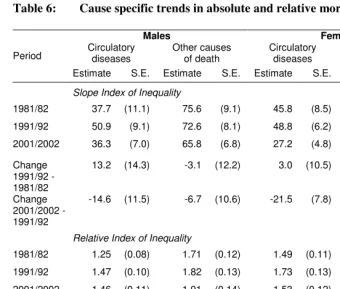
Circulatory disease mortality explains about one third of the absolute mortality differentials among men and almost two third among women (Table 6). Relative inequalities among males are smaller for circulatory disease mortality than for other causes of death, whereas for females rather the opposite holds. We observe a significant decline in absolute differentials in circulatory disease mortality among women in the
1990s (p = 0,003) and no significant changes in other absolute or relative cause specific
differentials. The decrease in circulatory disease mortality differentials among women in the 1990s is correlated with the reduction of mortality differentials at retirement ages, since the great majority of circulatory disease deaths occur after the age of 65.
4. Discussion
4.1 Main findings of the study
Life expectancy at age 35 has significantly increased in Austria for all educational groups from 1981/82 to 2001/2002. However, in the 1980s gains were larger among the higher educated, whereas this trend revised in the 1990s. Regression-based measures indicate an increase in relative mortality differentials among males at working ages in the 1980s, and a decrease in absolute mortality differentials among females at retirement ages in the 1990s, the latter caused mainly by a reduction of the educational gradient in circulatory disease mortality. Altogether the pattern of mortality by
Table 6: Cause specific trends in absolute and relative mortality differentials
Males Females
Circulatory diseases
Other causes of death
Circulatory diseases
Other causes of death Period
Estimate S.E. Estimate S.E. Estimate S.E. Estimate S.E.
Slope Index of Inequality
1981/82 37.7 (11.1) 75.6 (9.1) 45.8 (8.5) 25.0 (6.7) 1991/92 50.9 (9.1) 72.6 (8.1) 48.8 (6.2) 24.7 (5.3) 2001/2002 36.3 (7.0) 65.8 (6.8) 27.2 (4.8) 18.3 (4.6)
Change 1991/92 - 1981/82
13.2 (14.3) -3.1 (12.2) 3.0 (10.5) -0.3 (8.5)
Change 2001/2002 - 1991/92
-14.6 (11.5) -6.7 (10.6) -21.5 (7.8) -6.4 (7.1)
Relative Index of Inequality
1981/82 1.25 (0.08) 1.71 (0.12) 1.49 (0.11) 1.36 (0.12) 1991/92 1.47 (0.10) 1.82 (0.13) 1.73 (0.13) 1.45 (0.12) 2001/2002 1.46 (0.11) 1.91 (0.14) 1.53 (0.12) 1.38 (0.11)
Change 1991/92 - 1981/82
0.22 (0.13) 0.10 (0.17) 0.24 (0.17) 0.08 (0.16)
Change 2001/2002 - 1991/92
-0.01 (0.15) 0.09 (0.19) -0.20 (0.17) -0.07 (0.16)
4.2 Limitations of the study
Our study has several limitations. First, people living in Austria but dying abroad are not included in the Austrian death records, so these abroad deaths cannot be linked to census data. If the probability of an abroad death depends on education, then we over- or underestimate educational mortality differentials in Austria. The number of abroad deaths is unknown, but can be assumed to be small, since the complementary total, which is the number of people living abroad but dying in Austria, accounts for only about 1% of all deaths in Austria.
a discussable assumption, especially because the merging procedures essentially relied on the last residential address of the deceased, and it is conceivable that residential mobility varies between the educational groups. As the 2001/2002 merging procedure yielded the highest overall merging rate (94%, compared to each 90% in 1981/82 and 1991/92), the accuracy might be highest for the 2001/2002 results.
The Austrian educational system is highly regulated by federal law, and the general pattern of the system has not changed for many decades. Therefore in principle the classification is comparable over time, and the validity of the answers can be assumed to be high. However, though the educational levels are comparable over time, the associated social strata can be affected by temporal change, as a consequence of the educational expansion in Austria after WW II. For instance, primary education might have a lower reputation today than in earlier times. Regression-based measures take the change in the educational distribution of the population into account, but their validity relies on the assumption of a linear relationship between educational level and mortality. However, Figure 1 indicates that this assumption might be acceptable.
Temporal changes in coding behavior may have an impact on the comparability of cause of death results. In our study, however, such an impact might be minor, as we analyze very broad cause of death categories (circulatory diseases vs. all other causes of death).
4.3 Comparison with results from other countries in the 1990s
Compared with the results from other Western European societies (where “Western” refers to traditional market economy countries), trends in socio-economic differentials in mortality in the 1990s seem to be rather favorable in Austria. A similar result— absolute decrease, relative stability—was observed for Barcelona (Borrell et al. 2008), whereas all other available studies reported a further increase in relative inequality (see introduction).
Is Austria better off, and if yes, why? Data problems can play a role, but it is unlikely that they contribute much since the data sources are of high quality, individual matching avoids the numerator-denominator-problem, and the overall merging rate exceeds 90%. Furthermore, even if education does have an impact on abroad mortality or the linkage success, trend results would be affected only if such an impact had changed over time. For instance, if we over-estimated the true life expectancy for tertiary educated men by, say, 0.5 years in each period, then our numbers concerning the respective life expectancy gains would still be correct.
middle-aged population or premature mortality. Table 5 indicates that the trend was worse at working ages than at retirement ages; if we had analyzed only the age group 35-64, the observed trend would have been less favorable. We agree with Martikainen et al. (2001) that “the contribution of older ages to social inequalities in mortality should be more widely recognized”.
Fawcett et al. (2005) suggest that the radical restructuring of the social welfare system in New Zealand in the 1980s, including the introduction of user charges for health services, contributed to the increasing excess mortality of the ethnic minority groups. Also Józan and Forster (1999) mention the change in health care systems since 1990 as a possible explanation for widening health inequalities in Eastern Europe. In Austria no mentionable changes in access to the public health care system occurred during the last decades. The compulsory public insurance has covered about 98% of the population for a long time (Fuchs et al. 2003), and the prevalence of additional private health insurance was fairly stable from 1979-1993 (Table 7), indicating that the quality of the public health care system cannot have worsened considerably. That stability of the Austrian health care system during the last decades may have supported stability in educational mortality differentials.
Table 7: Prevalence (%) of additional private health insurance in Austria 1979-1993
Prevalence by occupational class of head of household Year Prevalence, all
households
Farmer
Self-employed
Non-Manual Manual Retired
1979 37 22 64 51 36 24
1984 38 25 59 52 36 28
1989 37 28 59 48 35 28
1993 34 25 54 41 32 27
Source: Wolf and Kronsteiner (1995).
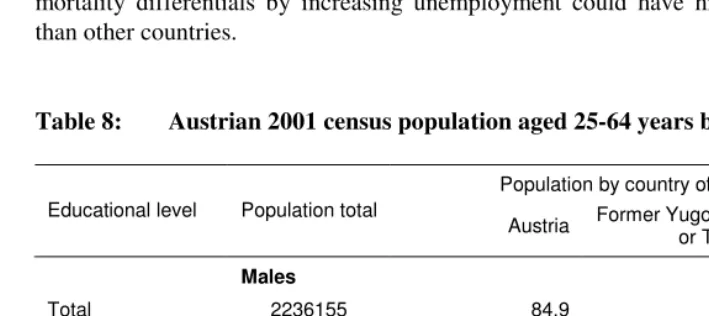
immigrants from these countries have completed only primary education, so they account for an over-proportional fraction of the population in the lowest educational group (Table 8). Our findings indicate that the increase in relative mortality differentials among males aged 35-64 stopped in the 1990s, when concurrently the proportion of labor migrants at that age increased. Thus, part of the stabilization of mortality differentials in the 1990s could be due to the healthy migrant effect.
Some studies suggest that employment is an important predictor for mortality risks. Leclerc et al. (2006) report that between 1968/74 and 1990/96 mortality differentials between occupational groups were stable among the employed French population, but relative risks for the non-employed have significantly increased. Blakely et al. (2003) found high suicide rates among unemployed New Zealanders, even after controlling for other socio-economic factors. Since unemployment is higher among the lower educated, trends in educational mortality differentials may be affected by trends in unemployment. The Austrian unemployment rate increased by trend in the 1980s and 1990s, but the number was much smaller than in other European countries,
e.g. Germany (Table 9). Particularly the long-term (≥ 12 months) unemployment rate is
only about a quarter of the EU-15. We conclude that an increase in educational mortality differentials by increasing unemployment could have hit Austria less hard than other countries.
Table 8: Austrian 2001 census population aged 25-64 years by country of birth
Population by country of birth in % Educational level Population total
Austria Former Yugoslavia
or Turkey Other
Males
Total 2236155 84.9 7.6 7.4
Primary education 430576 66.6 22.9 10.5
Further education 1805579 89.3 4.0 6.7
Females
Total 2244876 84.9 6.8 8.3
Primary education 742573 77.6 14.9 7.5
Further education 1502303 88.5 2.8 8.7
Table 9: Average unemployment rates in 1996-2000
Unemployment Long-term unemployment Males Females Males Females
EU-15 8.1 10.4 3.6 5.0
Austria 3.5 5.0 0.9 1.5
Germany 8.3 8.9 4.0 4.7
Source: Eurostat: LFS main indicators (ec.europa.eu/eurostat/).
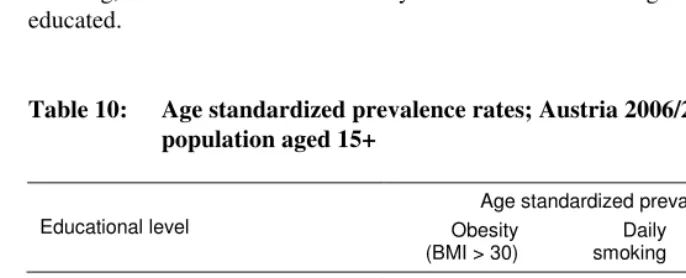
Behavioral risk factors such as excessive alcohol consumption, obesity, leisure time inactivity and especially smoking are mentioned as major causes for socio-economic mortality differentials: Based on a prospective cohort study of Dutch aged 15-74 years at baseline, van Oort et al. (2004) report that the excess mortality of the lowest compared with the highest educational group decreases by 30% when adjusted for smoking and physical inactivity. Education specific trends in smoking are also frequently suggested as a major cause for widening socio-economic mortality differentials in developed countries (Huisman 2004). Also for Austria an educational gradient of these risk factors was reported (Table 10): The prevalence of obesity, daily smoking, and leisure time inactivity in 2006/2007 was highest among the lowest educated.
Table 10: Age standardized prevalence rates; Austria 2006/2007, population aged 15+
Age standardized prevalence rate Educational level Obesity
(BMI > 30)
Daily smoking
Physical inactivity (< 3 times/week)
Males
Primary 13.3 35.3 74.0
Apprenticeship or lower secondary 13.1 33.0 67.0 Higher secondary or tertiary 7.7 17.0 65.8
Females
Primary 18.6 26.9 79.9
Apprenticeship or lower secondary 10.7 24.2 75.7 Higher secondary or tertiary 7.1 16.6 69.7
Unfortunately comparable time series concerning the prevalence of these risk factors are not available for Austria. However, educational trends in smoking behavior have been studied for Germany and Switzerland, two countries somewhat comparable. For Germany in the 1980s and 1990s educational differentials in smoking were stable for men and increased for women (Schulze and Mons 2006; Giskes et al. 2005). For Switzerland an increase was reported for men too (Kuntsche and Gmel 2005). If we assume that trends in Austria are similar, then we would expect a widening of the educational mortality gap, at least for women. Our data do not support this assumption. However, smoking-related deaths often occur with a considerable time-lag, so an increase in the educational gradient in smoking may influence the educational gradient of mortality in forthcoming decades.
5. Acknowledgements
References
Avendano, M., Kunst, A.E., van Lenthe, F., Bopp, M., Borrell, C., Valkonen, T. Regidor, E., Costa, G., Donkin, A., Bongan, J.K., Debooser, P., Gadeyne, S., Spadea, T., Andersen, O. and Mackenbach, J.P. (2004). Educational level and stroke mortality: A comparison of 10 European populations during the 1990s.
Stroke 35(2): 432-437.
Avendano, M., Kunst, A.E., Huisman, M., Lenthe, F.V., Boop, M., Regidor, E., Glickman, M., Costa, G., Spadea, T., Deboosere, P., Borrell, C., Valkonen, T., Gisser, R., Borgan, J.-K., Gadeyne, S. and Mackenbach, J.P. (2006). Socioeconomic status and ischaemic heart disease mortality in 10 western
European populations during the 1990s. Heart 92(4): 461-467.
Bauer, A. (2005). Volkszählung 2001: Bildungsstand der Bevölkerung. Wien: Verlag Österreich.
Blakely, T., Collings, S.C.D. and Atkinson, J. (2003). Unemployment and suicide:
Evidence for a causal association? Journal of Epidemiology and Community
Health 57(8): 594-600.
Blakely, T., Kawachi, I., Atkinson, J. and Fawcett, J. (2004). Income and mortality: The shape of the association and confounding New Zealand Census-Mortality Study,
1981-1999. International Journal of Epidemiology 33(4): 874-883.
Borrell, C., Azlor, E., Rodriguez-Sanz, M., Puigpinos, R., Cano-Serral, G., Pasarin, M.I., Martinez, J.M., Benach, J. and Muntaner, C. (2008). Trends in socioeconomic mortality inequalities in a southern European urban setting at the
turn of the 21st century. Journal of Epidemiology and Community Health 62(3):
258-266.
Boyle, P., Exeter, D. and Flowerdew, R. (2004). The role of population change in
widening the mortality gap in Scotland. Area 36(2): 164-173.
Brønnum-Hansen, H. and Baadsgaard, M. (2008). Increase in social inequality in health
expectancy in Denmark. Scandinavian Journal of Public Health 36(1), 44-51.
Cesaroni, G., Agabiti, N., Forastiere, F., Ancona, C. and Perucci, C.A. (2006). Socioeconomic differentials in premature mortality in Rome: changes from 1990
to 2001. BMC Public Health 6: 270.
Davey Smith, G., Dorling, D., Mitchell, R. and Shaw, M. (2002). Health inequalities in
Britain: Continuing increases up to the end of the 20th century. Journal of
Epidemiology and Community Health 56(6): 434-435.
Doblhammer, G. (1996). Soziale Ungleichheit vor dem Tod: Zum Ausmaß sozioökonomischer Unterschiede der Sterblichkeit in Österreich. In: Institut für Demographie der Österreichischen Akademie der Wissenschaften (ed.).
Demographische Informationen 1995/96. Wien: Verlag der Österreichischen Akademie der Wissenschaften: 71-81.
Doblhammer, G., Rau, R. and Kytir, J. (2005). Trends in educational and occupational differentials in all-cause mortality in Austria between 1981/82 and 1991/92.
Wiener Klinische Wochenschrift 117(13-14): 468-479.
Fawcett, J., Blakely, T. and Kunst, A.E. (2005). Are mortality differentials and trends by education any better or worse in New Zealand? A comparison study with
Norway, Denmark and Finland, 1980-1990s. European Journal of Epidemiology
20(8): 683-691.
Fuchs M., Schmid, G. and Oberzaucher, N. (2003). Quantitative und qualitative
Erfassung und Analyse der nicht-krankenversicherten Personen in Österreich: Endbericht. Wien: Bundesministerium für Gesundheit und Frauen.
Giskes, K., Kunst, A.E., Benack, J., Borrell, C., Costa, G., Dahl, E., Dalstra, J.A.A., Federico, B., Helmert, U., Judge, K., Lahelma, E., Moussa, K., Ostergren, P.O., Platt, S., Prattala, R., Rasmussen, N.K. and Mackenbach, J.P. (2005). Trends in smoking behavior between 1985 and 2000 in nine European countries by
education. Journal of Epidemiology and Community Health 59(5): 395-401.
Huisman, M. (2004). Socioeconomic inequalities in health in Europe: Studies of
middle-aged and older populations with a special focus on the role of smoking
(Rotterdam, Univ., PhD thesis, 2004). [Enschede]: [Ipskamp].
Huisman, M., Kunst, A.E., Boop, M., Borgan, J.K., Borrell, C., Costa, G., Deboosere, P., Gadeyne, S., Glickman, M., Marinacci, C., Minder, C., Regidor, E., Valkonen, T. and Mackenbach, J.P. (2005). Educational inequalities in cause-specific mortality in middle-aged and older men and women in eight western
European populations. The Lancet 365(9458): 493-500.
Józan, P. and Forster, D. (1999). Social inequalities and health: ecological study of
mortality in Budapest, 1980-3 and 1990-3. BMJ 318(7188): 914-915.
Klimont, J., Kytir, J., Ihle, P. and Baldaszti, E. (2008). Sozio-demographische und sozio-ökonomische Determinanten von Gesundheit: Auswertungen der Daten aus der Österreichischen Gesundheitsbefragung 2006/2007. Wien: Statistik Austria.
Klotz, J. (2007). Soziale Unterschiede in der Sterblichkeit: Bildungsspezifische
Sterbetafeln 2001/2002. Statistische Nachrichten 62(4): 296-311.
Kunst, A.E. (1997). Cross-national comparisons of socio-economic differences in
mortality (Rotterdam, Univ., PhD thesis, 1997). [Rotterdam]: [Erasmus University].
Kunst, A.E. and Mackenbach, J.P. (1994). Measuring socioeconomic inequalities in
health. Copenhagen: WHO Regional Office for Europe.
Kuntsche, S. and Gmel, G. (2005). The smoking epidemic in Switzerland: An empirical
examination of the theory of diffusion of innovations. Sozial- und
Praeventivmedizin 50(6): 344-354.
Leclerc, A., Chastang, J.-F., Menvielle, G. and Luce, D. (2006). Socioeconomic inequalities in premature mortality in France: Have they widened in recent
decades? Social Science & Medicine 62(8): 2035-2045.
Leinsalu, M., Vâgerö, D. and Kunst, A.E. (2003). Estonia 1989-2000: Enormous
increase in mortality differences by education. International Journal of
Epidemiology 32(6): 1081-1087.
Mackenbach, J.P., Bos, V., Andersen, O., Cardano, M., Costa, G., Harding, S., Reid, A., Hemström, Ö., Valkonen, T. and Kunst, A.E. (2003). Widening socioeconomic inequalities in mortality in six Western European countries.
International Journal of Epidemiology 32(5): 830-837.
Martikainen. P., Valkonen, T. and Martelin, T. (2001). Change in male and female life expectancy by social class: Decomposition by age and cause of death in Finland
1971-95. Journal of Epidemiology and Community Health 55(7): 494-499.
Pamuk, E. (1985). Social class inequality in mortality from 1921 to 1972 in England
and Wales. Population Studies 39(1): 17-31.
Rau, R., Doblhammer, G., Canudas-Romo, V. and Zhang, Z. (2007). Cause-of-death contributions to educational inequalities in mortality in Austria between 1981/82
and 1991/92. European Journal of Population 24(3): 265-286. DOI
Razum, O., Zeeb, H. and Rohrmann, S. (2000). The ‘healthy migrant effect’ – not
merely a fallacy of inaccurate denominator figures. International Journal of
Epidemiology 29(1): 191-192.
Schulze, A. and Mons, U. (2006). The evolution of educational inequalities in smoking: A changing relationship and a cross-over effect among German birth cohorts of
1921-70. Addiction 101(7): 1051-1056.
Schwarz, F. (2006). Educational mortality differentials in Austria. [PhD thesis]. Wien:
Universität Wien / Fakultät für Wirtschaftswissenschaften / Institut für Statistik und Decision Support Systems.
Vallin, J., Meslé, F. and Valkonen, T. (2001). Trends in mortality and differential mortality. Strasbourg: Council of Europe Publishing. (Population studies; 36).
Van Oort, F., Van Lenthe, F.J. and Mackenbach, J.P. (2004). Cooccurrence of lifestyle risk factors and the explanation of education inequalities in mortality: Results
from the GLOBE study. Preventive Medicine 39(6): 1126-1134.
Wolf, W. and Kronsteiner, C. (1995). Ausstattung der Haushalte: Zeitvergleich nach
sozialer Stellung, Gemeindetyp und Bundesländern. Statistische Nachrichten
50(1): 22-32.