Patron: Her Majesty The Queen Rothamsted Research Harpenden, Herts, AL5 2JQ Telephone: +44 (0)1582 763133 Web: http://www.rothamsted.ac.uk/
Rothamsted Research is a Company Limited by Guarantee Registered Office: as above. Registered in England No. 2393175. Registered Charity No. 802038. VAT No. 197 4201 51. Founded in 1843 by John Bennet Lawes.
Rothamsted Repository Download
A - Papers appearing in refereed journals
Boyd, D. A. 1939. The estimation of Rothamsted temperature from the
temperature of Oxford and Greenwich. Annals of Eugenics. 9 (4), pp.
341-352.
The publisher's version can be accessed at:
•
https://dx.doi.org/10.1111/j.1469-1809.1939.tb02218.x
The output can be accessed at:
https://repository.rothamsted.ac.uk/item/95yw2/the-estimation-of-rothamsted-temperature-from-the-temperature-of-oxford-and-greenwich
.
© Please contact library@rothamsted.ac.uk for copyright queries.
The Annals of Human Genetics has an archive of material originally published in print format
by the Annals of Eugenics (1925-1954). This material is available in specialised libraries and
archives. We believe there is a clear academic interest in making this historical material more
widely available to a scholarly audience online.
These articles have been made available online, by the Annals of Human Genetics, UCL and
Blackwell Publishing Ltd strictly for historical and academic reasons. The work of
eugenicists was often pervaded by prejudice against racial, ethnic and disabled groups.
Publication of this material online is for scholarly research purposes is not an
endorsement or
promotion of the views expressed in any of these articles or
eugenics in general. All articles
are published in full, except where necessary to protect individual privacy.
T H E E S T I M A T I O N O F ROTHAMSTED T E M P E R A T U R E
F R O M T H E T E M P E R A T U R E O F O X F O R D
AND G R E E N W I C H
BY D. A. BOYD
(Rothamsted Experimental Station)
1. INTRODUCTION
T H I S paper describes the results of an investigation recently carried out a t Rothamsted Experimental Station.
The effects of rainfall and sunshine on crop yield have already been the subject of a number of studies. As yet, however, no analysis has been made of crop variation due to temperature fluctuations, except in so far as these are associated with rainfall effects. It is now proposed to undertake an analysis of the effects of temperature also.
Temperature was not recorded a t Rothamsted until 1878. Hence it was desired to extend this record back to cover earlier years for which crop yields of the classical experiments are available. As the classical fields were not all under uniform treatment until 1852, and the rainfall record at Rothamsted was not begun until that year, it was considered sufficient to go back as far as 1852.
2. METHOD EMPLOYED
Although the temperature may fluctuate widely from day to day and from week to week, it is reasonable t o expect that the effect, on the ultimate crop yield, of fluctuations of the same magnitude will change relatively slowly in the course of the whole season. If this is the case, the only components of the fluctuations which need be taken into account are those representable by a smooth curve fitted to the yearly sequence of temperatures, e.g. a fifth degree polynomial. It is not, therefore, necessary to obtain estimates of the daily temperatures a t Rothamsted for the period 1852- 78 ; instead, it will be sufficient to estimate yearly values of the mean and of the coefficients of the first five terms of the
polynomial regression.
If we wish to fit a polynomial regression line
Y = a+bx+cz2+
...
+fx5Y = A
+
Btl+
C t 2+
. . .
+
J’$,to a series of observations a t equal intervals of 2, we may fit instead the equivalent line
(n’ = 52, and
c‘
=A t ,
h being the smallest multiple which gives integral values t o5’).
For convenience we shall style these quantities Qo andQ1,
Q2,. . .
, Q5. The actual regressioncoefficients may be obtained by dividing by the sums of squares of the appropriate El’s.
The values of A and ,Z(t;’2) are given in the Appendix. Numerical values for all
6’
from6;
to6;
are given in Statistical Tables (Fisher & Yates, 1938).Only two long temperature records, those a t Oxford and Greenwich, were available from as early as 1852. The major part of the investigation, therefore, consisted in the evaluation and analysis of the quantities Qo,
Q1,
.
. .
,
Q5 a t Rothamsted, Oxford and Greenwich for aperiod in which the three stations were concurrent. For this purpose, the weekly mean temperatures of each station were extracted from the Weekby Weather Report for the period 1878-9 to 1907-8. The crop year, from the first week of September to the last week of August, was used, the values of a fifty-third week being discarded when necessary. The quantities Q were then evaluated for each year, giving thirty annual values of each. These are tabulated in the Appendix.
The means, variances and covariances of each set were calculated for the three stations. Then the linear regression of the quantities Q for Rothamsted on the corresponding set for Oxford and Greenwich was obtained, taking the latter stations individually and simultaneously.
3. NOTES ON STATIONS USED
I n Table I are shown the distances and bearings between Rothamsted, Oxford and Greenwich. Their local situations are rather dissimilar, and require brief comment.
Pair of stations
Rothamsted-Greenwich Rothamsted-Oxford Oxford-Greenwich
-
Table I. Interstation distances and bearings
Distance in miles
28
38
55
Bearing from N.
1461
265
I roo
Radcliffe Observatory, Oxford, is on the low-lying ground between the Isis and the Cherwell at a height of 202 ft.
Greenwich Observatory lies about
8
mile south of the Thames, but is a t a height of 150 ft., the ground sloping steeply to the river on the north, and rather less steeply towards London on the west. Although now encircled by suburbs, it lay on the eastern outskirts of the city during the period with which we are concerned.Rothamsted’s readings are taken on one of the flat-topped interfluves of the eastern Chilterns at an altitude of 424 ft.
D. A. B O Y D 343
4. RESULTS OF THE INVESTIGATION
A. The means of the Q's
The means and their standard deviations based on differences between years are given in Table 11." Differences between Q1
...
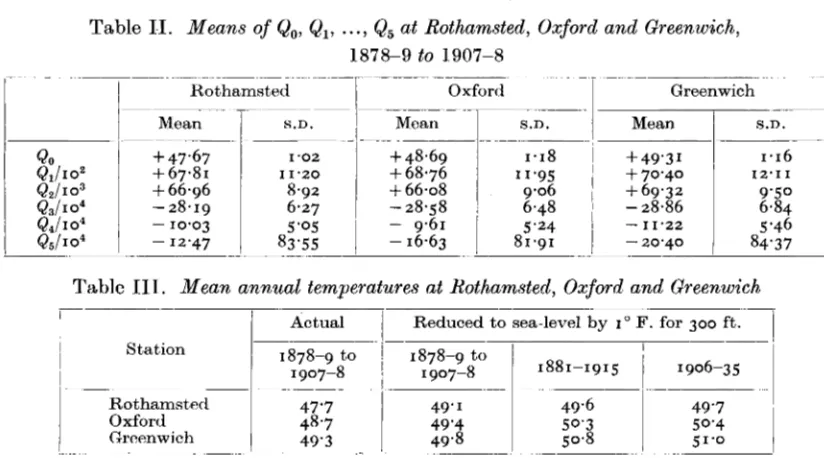
Q5 are not significant, and large differencesbetween the values for Qo are mainly the effect of altitude. Table I11 shows the mean
Table 11. Means of Qo,
Q1,
...,
Q5 at Rothamsted, Oxford and Greenwich, 1878-9 to 1907-8Rothamsted
I
Oxford~~ Mean
+
47.67+
67.81+
66.96 -28.19- 10.03
- 12'47
S . D .
~- ~~
1'02
1 1 ' 2 0
8.92 6.27
5 '05
83.55
S . D .
Greenwich
Mean
1
S.D.+
49'3 1+
69.32- 28.86
-
20.40+
70'40- 1 1 . 2 2
1.16 9'50 6.84
12.1 I
5.46 84.37
Table 111. Mean annual temperatures at Rothamsted, Oxford and Greenwich
I
1
Actual
1
Reduced to sea-level by I' F. for 300 ft.1
I II
!-
1878-9 to ! 1878-9 to
1907-8 j 1907-8 I 881-191 5
Station
~ ~ ~ _ ~~~ ~ _
Rothamsteti 47'7 49' I 49.6 49'7
Oxford ~ 48.7
1
49'4 ~ 50.3 ~ 50.4I
I-
Greenwich 49'3 4 9 4 50.8 5 1 ' 0temperatures as observed, and when reduced to sea-level by the correction of 1' F . for 300 ft. Differences between the values of Qo are still significant after the correction has been applied. The means published by the Meteorological Office (1919, 1936) have been added for comparison. Owing to the inclusion in the present data of a number of unusually cold years at the beginning of the period, the means for 1878-9 t o 1907-8 are lower than for either of the later periods, the difference being rather less at Rothamsted than a t Oxford or Greenwich.
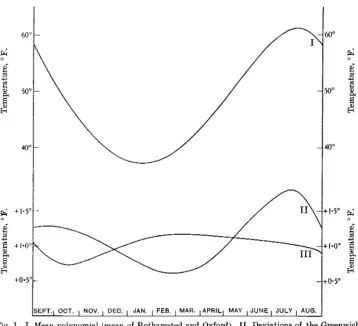
From the mean values of the Q's the mean polynomial for seasonal variation at each station can be constructed. Inspection showed that the polynomial for Oxford and Rothamsted were very similar, while Greenwich differed considerably from the other two. Fig. 1 has therefore been drawn to show the mean for Oxford and Rothamsted. It is of interest to note that, during the period under review, the lowest mean temperature occurred a t the end of the third week of January (37.3" F.) and the highest mean in the last week of July (61.2' F.). Beneath this mean polynomial are shown the deviations from it of the Greenwich polynomial and the difference between the Oxford and Rothamsted
*
The fluctuating date of commencement of the crop-years will contribute a little to the variance from year to year of Q1...
Q5. However, the departure from the mean date, 1 September, cannot exceed 3 days, sopolynomials. It is clear that the seasonal range of mean temperature was greater at Greenwich than a t Oxford and Rothamsted. Thus in February and March Greenwich temperature exceeded the mean of the other two stations by 0.6OF., whereas in July Greenwich was the warmer by as much as 1-6" F. It might therefoye be assumed that
EPT.1 OCT. I NOV. 1 DEC. I JAN. 1 FEB. I MAR. 1 APRIL, MAY I JUNE I JULY I AUG.
Fig. 1. I. Mean polynomial (mean of Rothamsted and Oxford). 11. Deviations of the Greenwich polynomial from this mean. 111. Oxford minus Rothamsted.
Greenwich had a slightly more extreme climate than Oxford or Rothamsted. However, part of this difference may well be the result of using a Glaisher stand instead of a Stevenson screen.
W.
Ellis (1891) gave results of a comparison of thermometer readings taken on a Glaisher stand with corresponding observations in a Stevenson screen for three years, 1887-9 (Table IV). These values indicate that a part (though not all) of the differenceTable IV. The effect of the method of exposure on mean monthly temperature (Gladsher
stand minus Stevenson screen) at Greenwich 1887-9 (" F.). See Ellis (1891)
J a n . Feb. Mar. Apr
.
May J u n e+
0 . 0 2 O+
0.06"+
0 . 2 5 O+
0.63"+
0.70"+
0.80"D. A. B O Y D 345
may be purely an effect of the unorthodox exposure. This is borne out by values for other London stations in T h e Book of Normals (M.O. 1917) for 1881-1915; the greatest extremes between the means for January and July occurred a t Camden Square and Greenwich, the only stations using the Glaisher stand.
B. Slow changes
To determine whether slow changes have occurred in the mean temperature or in its distribution over the year during the period under review, a linear regression was fitted t o each set of values Q,,, Q1,
...,
Q5. The regression coefficients obtained are shown in Table V.Table V. Linear regressions on time of Qo, Q1,
. . .
, Q4Rothamsted Oxford
QO
+
0.0209 f 0.0108+
0.0235 f 0.0124Q1 - 1'4909 f 1.1807 - 0.8673 f 1.2603
QZ
-
0.6862 f 0.9409-
0.4618 f 0.9550Q4
+
0.4808 f 0'5523Q, - 1'0395 f 0.6615 - 09933 k 0.6829
+
0.4666 f 0.53 I IGreenwich
+
0.0287 f 0.0123 -0.5018f 1.2776- 0.8085 k 1.0024
+
0'3990 f 0.5763~ _ _ _ _
-0.9198f0.7219
I n the case of Q,, they are about twice the standard deviation; we may say, therefore, that a real increase of mean annual temperature was taking place, amounting to approxi- mately 0.05"F. per year, during the period 1878-9 t o 1907-8. No significant changes have occurred in the distribution values Q1
. . .
Q 6 . It is of interest to note that the largest of these va,lues are for Q 3 , since Fisher (1924) and Wishart (1930) noted a significant change in the corresponding regression coefficient for Rothamsted rainfall over a much longer period of years.Differences between the regression coefficients a t the three stations are generally small. The standard errors of the differences were computed for Q1,
Q2
and Q3, and showed thatthese differences were not significant.
C . Analysis of total variawce of weekly mean temperature
The variance of weekly mean temperature a t each station is analysed in Table VI. The first four terms of the polynomial are highly significant, but the fifth does not significantly
Table VI. Analysis of variance of weekly mean temperature (1878-9 to 1907-8)
Q3 Q4 QS
Residual
Variance due to
1
D.F.I I I 46
Mean square :
Residual Total
Rothamsted
I ,801.02
8,861.61
Oxford
100,921~96
507314'49 8,527.1 8 104.96 200,677.3 I
_ _
207,109'2 I
4>362.55 I I,I 18.14
~
Greenwich
105,773'31 227.916.86
5 1,293'35 I 1,624.86
exceed the residual variance. The proportion of the total variance removed by the poly- nomial fitting is
Rothamsted 79.7
yo
Oxford 60.8
yo
Greenwich 64.5
yo
The variance accounted for by the polynomial fitting is very similar for all three stations, but there was a markedly smaller residual variance a t Rothamsted. Even assuming independence such a difference would occur only once in five trials. Since temperature variations for neighbouring stations are far from independent, there is clearly a real difference of surprising magnitude.
An explanation is doubtless to be found in the dissimilar local situations of the stations, which have been referred to above. Broadly speaking, both Oxford and Greenwich may be said to have a valley situation, whereas Rothamsted lies well up on the dip-slope of the Chiltern plateau. It may well be, therefore, that the contrast is due to the well-known tendency for greater extremes to occur in valleys than on gradually sloping plateaus in anticyclonic weather. Inspection of the actual weekly records for two recent years gave some confirmation of this reasoning.
We cannot, however, exclude the possibility that the effect may be due, in part a t least, to the proximity of the Oxford and Greenwich thermometers to the Observatory walls, in contrast with the open situation of the Rothamsted screen.
D. The variance of Qo,
Q1,
...,
Q5Not only is the variance of the weekly means within each year notably smaller a t Rothamsted, but the year to year va,riance of the mean and distribution va$lues is also less. Differences are considerable between the values
Q1
...
Q5 for Rothamsted and Greenwich, but are less important between Rothamsted and Oxford. Greenwich has a somewhat higher annual variance than the other stations in each case. The variance of Qo a t Rotham- sted is markedly less than Qo at Oxford or Greenwich; the variance ratio would giveP = 0.2, even if the deviations from the station means were uncorrelated. Only a small part of this difference can be due to differences in rate of the slow changes noted under
(B) above.
E. The prediction of the Rothamsted values Qo,
Q1,
.
..,
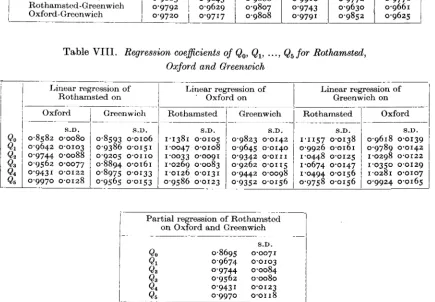
Q5 from those of Oxford and GreenwichThe correlation coefficients between the t,hree stations are shown in Table VIT. They are, of course, extremely high; correlations between Rothamsted and Oxford are, on the whole, rather higher than between these stations and Greenwich.
D. A. B O Y D
0.9720 I 0.9717
347
QZ Q3 Q4
0.9807 0.9743 0.9630 0.9661
0.9888 0.9910 0.9772
~~
0.9808 0.9791 0.9852 0.9625
Table VII. Correlation coeflicients between Qo, Q1,
...,
Q5 at Rothamsted,Oxford and Greenwich
S . D .
~
1.1157 0.0138 0.9926 0.0161 1.0448 0.0125 1.0674 0.0147 1.0494 0.0156 0.9758 0.0156 __--
I
Pairs of stationsS.D. 0.9618 0.0139 0.9789 0.0142 1.0298 0.0122 1.0350 0.0129 1.0281 0.0107 0.9924 0.0165
1
Rothamsted-OxfordRothamsted-Greenwich I Oxford-Greenwich
-
Table VIII. Regression coeflicients of Qo,
Q1,
. . .
,
Q5
for Rothamsted, Oxford and Greenwich1
Linear regression of1
Linear regression of Linear regression of Rothamsted on ' Oxford on Greenwich onI
i
Oxford1
Greenwich Rothamsted1
Greenwich 1 Rothamsted OxfordI
I
1
0.8582 o:%~o0.9642 0.0103
0'9744 0.0088
0.9562 0'0077 0.943 I O'OI 22 0'9970 0.0128
-
S . D .
0.8593 0.0106 0.9386 o.0151 0.9205 0.0110
0.8894 0.0161 0.8975 0'0133
0.9565 0.0153
S.D.
1.1381 0.0105
1.0033 0*0091 I a0269 0.0083 1.0126 0.0131 0.9586 0.0123
1'0047 0.0108
S.D.
0.9823 0.0142 0.9645 0.0140
0.9262 0.01 I 5 0.9342 O ' O I I I
0.9442 0.0098 0.9352 0.0156
Partial regression of Rothamsted on Oxford and Greenwich
~~ ~-
S . D .
Qo 0.8695 0.0071
Q1 0.9674 0 ~ 0 1 0 3
QS 0.9562 0.0080
Q4 0.9431 0.0123
QS 0,9970 0.01 18
QZ 0'9744 0.0084
It, will be noticed that most of the regression coefficients of Rothamsted on Oxford, and all for Rothamsted on Greenwich, are significantly less than unity. If there is complete association between two variates having similar means and variances, the linear regression of one on the other will be unity. Such a result may therefore imply that the variance of Rothamsted is smaller, or merely that there is incomplete association between the two stations. The reality of the difference in variance may be tested by reversing the role of
the dependent and independent variates. This procedure gives the regression coefficients shown in the last four columns of Table VIII.
The linear regressions of Oxford on Rothamsted are rather greater than unity for Qo t o Q 4 , but only significantly so in the case of Qo. For the corresponding regression of Greenwich on Rothamsted, Qo, Q2, Q3 and
Q4
give a coefficient significantly greater than unity. (It has2 3
already been shown that
Q5
does not contribute a significant amount to the total variance of weekly mean temperature, and we may therefore disregard its ot'herwise anomalous values. )It is of interest to consider also the linear regression for Oxford on Greenwich and for Greenwich on Oxford. For Qo and
Q1
the differences between the two stations are small and clearly due t o random variation, but for Qz, Q3 and Q4 the regression of Oxford on Greenwich is significantly less than unity and the corresponding regressions of Greenwich on Oxford significantly greater, evidently the result of a genuinely greater variance atGreenwich.
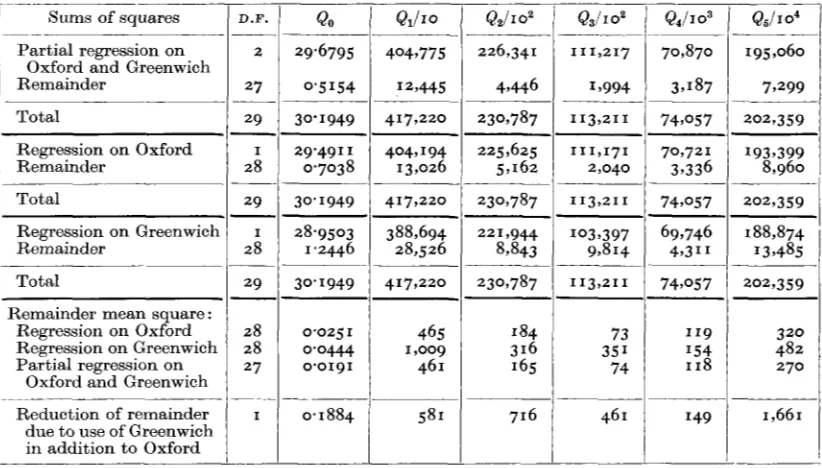
Table I X . Analysis of variance of Qo, Q1,
.
.
.,
Q5 for Rothumsted, showing the contributionof the regression on
Oxford
and Greenwich__
D . F .
-- Q5/104
-~
Q4i I o3
70,870
3,187
749057
39336 70,721 Sums of squares QO Qzi I 0'
Partial regression on
Remainder
Oxford and Greenwich
2
27
4049775
12,445
226,341
4,446
111,217
19994
195,060
79299
Total 29
28
-
I
230,787 202 93 5 9 30'1949
29'491 1
0.7038
417,220
4049 I94
I 3,026
I 13,21 I
111,171 2,040
I 1321 I
Regression on Oxford Remainder
Total
-
1939399 8,960
202,359
29 30'1949 749057
Regression on Greenwich Remainder
I 28
29
28 28 27
~
-
I
__
28.9503
I .2446
388,694 28,526
Total 30.1949 230,787 113,211 749057 202,359
~~~ -
Remainder mean square : Regression on Oxford Regression on Greenwich Partial regression on
Oxford and Greenwich
Reduction of remainder due t o use of Greenwich in addition to Oxford
0.025 I
0.0444 0*0191
0.1884
-~
73 351 74
46 1
It appears, therefore, that the climate of Rothamsted was distinctly less variable and more equable than the climate of Oxford and Greenwich, not only for individual weeks, but also between the same seasons of different years, and for whole years. The climate of Oxford seems to have differed from that of Greenwich in that the seasonal distribution from one year t o another was less variable.
D. A. B O Y D 349
It is clear that variations of each set of values Qo
...
Q5
are reproduced better by Oxford than by Greenwich, significantly so from Qo to Q 3 . The fit is, on the whole, even betterif account is taken of both Oxford and Greenwich simultaneously, the further reduction in the residual variance being significant for Qo, Q, and
Q5.
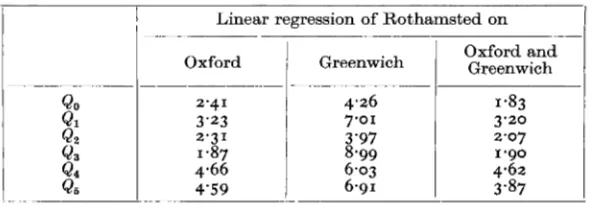
The percentage variance not accounted for by the linear regressions is very small (Table X). It is clear that, while the Oxford record predicts the Rothamsted values more satisfactorily than does Greenwich, the further reduction in variance obtained by using both simultaneously gives only slightly better results. Hence the computation of the
Table X. Percentage of variance not accounted for by the regressions of Rothamsted on Oxford and Greenwich
QO
Q1
QZ
Q3 Q4 QS
Linear regression of Rothamsted on
I
Oxford Greenwich Oxford and Greenwich
2.4 I
3'23
2.31
I .87
4.66 4'59
4.26 7.01 3'97 8.99 6.03 6.91
I
I '83
3.20 2.07
I '90 4.62 3.87
quantities Qo,
Q1,
...,
Q5
for Oxford only, for each year of the period 1852-78, will be sufficient for an estimation of the corresponding values for Rothamsted.It is clear that for an element not subject to violent local fluctuations, such as weekly mean temperature, highly satisfactory prediction at any station in lowland England of the mean and the distribution values up to the fifth degree, may be possible from the long records of a neighbouring station. The distance between Rothamsted and Oxford is considerable, and the contrast between their situations is almost as great as will be met with in England south of the Pennines and east of the Welsh Border. It is quite likely, therefore, that satisfactory estimation over distances of more than a hundred miles is possible if it is only required to estimate slowly changing quantities such as the values Q used in this paper.
SUMMARY
It is proposed shortly to analyse the effect of temperature on the Rothamsted crop- yields. For this purpose we require the mean Qo and quantities
Q1,
. .
.
,
Q5
proportional to the regression coefficients of a fifth degree polynomial fitted to the weekly mean tem- perature of each crop year. Rothamsted's temperature record did not commence until 1878, whereas yields for most of the classical experiments are available from 1852. Therequired values for the period 1852-3 to 1877-8 must be estimated from the longer records of Oxford and Greenwich. As a first step, the quantities
Q
were evaluated for a period of years (1878-9 t o 1907-8) during which the three stations were concurrent, and the means, variances and covariances of each set of Q's were calculated.Greenwich appears to have had a slightly more extreme climate than Oxford or Rotham- sted, but this may have been due in part to the unorthodox exposure of the thermometers there. A significant increase in mean temperature over the period was noted, amounting to about 0.05" F. a year. Changes in the seasonal distribution of temperature were not significant. The variance of Rothamsted temperature was significantly smaller than that of Oxford or Greenwich, both from week to week, and from year to year. This noteworthy difference was doubtless due to the more upland situation of Rothamsted.
The linear regressions of the Q's for Rothamsted on the corresponding values for Oxford and Greenwich were evaluated, taking the two stations individually and simultaneously. Oxford gave a better fit than Greenwich in every case, and the partial regression on the two stations was little better than the regression on Oxford alone. The fit was very good for the regression of Rothamsted or Oxford, the residual variance in no case exceeding 5
%.
We may therefore obtain an extremely satisfactory prediction of the mean annual tem- perature (the standard error being reducible to ? 0.14" F.) and of the regression coefficients up to the 5th degree for Rothamsted from those of Oxford only. At the same time differ- ences of surprising magnitude have been revealed in the variability of weekly and annual temperature a t Rothamsted as compared with Oxford and Greenwich.Q1
_ _ ~
2
46,852
I n conclusion, the author wishes to acknowledge the help he has received from Dr Yates, Head of the Statistical Department, Rothamsted Experimental Station. He is also indebted t o Dr Glasspoole and to the Librarian of the Meteorological Office, who facilitated the abstraction of the temperature data used in this paper. The data was taken mainly from
the Weekly Weather Report of the Meteorological Office, but the earlier years of the
Greenwich record were abstracted from the Registrar-General's Reports.
QZ Q S Q4 Q,
1 1
I ~~
8
2 &2,108,340 162,342,180 108,228,120 26,358::66,680
APPENDIX
Tibe values Qo, Q1,
...,
Q, for Rothamsted, Oxford and Greenwich (1878-9 to 1907-8).Year
I 878-9
1879-80 1880-1 1881-2 1882-3 1885-6 1886-7 1887-8 1888-9 1889-90 1890-1 1891-2 1892-3 1893-4 1894-5
I 896-7
1897-8 1898-9 1899-1900 1883-4
I 884-5
I 895-6
I 900-1
1901-2
1903-4 1904-5
I 905-6
I 907-8
Total 1902-3
1 9 0 6 7
Year
1878-9 1879-80
1880-1
1881-2
I 882-3
1883-4
I 884-5
I 885-6
I 886-7 I 887-8
I 888-9
1890-1 1891-2 1889-90 1892-3 1893-4 1894-5 1895-6 1896-7 1897-8 1898-9 1899-1900 1900-1 1901-2 1903-4 1904-5 1905-6
I 906-7
Total 1902-3 1907-8 Rothamsted - 45'59 46.86 47'60 48.52 47'76 48.93
46. I 5
47.46 47'55
45'32 47'7 1
47'32 46.05 47.06 48.59 47.26 47.65 48.33 48.48 48.07 48.40 47'76 47.88 47'99 49'04 50.19 47'90 47'04 48.16 47'59 1430'21 QO Oxford
+
802727
+
784+
490+
604+
603+
655+
754+
863+
623+
609+
582+
792+
720+
583+
578+
747+
627+
603+
608+761 +761
+
737+
683+
539+
640+
579+
662+
690 +681+
20,08746.18 47'70
49'94 49'0 1
50.16 48.69 47'45 48.20 45.87 48'54 48.38 46.65 47'85 49'70 48.9 1
48. I7
48.7 1
5 1.46
49.67 48.19 48.47 50.24 49'44 49-00 49'24 49'22 49'09 48.81 49'05 1460.70 48.71 Rothamsted Greenwich 46-64 47'99 49'07 49'7 1
49-10
49'33
49'09 46.66 49' 12
49'02 47'37 48.98 50'5 1 49'7 I 49.18 51'12 49'49 50.22 5 1.92 50.63 47-88 49.65 50.18 48.73 49'79 49.80 50.00 49'3 I 49.06 49'97 1479'23 Oxford
+
805+
697+
745+
484+
570+
599+
652+
733+
875+
614+
590+
594+
807+
701+
568+
560+
733+
626+
589+
605+
752+
749+
730+
663+
533+
638+
582+
652+
679+
699+
19,824Greenwich
+
814+
746+
796+
494+
642+
645+
705+
760 +95I +653+
628+
604+
824+
735+
597+
593+
753+
664+
614+
640+
816+
752+
757+
685+
547+
679+
603+
686+
709+
704+
20,796Rothamsted
+
666+
885 +651+
704+
707+
660+
533+
762+
597+ 758
+ 749
+
642 -1-615+
612+
992+
630+
763+
614+- 877
t- 660
+
571+ 724 +619
+ 537
+
502+
706+
765+
822+ 438
+
582+
20,343Oxford
+
670+
858+
656+
666+
682+
678+ 546
+ 779
+ 592
+
769+
736+
642+
596+
625+
1040+
625+
781+
647+
883+
680+
610 +735 +631+ 584
+
512+ 703
+
814+
854+
442+
593+
20,629Greenwich
+616
+
853+
666+
672+ 694
+
733+
591+
788+
621+ 764
+
759+
632+
637 +651+
I 0 5 0+
648+
826+ 655
+ 947
+
701+ 576
+ 730
+
639+
555+
535+
762+ 790
+
889+
500 + 639 +21,119Rothamsted
- 364
- 344
- 380
- 241
- 229
- 172
- 305
- 281
- 305
- 276
- 286
- 264
- 381
-
- 328
- 365
- 289
- 284
- 350
- 362
- I 5 0
- I97
- 279 -213
- 257
- 209
- 290
- 295
- 187
- 302
- 272
-
8457Q3/103
Oxford
-
- 367
- 353
- 390 -251
- I75 -311
- 277
- 300
-
283- 278
- 278
- 396
- 310
- 372
- 294
- 297
- 363
- 367
- 141
- 292
- 228
- 270 -216
- 291
- 296
-
189- 305
2 271
- 8574
-211
- 202
Greenwich
- 335
- 354
- 371
- 256
- 204
- 171 -310
- 276
- 298
- 294
- 297
- 296 -412
- 347
- 389 -315
- 302
- 392
- 371 - I34
- 204
- 284
- 226
-
253- 289
- 299
- 190
- 303
- 275
-210
Year
I 878-9
I 879-80
1880-1 1881-2 1882-3
I 884-5
1886-7
I 887-8
1888-9 1890-1 1891-2 1892-3 1893-4 1894-5 1895-6 1 8 9 6 7
I 897-8
1898-9 1899-1900 1883-4
I 885-6
I 889-90
I 900-1
1901-2
1903-4 1904-5 1905-6 1906-7
I 907-8
Total 1902-3
Rothamsted
-
5’ + 4-
‘37-
48- 68
-
99- 128
- 1 5 1 - 169
-
89-
85-
106- 66
- 46
- I 1 0
- 1 1 1
- 221 - 94
-
43- 99
-
90- 141
-
201 - 84- 47
- ‘54 -117
- 29
- 76
-
I45-
3001&,I
I o3Oxford
- 57
+ 2
- I25
-
55-
84- 59
- 96
- 109
- ‘53
- 113
- 166
- 99
- 95
- 83
-
46- 36
-
233- 88
- 48
- I 0 0
- I22
- 91
- 205
- 71
- 51
-
I54-
114- 2 0
- 64
- ‘47
- 2882
Greenwich
- 60
- 15
-
I33-
75- 77 -114
- 142
- 172
-
128- 192
- 87
- 1 1 5 - 68
- 41
- 254
- 114
- 78
- 103
-
98- 152
-213
- 87
- 57
- I77
- I39
-
35- 60
- ‘57
- I 1 2
- I 1 0
- 3365
Rothamsted
+
55+
75- 96
- 27
- 97
- 86
+
49- I8
- 46
+
42- 80
+
I 0 1+
61+
77+218
-
66- 136
- 27
- I49
- 69
-
28+
I 0- 78
+
48+
85I 0 -
2
-
- 57
-
I43+
20- 374
Oxford
+
34- 65
+ I 1 0 I 1 -
-
I3- 114
+ 2
-
29+
43- 71
+ I 1 1
+
45+
74 - 6+
208-
68- 136
- 30
-
170- 89
- 39
+
I3- 85
+
29-
68-
123+
59- 5
- 499
- 83
- 22
Greenwich
+
54+
99- I43 + 5 - 6
-
88-
59 $ 3- 65
- 41
+ 8
- 68
+
90+
42+
I 0 1+
198- 91
- 140
- 18
- 176
- 88
-
31- I3
+
21- 59
- I45
+
57+
28-612
0
-
87REFERENCES
W. ELLIS (1891). “On the comparison of thermometrical observations made in a Stevenson screen with corre- sponding observations made on the revolving stand a t the Royal Observatory, Greenwich.” Quart. J.R.
R. A. FISHER (1924). “The influence of rainfall on the yield of wheat a t Rothamsted.” Philos. Trans. B, R. A. FISHER & F. YATES (1938). Statistical Tables, p. 60.
METEOROLOGICAL OFFICE (1919). The Book of Normals.
-
(1936). Averages of Temperature for periods ending 1935.5. WISHART (1930). “On the secular variation of rainfall a t Rothamsted.” Mem. R . Met. Soc. 3 , no. 27.
Met. SOC. 17, 240-7.