50 IPA
International Journal of Psychology Vol. 4, No. 2, Summer & Fall 2010
PP. 50-68 PP. 146-160
Iranian Psychological Association
Construction and Normalization of the Visual
Perception Test for the Preschool and Elementary
School Students in Tehran City
Rasool Kord Noghabi∗, PhD
Department of Psychology Bu-Ali Sina University
Maryam Ashkan, MA
Department of Psychometrics Allameh Tabatabaie University
Fariborz Dortaj, PhD
Department of Educational Psychology Allameh Tabatabaie University
Hassan Mahmoudian, MA
Department of Psychometrics Allame Tabatabaie University
This research is executed to find a valid instrument for diagnosis of visual perception deficiencies. Test of visual perception is composed of 7 subskills as follows: visual-motor integration, figure ground, visual discrimination, form constancy, visualization, spatial relations, and visual sequential memory. The research covered 1600 elementary school and pre school students: 800 boys: 400 preschool students and 400 first grade elementary school students. 800 girls: 400 preschool students and 400 first grade elementary school students. The selection of the sample followed a multistage sampling method. A developmental test of visual perception and the Goodenough test were administered individually. Goodenough test was used to determine the value of criterion validity. Descriptive statistics, Cronbach's alpha, Pearson correlation coefficient, and t–test were used to analyze the data. The results showed: 1-Norm Tables for the total scores were demonstrated and listed for gender and academic grade, separately. 2-The reliability coefficients of test were found to be .74. 3-The correlation coefficient between the created test and the criterion test for the total score and all subtests were significant. 4- The difference between the developmental visual perception in boys and girls was significant. 5- The difference between developmental visual perception in preschool and first grade elementary school students was significant.
Keywords: learning disability, visual perception test, psychometrics, preschool, elementary school students.
51
“Seeing and hearing have priorities over the other human senses, so we call them “major senses”. The major part of the things we learn in school, office, and social relations is accomplished by these senses. Nevertheless, our first information resource is received through the visual sense. The visual process covers more than 65% of all pathways to the brain. This process in comparison with other activities in the brain absorbs more brainpower, so it shows that visual is not a unique and separate event; rather it is a set of events that occur simultaneously. Vision is so complicated that involves in 20 visual abilities (McMains, 2002).
In fact, It is far more than just seeing objects clearly, but also involves in processes such as how we move our eyes together, how we focus on objects, how we perceive depth dimension, how we perceive the world around us, how we process, store and recall information, and so on. Therefore, vision is taken into consideration as a dynamic process not only as a sense.
Visual system is related to developmental experiences. Babies do not have a potent and well vision; rather they have the ability to develop and upgrow this system. Vision actually develops like walking and talking. Early visual skills make the base of the visual complexities in the future. Any deficiencies in the visual process can affect the outcome, especially if the visual system is under stress.
Perception means to know sense information or a mechanism that brain by means of it, practices recognition and conceptualization function away from sensory stimulation. It usually predicates individual’s cognition ability in the identification and conjugate of external stimuli.
Perception is a teachable skill; training process has a direct relation to student perception skills. For example, if training method is coordinated with student perceptional path, learning accomplishes better (Wepman, 1968).
52
of the means is called perceptional pathway. Many children with learning difficulties may have more preferences in one perceptional path than the others. Furthermore, one special perceptional path may be defection to some extent by which children cannot learn.
One of perceptional pathway is visual perception. As regards more instructional methods are congruous on this way, especially in elementary school, children use this way for their learning. The least deficiency in this way can make a disorder in quality of children learning. The basis in every instructional program should have awareness of methods that children prefer in learning. In fact, the development of an evaluation instrument with the intention of assessment of perceptional abilities and deficiencies is originated on this emphasis.
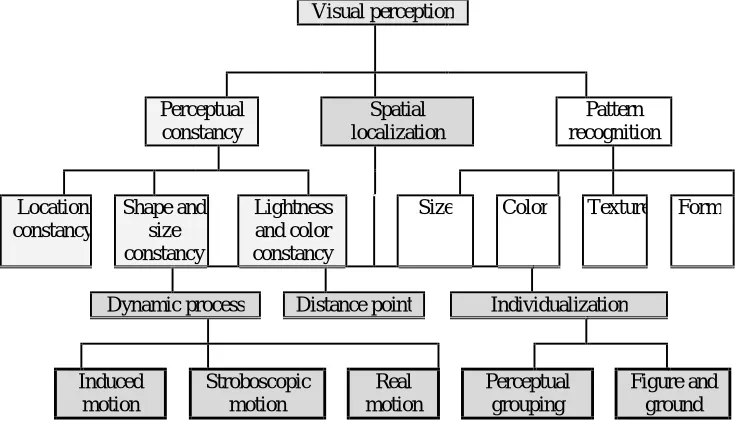
Visual perception primary components are: line, form/shape, color, value (light), space and texture. These components could go into a more typical division as: pattern recognition, spatial localization, and perceptual constancy (Atkinson & Smith, 1983).
In vision, process defines of object covers pattern recognition process that in short names recognition. This is a major factor in lifetime, because we need to know what are the objects for distinguishing and discovering objects main properties. In fact, recognition process implies objects
“essence”. Recognition process classifies objects and puts each object in a specific category.
The place where objects stand is spatial localization. This is also a major factor in lifetime. In fact, localization process implies objects
“where stand”. It helps us to know the exact place and estimate object distance far or near to us.
53
Perceptual constancy, another purpose of visual perception mechanism, maintains object external shape in spite of displacement of their impressions on retinal constantly.
Each of these processes transfers particular components and information. The information used in recognition is: form/shape, color, texture and size. Localization consists of individualization, distance point, and dynamic process that each one should be maintained. The factions have also some other subdivision. Individualization consists of figure and ground, and classification. Lightness and color constancy, shape and size constancy, and location constancy are the proper subset of perceptual constancy. This classification is shown in figure1-A:
Figure 1-A
A Summery of Visual Perception Components
This is a typical division of vision perception that is important for learning in
school and gaining academic achievement. In fact, visual system has skills that
are momentous for learning and life. These visual skills are divided into two categories: Input visional Skills and Visual Perceptual Processing: (McMains, 2002).
Visual perception
Pattern recognition Spatial
localization Perceptual
constancy
Form Texture
Color Size
Lightness and color constancy Shape and
size constancy Location
constancy
Individualization Distance point
Dynamic process
Figure and ground Perceptual
grouping Real
motion Stroboscopic
motion Induced
54
Frosting (1968) emphasizes on the necessity of evaluation and multidimensional and interdisciplinary diagnosis as a foundation for instructional or therapeutic planning for every child. This theory has made important new contributions to the fields of diagnostics, education, and therapy. She believed teachers and therapists must accept the child as an individual personality, respond to the child’s individual needs and social-emotional situation, and arouse the child’s sense of initiative, joy and excitement in living and learning with others. Movement and perception offer an important access to the child and for the child to the world. Movement, language, all perceptual areas, and higher cognitive functions are developed together. The learning environment understands, supportive and trusting. Learning deficits are remediable or compensationable, but integrated into the child’s personality and learning development. Theory aims Apply to activate the creative potentials of the child, but also of the teacher or therapist. Interdisciplinary, not multidisciplinary, teamwork and flexibility in the choice of methods are especially important.
55
Figure 2-A: A Summery of Visual Perception Skills
Visional skills
Input visional Skills Visual Perceptual Processing
Keeping an image single
Accommodation Eye coordination
Eye Movement Skills
Image clarity
Visual integration skills Visual analysis skills
Visual spatial skills
Visual-Visual
Visual-Motor
Auditory-Visual Laterality Bilateral Integration
Directionality
Figure Ground
Visual Form Recognition/Discrimination
& Constancy
Visual Sequentia l Memory
Visual Spatial Memory
Visual Speed & Span of Perception
Visual Closure
56
Not only visual perception deficits impact negatively children’s academic performance, but also it has negative effects on children’s ability to conduct simple, everyday activities which require fine manipulation of objects, such as writing or drawing (Rosenblum, 2006).
Since, the process of reading is demanding a visual system, fine spatial and rapid processing, some of the reading errors that dyslexic children make are a result of poor visual processing (Vidyasagar, 2004).
Ben-Yehudah and Ahissar (2004) found that visual difficulties occur if dyslexics are asked to accurately compare the spatial (or temporal) aspects of serially presented stimuli. They also have difficulties on visual paradigms requiring sequential comparisons because deficits in visual perception or in visual memory could lead to difficulties on these paradigms.
Researchers emphasize that kindergarten and preschool children who have disability in visual perception will have problems not only in academic tests but also in social and affective adjustment at school. In fact, 85% of classroom learning comes through the visual system. Poor visual skills can lead to difficulties with reading, learning, overall school performance and even sports. This happens when a good foundation of vision is not developed properly. Visual perception disorder is not a difficulty in vision system; rather it is a problem in possessing pathway in brain that visual information possessing takes place there. More persons know the visual perceptual difficulties as a reading disorder, while the visual perceptual disorder evinces reading disorder and other problems. Children with visual perception disorder can continue their study in school but with difficulty and hardness.
57
instance of school can prevent many academic failures and maladaptions that are caused by visual perception deficiency. So diagnosis and instruction is very important. Nevertheless, visual perceptual diagnosis is more precious and difficult among the main four types of learning disability. Nevertheless, problems with visual skills can be fixed with proper vision training. A person can learn how to use their visual system more efficiently, so they will be better equipped to handle heavier loads on their visual system. This research is looking for an appropriate tool for diagnosing visual perception in preschool and elementary school students.
Method Subjects
Sixteen hundred students participated in this research. These students were composed of 800 boys (400 preschool students and 400 first grade elementary school students) and 800 girls (400 preschool students and 400 first grade elementary school students). The selection routine followed a multistage sampling method. For the criterion group, 300 subjects were selected out of the 1600 students.
Materials
The developmental test of the visual perception was made on the basis of Frostig test (1964). Five visual skills exist in the Frostig test. They are: eye–motor coordination, figure ground, form constancy, position in space, spatial relations. Its reliability is between .69 and .98 for the total test, .29 to .80 for subtests. The validity coefficient, the correlation coefficients between Frostig test and Goodenough are between .32 and .46. Frostig test was made for the diagnosis of the visual perception.
58
which measures more skills. The pretest of the visual perception that was made has 7 sub-skills: visual-motor integration, figure ground, visual discrimination, form constancy, visualization, spatial relations, and visual sequential memory.
Visual-motor integration subtest: the aim of this subtest is assessment of the ability to coordinate visual perceptual skills with gross-motor movements and fine-motor movements. 15 questions and 1 sample question exist in this subtest. The maximum score is 35.
Figure ground subtest: its aim is estimating the ability to concentrate on specific forms and to excide irrelative drivers extant in the ground. This subtest consists of 8 questions and the maximum score is 22. Finding shapes (rhombic, square, oval, plus, star, moon, and kite) that are latent in a complicated ground is asked from children.
Form constancy subtest: its aim is estimating the ability to discriminate differences in forms. This includes differences in size, shape, shade, and orientation. This subtest consists of two parts. In part A, children must find circles and in part B squares must be found. These shapes are exhibited in different sizes, shades, and textures. The maximum score is 20.
Visual discrimination subtest: This subtest consists of 8 questions. Each one shows a similar picture. In the first four questions children must find a picture that is different from the others. In the later four questions, children must find a picture that is similar to the model picture. The maximum score is 8.
Visualization subtest: its goal is estimating the ability to recall a previously viewed image or object and mentally manipulate the image from various aspects. This subtest contains two parts. Each part consists of 5 questions. Children must find a correct semi-part of each shape. The maximum score is 10.
59
Visual sequential memory subtest: The purpose is estimating the ability to view and then recall a sequence of shapes in the order they were originally presented. This subtest consists of 5 questions and the maximum score is 25.
Couple with this test, Goodenough test was administered to determine the value of criterion validity.
Procedure
After studying the theories and tests made for visual perception, the subtests were chosen for the visual perception test. The primary selected subtests were: figure ground, visual discrimination, form constancy, visual closure, visual sequential memory, visual speed & span of perception, visual-motor integration, visualization, and spatial relations.
Then the subjects were chosen by the multistage sampling method. At first a group of 300 participants were chosen for administrating the primary test. The test was done individually. Subjects had a good performance and made a better response to the subtests of visual-motor integration, figure ground, visual discrimination, form constancy, visualization, spatial relations, and visual sequential memory, and the other subtests were omitted.
Furthermore, some subtests were changed. Subtest 3, at the beginning, had 22 questions, but 2 of the questions were omitted because they could not draw the subjects’ attention. In a like manner, there were 8 questions in subtest 6 that we omitted the question No. 8, because children were not able to draw it.
Scoring system changed in some questions. In subtest 1, questions 15 and 16 were changed. At first, each of them had only one mark. Afterwards, we decided to give one mark to each part of these questions.
60
In data analysis, descriptive statistics was used to constitute the normative tables, Cronbach's alpha for determining reliability coefficients, Pearson correlation coefficient for determining validity coefficients, and t– test for finding the difference between developmental visual perception in boys and girls, and in preschool and first grade elementary school students.
Results
As regards to the difference between the total score in preschool and first grade elementary school students, and also, the difference between the total score in boys and girls in visual perception test, normative Tables are presented with separate gender and academic bases.
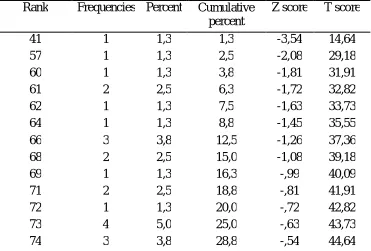
Table 1
The Norms of the Visual Perception Total Score for the Preschool Girl Students
Rank Frequencies Percent Cumulative
percent
Z score T score
41 1 1,3 1,3 -3,54 14,64
57 1 1,3 2,5 -2,08 29,18
60 1 1,3 3,8 -1,81 31,91
61 2 2,5 6,3 -1,72 32,82
62 1 1,3 7,5 -1,63 33,73
64 1 1,3 8,8 -1,45 35,55
66 3 3,8 12,5 -1,26 37,36
68 2 2,5 15,0 -1,08 39,18
69 1 1,3 16,3 -,99 40,09
71 2 2,5 18,8 -,81 41,91
72 1 1,3 20,0 -,72 42,82
73 4 5,0 25,0 -,63 43,73
61
75 3 3,8 32,5 -,45 45,55
77 8 10,0 42,5 -,26 47,36
78 2 2,5 45,0 -,17 48,27
80 7 8,8 53,8 ,01 50,09
81 2 2,5 56,3 ,10 51,00
82 1 1,3 57,5 ,19 51,91
83 1 1,3 58,8 ,28 52,82
84 1 1,3 60,0 ,37 53,73
85 6 7,5 67,5 ,46 54,64
86 4 5,0 72,5 ,55 55,55
87 1 1,3 73,8 ,65 56,45
88 3 3,8 77,5 ,74 57,36
89 5 6,3 83,8 ,83 58,27
90 4 5,0 88,8 ,92 59,18
95 1 1,3 90,0 1,37 63,73
96 2 2,5 92,5 1,46 64,64
97 2 2,5 95,0 1,55 65,55
99 4 5,0 100,0 1,74 67,36
Mean: 79/90, Std. Deviation: 11, Std. error Mean: 1/23 Median: 80 Mode: 77
62
Table 2
The Norms of the Visual Perception Total Scores for the First Grade Girl Students
Rank Frequencies Percent Cumulative
percent
Z score T score
66 1 1,3 1,3 -2,17 28,30
69 2 2,5 3,8 -1,88 31,15
71 2 2,5 6,3 -1,69 33,05
74 1 1,3 7,5 -1,41 35,90
75 3 3,8 11,3 -1,31 36,85
77 2 2,5 13,8 -1,12 38,75
78 2 2,5 16,3 -1,03 39,71
79 3 3,8 20,0 -,93 40,66
80 3 3,8 23,8 -,84 41,61
82 5 6,3 30,0 -,65 43,51
83 2 2,5 32,5 -,55 44,46
84 2 2,5 35,0 -,46 45,41
85 4 5,0 40,0 -,36 46,36
86 2 2,5 42,5 -,27 47,31
87 3 3,8 46,3 -,17 48,26
88 4 5,0 51,3 -,08 49,21
89 2 2,5 53,8 ,02 50,16
90 6 7,5 61,3 ,11 51,11
91 1 1,3 62,5 ,21 52,06
92 2 2,5 65,0 ,30 53,01
93 2 2,5 67,5 ,40 53,96
95 3 3,8 71,3 ,59 55,87
96 3 3,8 75,0 ,68 56,82
97 1 1,3 76,3 ,78 57,77
98 3 3,8 80,0 ,87 58,72
99 2 2,5 82,5 ,97 59,67
100 2 2,5 85,0 1,06 60,62
101 3 3,8 88,8 1,16 61,57
102 2 2,5 91,3 1,25 62,52
106 1 1,3 92,5 1,63 66,32
107 3 3,8 96,3 1,73 67,27
110 3 3,8 100,0 2,01 70,12
63
Table 3
The Norms of the Visual Perception Total Scores for the Preschool Boy Students
Rank Frequencies Percent Cumulative percent Z score T score
50 1 1,3 1,3 -2/49 25/06
56 1 1,3 2,5 -1,95 30,53
57 1 1,3 3,8 -1,86 31,44
61 4 5,0 8,8 -1,49 35,08
63 1 1,3 10,0 -1,31 36,90
64 2 2,5 12,5 -1,22 37,81
65 2 2,5 15,0 -1,13 38,72
66 4 5,0 20,0 -1,04 39,64
69 2 2,5 22,5 -,76 42,37
70 1 1,3 23,8 -,67 43,28
71 3 3,8 27,5 -,58 44,19
72 2 2,5 30,0 -,49 45,10
73 5 6,3 36,3 -,40 46,01
74 2 2,5 38,8 -,31 46,92
75 4 5,0 43,8 -,22 47,83
76 4 5,0 48,8 -,13 48,74
77 1 1,3 50,0 -,03 49,65
78 5 6,3 56,3 ,06 50,56
79 7 8,8 65,0 ,15 51,48
81 2 2,5 67,5 ,33 53,30
82 2 2,5 70,0 ,42 54,21
83 1 1,3 71,3 ,51 55,12
84 2 2,5 73,8 ,60 56,03
85 1 1,3 75,0 ,69 56,94
86 3 3,8 78,8 ,79 57,85
87 4 5,0 83,8 ,88 58,76
88 1 1,3 85,0 ,97 59,67
89 1 1,3 86,3 1,06 60,58
90 2 2,5 100,0 1,15 61,49
92 1 1,3 90 1,33 63,32
94 1 1,3 91,3 1,51 65,14
95 2 2,5 93,8 1,60 66,05
96 2 2,5 96,3 1,70 66,96
98 1 1,3 97,5 1,88 68,78
101 1 1,3 98,8 2,15 71,51
104 1 1,3 100,0 2,42 74,24
64
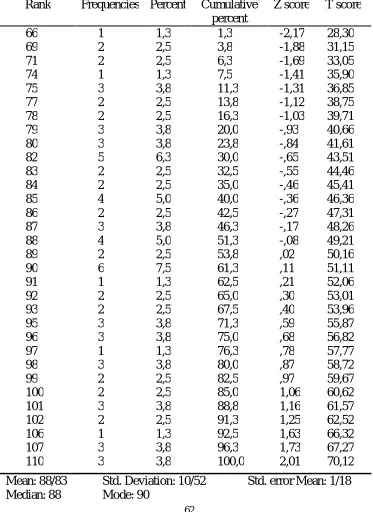
Table 4
The Norm of the Visual Perception Total Scores for the First Grade Boy Students
Rank Frequencies Percent Cumulative percent Z score T score
57 1 1,3 1,3 -2,51 24,93
61 2 2,5 3,8 -2,08 29,18
62 1 1,3 5,0 -1,98 30,24
65 1 1,3 6,3 -1,66 33,43
67 2 2,5 8,8 -1,44 35,56
69 2 2,5 11,3 -1,23 37,68
70 3 3,8 15,0 -1,13 38,75
71 1 1,3 16,3 -1,02 39,81
72 4 5,0 21,3 -,91 40,87
73 2 2,5 23,8 -,81 41,93
74 1 1,3 25,0 -,70 43,00
76 2 2,5 27,5 -,49 45,12
77 5 6,3 33,8 -,38 46,18
78 5 6,3 40,0 -,28 47,25
79 3 3,8 43,8 -,17 48,31
80 2 2,5 46,3 -,06 49,37
81 4 5,0 51,3 ,04 50,44
82 1 1,3 52,5 ,15 51,50
83 4 5,0 57,5 ,26 52,56
84 4 5,0 62,5 ,36 53,62
85 9 11,3 73,8 ,47 54,69
86 3 3,8 77,5 ,57 55,75
87 4 5,0 82,5 ,68 56,81
88 2 2,5 85,0 ,79 57,87
89 3 3,8 88,8 ,89 58,94
90 2 2,5 91,3 1,00 60,00
93 2 2,5 93,8 1,32 63,19
94 1 1,3 95,0 1,43 64,25
95 1 1,3 93,6 1,53 65,31
100 1 1,3 97,5 2,06 70,63
105 1 1,3 98,8 2,59 75,94
108 1 1,3 100,0 2,91 79,13
65
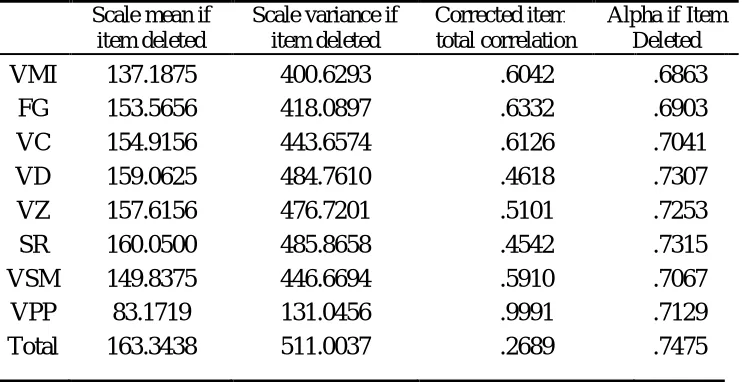
For the replication of the hypothesis that the test has a good reliability, Cronbach 's alpha was used. The results are shown in Table 5:
Table 5
Alpha Coefficients of the Total Test and the Subtests
Scale mean if item deleted
Scale variance if item deleted
Corrected item– total correlation
Alpha if Item Deleted
VMI 137.1875 400.6293 .6042 .6863
FG 153.5656 418.0897 .6332 .6903
VC 154.9156 443.6574 .6126 .7041
VD 159.0625 484.7610 .4618 .7307
VZ 157.6156 476.7201 .5101 .7253
SR 160.0500 485.8658 .4542 .7315
VSM 149.8375 446.6694 .5910 .7067
VPP 83.1719 131.0456 .9991 .7129
Total 163.3438 511.0037 .2689 .7475
The Alpha coefficients of the total test = .74
Also, to answer the hypothesis that the test has a good validity, criterion validity was used. In Table 6, the correlation coefficients between the total score, subtests scores and Goodenough test are shown.
Table 6
Correlation Coefficients of Goodenough Test and the Subtests and the Total Test
Total Subtest 7
Subtest 6
Subtest 5
Subtest 4
Subtest 3
Subtest 2
Subtests Criterion
method
.467 .241 .227 .308 .103 .201 .201 Pearson
Correlation Goodenough
.039 .017 .005 .024 .007 .013 .013 Sig.
66
According to the results, the correlation coefficients for the total score and the scores of all the subtests are significant.
To confirm the hypothesis that there is a difference between the developmental visual perception in boys and girls, the difference was significant: (t = 4.378, and for the difference between the developmental visual perception in the preschool and first grade elementary school students the difference was significant: (t = 4.978, .
Discussion
Time is a main factor in learning the visual perception skills. At long last, many normal children will learn these skills and the related process can be accomplished without any training schedules. The only difference among the children is related to the time of coming into sight. Training schedules for all the children start at the same age, the least amount of delay in learning the visual perception skills can cause a primary dropout in the academic performance. Using a good test for the visual perception diagnosis of the deficiencies is very important to help these children.
The Developmental Test of Visual Perception (DTVP) has a good reliability (.74). The reliability of our test that was attained by Cronbach's alpha is very close to Frostig test reliability (.69, .98). Also, its validity (.467) is close to Frostig test validity (.32, .46) so, it has an acceptable validity.
67
inconsistent findings. Levine, Huttenlocher, Taylor, and Langrock (1999) report a difference in favor of boys, at the 4 years of age, on both rotation and translation skills. Kaplan and Weisberg (1987) found that the third-grade girls performed significantly better than the boys on the tasks involving recognition of embedded figures. Manger and Eikeland’s (1998) report no sex differences among sixth graders on spatial visualization tasks. As noted by Voyer, Voyer, and Bryden (1995), sex differences on spatial tasks do not appear at one age, rather, they emerge on different tasks at different preadolescent and adolescent ages, and their magnitude increases with age (Lachance & Mazzocco, 2006).
References
Atkinson, R. L. & Smith, E. E. (1983). Introduction to psychology (8 thed.). New York: Harcourt Brace Jovanovich, Inc.
B
Beenn--YYeehhuuddaa,, GG..,, && AAhhiissssaarr,, MM.. ((22000044). Sequential spatial frequency discrimination is consistently impaired among adult dyslexics. Vision Research, 44, 10, 1047-1063.
Evans, B. J. W., Drasdo, N., & Richards, I. L. (1994). An investigation of some sensory and refractive visual factors in dyslexia. Vision Research, 34, 14, 1913-1926.
Frostig, M., Lewis, L. A. (1964). The Marianne Frostig Developmental Test of Visual Perception. Palo Alto, Calif.: Consulting Psychologists Press.
Frostig, M. (1968). Education for children with learning disabilities. in H. Myklebust (ed.)., Progress in leaning disabilities, Vol. 243 – 266. New York: Grune & Stratton.
Kaplan, B. J., & Weisberg, F. B. (1987). Sex differences and practice effects on two visual–spatial tasks. Perceptual and Motor Skills, 64, 139–142.
68
Lachance, J. A., & Mazzocco, M. M. M. (2006). A longitudinal analysis of sex differences in math and spatial skills in primary school age children. Learning and Individual Differences 16, 195–216.
Levine, S. C., Huttenlocher, J., Taylor, A., & Langrock, A. (1999). Early sex differences in spatial skill. Developmental Psychology, 35, 940– 949.
Manger, T., & Eikeland, O. (1998). The effects of spatial visualization and students’ sex on mathematical achievement. British Journal of Psychology, 89, 17–25.
McMains, M. (2002). Vision and Learning-A Resource for Parents and Educators. Available in (www.visionandlearning.org)
Rosenblum, S. (2006). The development and standardization of the children activity scales (ChAS-P/T) for the early identification of children with developmental coordination disorders, Child: Care, Health and Development, 32, 619–632.
Vidyasagar, T. R. (2004). Neural underpinnings of dyslexia as a disorder of visuo-spatial attention, Clinical and Experimental Ophthalmology, 87.1, 4–10.
Voyer, D., Voyer, D., & Bryden, M. P. (1995). Magnitude of sex differences in spatial abilities: A meta-analysis and consideration of critical variables. Psychological Bulletin, 117, 250–270.
Wepman, J. (1968). The Modality Concept. Helen K. Smith (ed.),
Perception and Reading. Newark, Del.: international reading Association.
Received: 2 8 / 6 / 2 0 1 0
Revised : 2 6 / 7 / 2 0 1 1