R E S E A R C H
Open Access
Targeted Chromatin Capture (T2C): a novel high
resolution high throughput method to detect
genomic interactions and regulatory elements
Petros Kolovos
1, Harmen JG van de Werken
1, Nick Kepper
2, Jessica Zuin
1, Rutger WW Brouwer
3,
Christel EM Kockx
3, Kerstin S Wendt
1, Wilfred FJ van IJcken
3, Frank Grosveld
1*and Tobias A Knoch
1*Abstract
Background:Significant efforts have recently been put into the investigation of the spatial organization and the chromatin-interaction networks of genomes. Chromosome conformation capture (3C) technology and its derivatives are important tools used in this effort. However, many of these have limitations, such as being limited to one viewpoint, expensive with moderate to low resolution, and/or requiring a large sequencing effort. Techniques like Hi-C provide a genome-wide analysis. However, it requires massive sequencing effort with considerable costs. Here we describe a new technique termed Targeted Chromatin Capture (T2C), to interrogate large selected regions of the genome. T2C provides an unbiased view of the spatial organization of selected loci at superior resolution (single restriction fragment resolution, from 2 to 6 kbp) at much lower costs than Hi-C due to the lower sequencing effort. Results:We applied T2C on well-known model regions, the mouseβ-globinlocus and the humanH19/IGF2locus. In both cases we identified all known chromatin interactions. Furthermore, we compared the humanH19/IGF2 locus data obtained from different chromatin conformation capturing methods with T2C data. We observed the same compartmentalization of the locus, but at a much higher resolution (single restriction fragmentsvs.the common 40 kbp bins) and higher coverage. Moreover, we compared theβ-globinlocus in two different biological samples (mouse primary erythroid cells and mouse fetal brain), where it is either actively transcribed or not, to identify possible transcriptional dependent interactions. We identified the known interactions in theβ-globinlocus and the same topological domains in both mouse primary erythroid cells and in mouse fetal brain with the latter having fewer interactions probably due to the inactivity of the locus. Furthermore, we show that interactions due to the important chromatin proteins, Ldb1 and Ctcf, in both tissues can be analyzed easily to reveal their role on transcriptional interactions and genome folding.
Conclusions:T2C is an efficient, easy, and affordable with high (restriction fragment) resolution tool to address both genome compartmentalization and chromatin-interaction networks for specific genomic regions at high
resolution for both clinical and non-clinical research.
Keywords:Chromatin conformation capture, Long range interactions, Enhancers, Promoters
* Correspondence:[email protected];[email protected]
1
Department of Cell Biology, Erasmus MC, Dr. Molewaterplein 50, 3015GE Rotterdam, The Netherlands
Full list of author information is available at the end of the article
© 2014 Kolovos et al.; licensee BioMed Central Ltd. This is an Open Access article distributed under the terms of the Creative Commons Attribution License (http://creativecommons.org/licenses/by/4.0), which permits unrestricted use, distribution, and reproduction in any medium, provided the original work is properly credited. The Creative Commons Public Domain Dedication waiver (http://creativecommons.org/publicdomain/zero/1.0/) applies to the data made available in this article, unless otherwise stated.
Background
A number of recent studies have shown that the genome is organized in self-associating domains [1] that are sepa-rated by linker regions. These so-called ‘topological do-mains’or‘topological associated domains’generally range from 300 kilobasepairs (kbp) to 1 megabasepairs (1 Mb) and consist of a series of different types of chromatin loops in agreement with earlier models of the genome ([2] and references therein).
One loop is defined as two distant chromatin regions coming, spatially, into close proximity (interact with each
other), thereby creating DNA loops. Such ‘long-range
interactions’have been first observed between promoters and distant enhancers ([3,4] and references therein) and can bring DNA elements together that are separated by a large distance on the linear DNA strand ([5,6] and refe-rences therein). These regulatory elements (enhancers or silencers) are short sequences containing several binding sites for transcription factors, which regulate the activa-tion (reviewed in [7]) repression (reviewed in [8]) genes and their subsequent transcription (reviewed in [9]). In the linear genome the distance between enhancer(s) and gene can be quite large, for example, the sonic hedgehog (shh) enhancer is located about 1 Mb away from its target
gene Shh [10]. Changes or differences within these
ele-ments and their interaction with genes can be responsible for changes in gene expression [11], causing intrinsic dif-ferences between individuals, disease susceptibility, and disease progression.
A number of chromatin loops are thought to be purely structural, that is, to enable the folding of the genome creating distinct topological domains, while other loops have a function in the expression of genes. Loops of the
latter type are frequently found within topological do-mains, but are less frequently observed between different topological domains [1,12]. These regulatory chromatin loops change and depend on a large number of proteins including Ctcf [13], cohesin [14], and a series of tran-scription factors [15-18], which are mostly involved in the transcriptional regulation of genes within the domain.
The recent refinements of the genome structure were largely due to the chromosome conformation capture (3C) technique which allowed the rapid identification of chromatin regions residing in close proximity [19,20]. The basic principle of the 3C technique is that segments, which are spatially in close proximity within the cell nucleus, can be tethered together by cross-linking. After cross-linking and restriction enzyme digestion of the genome, the proximal segments remain covalently linked and segment ends can be, subsequently, ligated in dilute conditions. The ligation products can be analyzed using PCR-based methods [19]. A number of different 3C-type techniques have been developed to answer different biological questions including: 3C/3C-qPCR [19,21,22], 3C-seq/4C-seq [23,24], 4C (3C-on-a chip) [25-27], Chro-matin Interaction Analysis by Paired-End Tag Sequen-cing (ChIA-PET) [28], 5C (3C carbon copy) [29], and Hi-C [30]. All these techniques have their own advan-tages and limitations (Table 1) and have provided very valuable information on chromosomal interactions and gene transcription mechanisms [20,25,30,31]. 3C and 4C are quite work- and cost-intensive, given that they are only one-to-one fragment and one-to-all fragment tech-niques, respectively. Prior knowledge of the locus is ne-cessary to define the region of interest.
Table 1 Comparison between different chromatin conformation capturing techniques (adopted and modified from [23])
Method Applications Advantages Limitations
3C-qPCR One-to-one Simple analysis Laborious, requires knowledge of the locus
and proper controls
3C-seq/4C-seq One-to-all Good resolution, good signal-to-noise ratio
Restricted to single viewpoint per experiment when multiplexing several viewpoints, analysis requires extra bioinformatics expertise, not an all-to-all genome-wide method
3C-on-chip (4C) One-to-all Relatively simple data analysis Poor signal-to-noise ratio, difficult to obtain genome-wide coverage
5C Many-to-many Identifies interactions between
many individual fragments
Very laborious, no genome-wide coverage, primer design can be challenging. Analysis requires advanced bioinformatics expertise
Hi-C All-to-all Explores the genome-wide interactions
between all individual fragments
Very expensive, requires a large sequence effort to obtain sufficient coverage, approximately 10 to 40 kbp resolution, requires advanced bioinformatics expertise
T2C Many-to-all Explores the interactome of a selected region
in cis but also in trans, high (restriction fragment) resolution, cheaper than Hi-C and 5C, requiring only half a lane of Illumina HiSeq2000
Is restricted to the selected regions of the genome,
The analysis of the interactions of several viewpoints with the aforementioned techniques in 3C and 4C is pos-sible, but the choice for several viewpoints will increase the costs and work effort linearly. However, the number of viewpoints can also be limited due to the (often) limiting amount of available cell material. 5C is demanding in primer design and allows the analysis of interactions only among the primer designed fragments. Furthermore, ge-nome-wide coverage is not possible. Hi-C is very expen-sive as it requires extremely deep sequencing in order to cover the whole genome, even at a relatively low reso-lution of 40 kbp. The most recent Hi-C data analysis has used a new algorithm and provided a genome-wide inter-action map of 10 kbp resolution. However, an enormous amount of sequencing is required (3.4 billion mapped paired-end reads from six biological replicates) [32]. Such effort is not affordable for most research groups and, in addition, the scientific interest is most of the time focused on a specific question involving a limited set of specific loci or domains. Hence, there is a need for a technique which eliminates most of the aforementioned limitations.
Here we present Targeted Chromatin Capture (T2C), a new 3C method, which does not involve a massive se-quencing effort, but which results in a high resolution map of interactions for particular loci of interest. We used
the well-studied human H19/IGF2 locus and compared
the results of our new method with data from other chromatin conformation capturing techniques. Using the
mouse β-globin locus we demonstrated that the method
can reliably identify chromatin structural changes bet-ween different tissues and also allows the study of the role of individual transcription factors in the chromatin architecture.
Overview of the procedure
To overcome the aforementioned problems of the 5C and Hi-C techniques we have developed the novel method T2C. The method has the advantage that it allows the ana-lysis of the structure of the genome and all the interac-tions of selected regions of the genome at high resolution (single restriction fragments) without a massive sequen-cing effort and associated costs.
T2C employs a selective enrichment of the 3C ligation products in preselected regions of interest in order to identify their interactions within a domain as well as the compartmentalization of one or several specific regions of the genome. These regions can be continuous Mb sized genomic regions, but could also be a collection of smaller regions (a few kbp each). Every captured restric-tion fragment can be used as a single‘4C-seq viewpoint’ and analyzed accordingly. The results of T2C provide a local interaction map at a restriction fragment-level resolution accompanied with a lower sequencing effort
and less intricate bioinformatics analysis than Hi-C. T2C also overcomes the limits of 5C since it identifies not only interactions within the targeted region(s), but also interactions between the targeted region(s) and with re-gions outside of them.
In brief, we have designed sets of unique oligonucleotide probes (ranging from 62 to 90 nucleotides) specific for all the restriction fragments and as close as possible to the end of the first restriction site (Mm - HindIII + NlaIII digest,Hs- BglII + NlaIII digest) in our regions of interest,
the mouseβ-globinlocus and the humanH19/IGF2locus
(see Methods). Alternative to continuous regions, separate genomic regions within one (or more) chromosomes could be analyzed simultaneously. The oligonucleotides are spotted on an array or can alternatively be captured on beads. Some fragment ends cannot be captured by a designed oligonucleotide due to the presence of repeat elements or the insufficient size of the restriction fragment end. Repetitive sequences are a general problem in all 3C-based methods, including Hi-C. The size limitation of the fragment end can be circumvented if necessary by a backup procedure with different enzymes (changing either the first or the second restriction enzyme or both), which generates a new set of end fragments or by mechanically shearing of the chromatin (instead of the second restric-tion enzyme digesrestric-tion) which can result in fragment sizes of different length (see Discussion).
The first steps of the preparation of the chromatin con-formation capturing library are carried out as in 3C-seq [23]. Basically, chromatin is cross-linked, followed by di-gestion with a 6 bp recognition restriction endonuclease, ligation in diluted conditions and decross-linking of the DNA. The library is subsequently digested with a frequently-cutting 4 bp recognition restriction endonucle-ase or mechanically sheared to obtain small fragments containing the ligation site, followed by end-repair and ligation of an adapter. Within the adapter, different bar-codes can be included that would allow multiplexing of different samples. The resulting library is hybridized to the specific oligonucleotide probe set representing the area(s) of interest (either on an array or in a bead captu-ring procedure) to enrich specifically for the interacting fragments of the region of interest (all fragments posi-tioned at the ends of the original 6 bp-cut fragments after the second 4 bp-cut and eliminate all fragments in-ternal to the 6 bp generated fragments). After extensive washing all ligation products including regions covered by the targeting-array are eluted and their sequence de-termined by Illumina-sequencing (Figure 1). The capture efficiency (the proportion of paired reads of total reads when at least one read of the paired end reads is located on a fragment represented by an oligonucleotide) is between 47% and 86% depending the cell type and the region (see Table 2).
Kolovoset al. Epigenetics & Chromatin2014,7:10 Page 3 of 17
Results
T2C identifies known long-range interactions
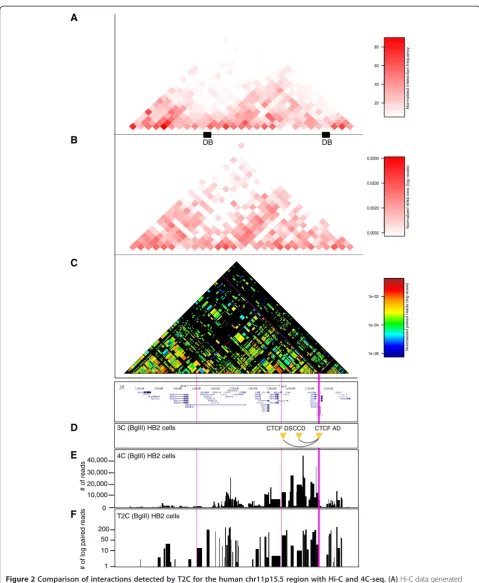
We first have chosen the H19/IGF2 region on human
chromosome 11 to test and compare the method to other 3C methods. Previously, we analyzed the 3D-structure of the locus by 3C to study the role of cohesin and CTCF for
chromosomal long-range interactions [33] and also gene-rated 4C-seq data [14] (Figure 2). Hi-C interaction maps were retrieved for IMR90 cells [1].
We selected unique oligonucleotides mapping near the ends of 344 BglII generated fragments spanning 2.1 Mb
around the H19/IGF2 locus (Table 2). This set of 525
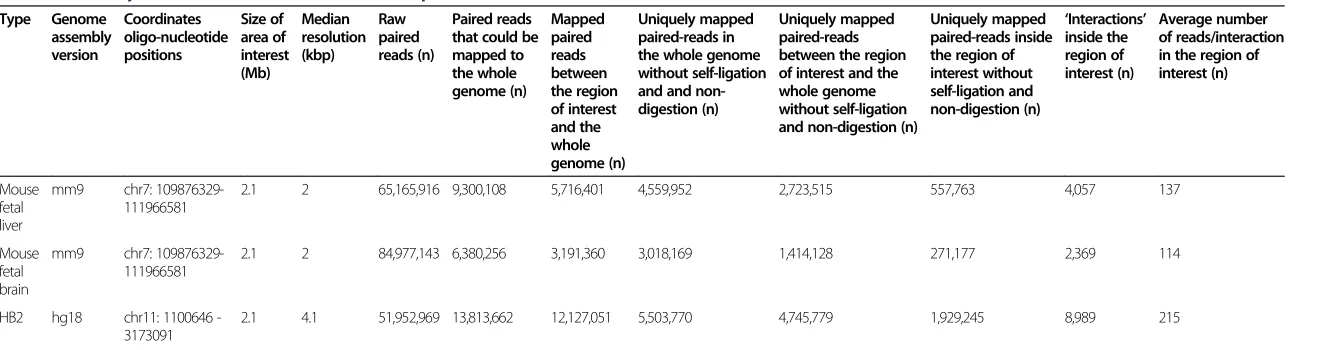
Table 2 Summary of information about the different experiments
Type Genome
assembly version
Coordinates oligo-nucleotide positions
Size of area of interest (Mb)
Median resolution (kbp)
Raw paired reads (n)
Paired reads that could be mapped to the whole genome (n)
Mapped paired reads between the region of interest and the whole genome (n)
Uniquely mapped paired-reads in the whole genome without self-ligation and and non-digestion (n)
Uniquely mapped paired-reads between the region of interest and the whole genome without self-ligation and non-digestion (n)
Uniquely mapped paired-reads inside the region of interest without self-ligation and non-digestion (n)
‘Interactions’ inside the region of interest (n)
Average number of reads/interaction in the region of interest (n)
Mouse fetal liver
mm9 chr7: 109876329-111966581
2.1 2 65,165,916 9,300,108 5,716,401 4,559,952 2,723,515 557,763 4,057 137
Mouse fetal brain
mm9 chr7: 109876329-111966581
2.1 2 84,977,143 6,380,256 3,191,360 3,018,169 1,414,128 271,177 2,369 114
HB2 hg18 chr11: 1100646 -3173091
2.1 4.1 51,952,969 13,813,662 12,127,051 5,503,770 4,745,779 1,929,245 8,989 215
Columns from left to right: Tissue type or cells; genome assembly version; summary of the positions of oligonucleotides (region of interest); the size and the median resolution of the area under investigation; the number of the raw paired-reads (before alignment, that is, all reads from the sequenator); the number of mapped paired reads that could be mapped back to the whole genome; the number of paired reads between the region of
interest (fragments with oligonucleotides) and the whole genome; the number of uniquely mapped paired-reads in the whole genome after removal of the self-ligation and non-digestion events (SeeMethods); the number of
uniquely mapped reads between the region of interest (fragments with oligonucleotides) and the whole genome after removal of the self-ligation and non-digestion events; the number of uniquely mapped
paired-reads inside the region of interest after removal of the self-ligation and non-digestion events; the number of‘interactions’between fragments in the region of interest; average number reads per interaction. The capture
efficiency and purification (enrichment) by hybridization is high (that is, how many reads from the region of interest (‘specific’reads) are found when compared to total reads, that is, the reads that are from other areas of the
genome and not containing a sequence from the area of interest (‘non-specific’reads)). We find that the‘specific’reads represent 61%, 50%, and 88% of total reads (‘specific’plus‘non-specific’) for mouse primary erythroid
cells, mouse fetal brain cells, and HB2, respectively, including the self-ligation and non-digestion events. By removing those events those numbers change to 60%, 47%, and 86%, respectively. This means for example that 60%
of the fetal liver reads (2,723,515) represent 2.1 × 10⁶
bases (the region of interest) while the remaining 40% of reads represents 3.109
bases (the whole genome), numbers that indicate a high level of enrichment by the hybridization step.
Kolovos
et
al.
Epigenetics
&
Chroma
tin
2014,
7
:10
Page
5
o
f
1
7
http://ww
w.epigene
ticsandchroma
tin.com/
content/7/1
A
B
C
D
E
0 30,000
40,000 4C (BglII) HB2 cells
10,000
DB DB
T2C (BglII) HB2 cells
# of log pair
ed r
eads
# of r
eads
F
1 10 50 200 20,000
20 40 60 80
No
rmali
z
ed Inte
raction frequency
CTCF AD CCD
CTCF DS
3C (BglII) HB2 cells
1e−06 1e−04 1e−02
Normalized paired reads (log-scale)
0.0002 0.0020 0.0200 0.2000
No
rmali
z
ed 40kb bins (lo
g
−scale)
oligonucleotides was spotted on a capture array. A ligation fragment library was generated from the breast endothelial cell line 1-7HB2 (abbreviated HB2) after digestion with BglII and NlaIII according to the 3C-seq protocol [23] (see also Figure 1). The library was subsequently hybri-dized to the capture array. After elution from the capture array the captured DNA fragments were amplified by a PCR with low cycle number (12 cycles) and sequenced by paired-end Illumina sequencing (see Methods).
To demonstrate that T2C reveals a similar overall inter-action pattern and compartmentalization of the locus as observed by Hi-C in IMR90 cells [1] we first binned the paired-reads into 40 kbp bins (Figure 2A, B). The inter-action patterns at this level of resolution show that the topological domain is maintained between different cell types, HB2 [14]versusIRM90 [1] with a Spearman’s rank correlation coefficientrs= 0.64 (P<2.2 × 10⁻¹⁶).
However, with T2C we obtained a chromatin inter-action map at restriction fragment resolution (Figure 2C, each block represents one restriction fragment), revea-ling significantly more detail with respect to the general chromatin organization of the region when visualized by a logarithmic and rainbow-like colored interaction fre-quency. To first validate T2C in comparison to 3C and 4C-seq we compared the interactions of a single restric-tion fragment (CTCF AD viewpoint) [33] to interacrestric-tions detected for this fragment by 3C [33] and 4C-seq [14] (Figure 2D, E, F). Although there are some variations in the read coverage of the individual interactions, similar interactions can be observed by both 4C-seq and T2C. Moreover, both methods detect interactions which we previously observed with 3C [33]. It should be noted that an important difference between 4C-seq and T2C is the number of PCR amplification cycles. For T2C this is on average 12 cycles (only after capture) whereas for 4C-seq it is 30 cycles. The lower number of cycles will give less PCR bias of the different fragments relative to each other, because fragments have different PCR efficiencies.
We conclude that the T2C method yields interaction data at a resolution identical to 4C-seq for the individual restriction fragments (median approximately 4 kbp reso-lution) and that when T2C is performed for a conti-nuous region over 2 Mb it can reproduce the overall topological domain structure that was observed by Hi-C.
T2C identifies different interaction networks based on different biological materials
Next we used the extensively characterized mouseβ-globin locus as a model system to show that the T2C method can detect reliably conformational changes due to activation of the genesin vivoat high resolution (Figures 3 and 4). We further showed, with an intersection between ChIP-seq derived chromatin protein data and T2C, that chromatin
proteins may be involved in forming or maintaining the 3D structure of the genome (Figure 5).
The mouseβ-globinlocus undergoes structural changes upon activation in erythroid tissue [20,34,35], but is sur-rounded by silent olfactory receptor genes, which are only expressed in the olfactory epithelium. The major
dif-ference between the H19/IGF2 locus and the β-globin
locus is that theβ-globinlocus is embedded in a large area of inactive genes. Thus two patterns of interactions may be expected in erythroid cells, those important for the glo-bin locus and those present in inactive chromatin. We selected a region of 2.1 Mb around the locus (Table 2) containing 719 restriction fragments of the restriction enzyme HindIII (6 bp recognition site). About 800 oligo-nucleotide probes were designed close to the ends of the fragments. To analyze the locus in its active state we used primary erythroid cells from fetal liver which were com-pared to fetal brain cells as a model of inactive loci. Based on results from previous 3C studies of the locus [20,35] we expected in primary erythroid cells a higher number of
interactions around the β-globin gene and between the
β-globingene and its regulatory elements.
The analysis of the hybridized fragments shows that almost the entire 2.1 Mb appears to be part of one topo-logical domain (with two possible subdomains, one of which contains theβ-globinlocus) with the next domain starting near the end of the selected sequences (due to the repetitive sequences and the borders of the region of interest, that topological domain cannot be depicted
clearly, in agreement with Dixon et al. [1]) both in
mouse primary erythroid cells (Figure 3A, right hand side) and mouse fetal brain cells (Figure 3B) with many interactions within the topological domain (Figure 3C and 3D). Although the topological domain structure bet-ween the different biological materials is similar, there appear to be fewer interactions in mouse fetal brain cells relative to mouse primary erythroid cells due to the in-activity of the locus in the brain (Figure 3). Focusing on
the β-globin region, all the well-known interactions in
the β-globinlocus are detected in the primary erythroid
cells. The known interactions, such as between the
β-globin promoter and Locus Control Region (LCR)
(Figure 4B, adapted and modified from Drissen et al.,
with blue line depicting the interactions for primary erythroid cells and with grey the interactions for mouse fetal brain cells) and between the LCR-3′HS1 are clearly visualized [16,20,35] (Figure 4A). These interactions are absent from the fetal brain sample (Figure 4C). Further-more, the main regulatory region (HS1-6) shows the
well-known interaction with theβ-globingenes and HS1
at the 3′end of the locus in fetal liver cells but not in brain [16,20]. In addition, for the β-globinpromoter we identify a few additional interactions further away than the ones previously reported. These are located even
Kolovoset al. Epigenetics & Chromatin2014,7:10 Page 7 of 17
approximately 1 Mb far from the β-globin promoter (Figure 3A). It is unknown whether these interactions are related to the functioning of the β-globin genes or whether these DNA elements are in close proximity due to the folding of the domain, although their absence in the fetal brain suggests they have a role in the regulation of the globin β-globin. In addition to the interactions
in cis, theβ-globin(Hbb-b1) gene and the LCR also
con-tact a number of positions on other chromosomes.
T2C in combination with ChIP-seq identifies factor specific interactions
We also compared the interactions of the binding sites of an important regulatory transcription factor in mouse primary erythroid cells, the Ldb1 complex, and the insula-tor binding protein Ctcf (Figure 5A-D). Ldb1 is highly enriched on theβ-globin locus and its LCR in mouse pri-mary erythroid cells compared to fetal brain cells [36]. By visualizing only the restriction fragments containing the
HS −85
H
b
b−b1
3'HS 1
− 192
− 159
− 20
− 83
− 65
− 52 − 97
− 145
110.0 110.5 111.0 111.5 112.0
Normalized paired reads (log−scale) Normalized 40kb bins (log−scale)
HS −85
H
b
b−b1
3'HS 1
− 192
− 159
− 20
− 83
− 65
− 52 − 97
− 145
110.0 110.5 111.0 111.5 112.0
Chromosome 7 location (Mb)
HindIII β-globin locus
Oligonucleotides
p300
Ldb1 H3K9Ac H3K4me3 H3K4me1 H3K27Ac
Ctcf
PolII
Chromosome 7 location (Mb)
A
B
C
D
Figure 3Comparison of the compartmentalization and interactions for theβ-globinlocus.T2C performed in a 2.1 Mb region around the
HindIII
-globin locus
Oligonucleotides
p300
Ldb1
H3K9Ac H3K4me3
H3K4me1
H3K27Ac
Ctcf
HS −85
HS −62.5
HS −60.7
HS 6
HS 5
HS 4
HS 3
HS 2
HS 1
HS 0
H
bb−y
H
b
b−bh1
H
bb−b1
H
b
b−b2
3'HS 1
− 192
− 159
− 20
− 22
− 39
− 52 − 97
− 145 1.0
H
bb−b1 HS 0 HS 1 HS 2HS 2HS 2 HS 3 HS 4 HS 5 HS 6HS 6HS 6
3'HS 1
110.90 110.95 111.00 111.05 111.10
Normalized paired reads (log−scale)
rel cr
oss-link
ing fr
equenc
y
C
B
A
PolII
HS −62.5
HS −60.7HS −60.7
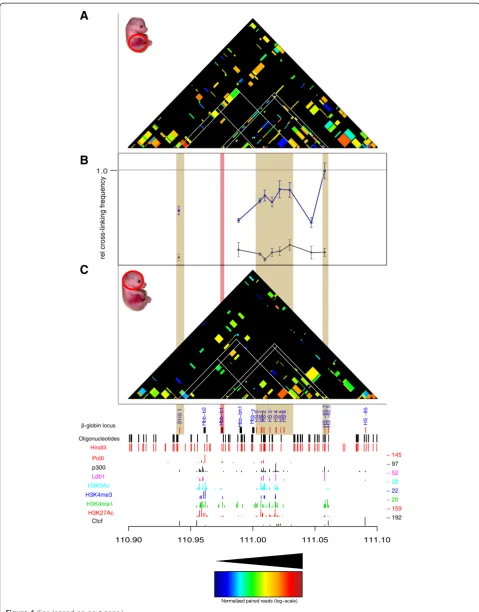
Figure 4(See legend on next page.)
Kolovoset al. Epigenetics & Chromatin2014,7:10 Page 9 of 17
Ldb1 or Ctcf binding sites as determined by ChIP-seq in fetal liver derived mouse erythroleukemia cells (MEL) [37,38], we can immediately deduce in which interactions the Ldb1 complex (Figure 5E, F) or Ctcf (Figure 5G, H) are involved. In addition, we can identify the restriction frag-ments that represent gene promoter fragfrag-ments (by Histone 3 Lysine 4 trimethylation (H3K4me3)) or enhancer fragments (marked by H3K4me1, that is, in the LCR, HS-60, and -62.5) or neither of these, by plotting the his-tone modifications ChIP-seq profiles [37]. Interestingly the 3′HS1 and HS-85 belong to the latter class and have robust Ctcf but not Ldb1 binding sites. This suggests that they are ‘structural’ elements which would fit with the observation that the deletion of the 3′HS1 results in a loss of looping but not in a decrease ofβ-globinmRNA levels
[13]. In contrast the enhancer immediately 3′ of the
β-globin enhancer is apparent, but it does not appear to
interact with any distal elements. It is also clear that in mouse primary erythroid cells Ldb1 (Figure 6A) and Ctcf (Figure 6B) occupy restriction fragments that have more interactions with other positions in the locus when com-pared to mouse brain cells. In addition the median dis-tance on the linear chromosome between two fragments in spatial proximity is larger in primary erythroid cells for both Ldb1 (Figure 6C) and Ctcf (Figure 6D) binding sites. This suggests that this area of the genome is less con-densed. We conclude from these experiments that T2C indeed detects topological domains and the different inter-actions between and within domains. These interinter-actions depend on the expression status of the genes such as the activeβ-globinlocus in primary erythroid cells versus the same silent locus in fetal brain. In addition, the high level of resolution of the interactions allows novel observations such as shown for the β-globin locus Ldb1 and Ctcf bin-ding sites and immediately shows which of these binbin-ding sites interact with each other and where they are posi-tioned on the linear genome.
Discussion
The importance of the role of chromatin interactions in the regulation of the gene transcription is well estab-lished [9,39-42]. However, there is still an increasing need for a quick, easy, and affordable technique to
provide the information on chromatin interactions and the compartmentalization of the genome. T2C is afford-able to most scientific groups and will meet in a satisfac-tory manner their needs for detecting high resolution chromatin organization of selected loci. Every restriction fragment can serve as a ‘viewpoint’and all their interac-tions, either short or long or to other chromosomes (data not shown), can be identified. Thus multiple 3C-seq, 4C-seq or 5C experiments do not have to be performed. Moreover, with T2C the compartmentalization of the gen-ome can be identified in the regions of interest without re-quiring the large sequencing effort of Hi-C, which would increase the costs tremendously. Furthermore, due to the T2C design, a better coverage and resolution of the locus is obtained when compared to other genome wide tech-niques (like Hi-C and 3C with its derivatives) using a 6 bp cutter as first restriction enzyme. Here we multiplexed two samples, but by multiplexing more than two sam-ples the costs are likely to be reduced significantly without sacrificing the quality of the output. We have recently successfully used 13 samples per sequencing lane, including theβ-globin locus which showed the same interactions (data not shown).
The resolution of T2C is based on the restriction en-zyme used. Digesting cross-linked chromatin from pri-mary erythroid cells and HB2 cells with HindIII or BglII, resulted in a median resolution of 2 kbp and 4.1 kbp, re-spectively (Table 2). That provides a significantly better resolution than the usual 40 kbp bins obtained with Hi-C. Furthermore, comparing T2C with 4C-seq [14] and Hi-C
[1] for the H19/IGF2 locus (Figure 2) and with already
published 3C-qPCR data for theβ-globinlocus [16,20,35], the same topological domains and chromatin interaction networks were identified. Taken together, all these results reveal the strengths of the T2C as a tool to identify all the interactions and the compartmentalization of specific re-gions of the genome.
In addition, the T2C interactions are easily connected to the factors that play a role in these interactions or the type of elements (promoters/enhancers) involved in the inter-actions. Ldb1 and Ctcf are important proteins which mediate chromatin interactions. Ldb1 is an important
transcription factor necessary for primitive mouse
(See figure on previous page.)
Figure 4Comparison of T2C with 3C-qPCR for theβ-globinpromoter.T2C for mouse primary erythroid cells(A)and mouse fetal brain cells
A
B
C
D
E
F
G
H
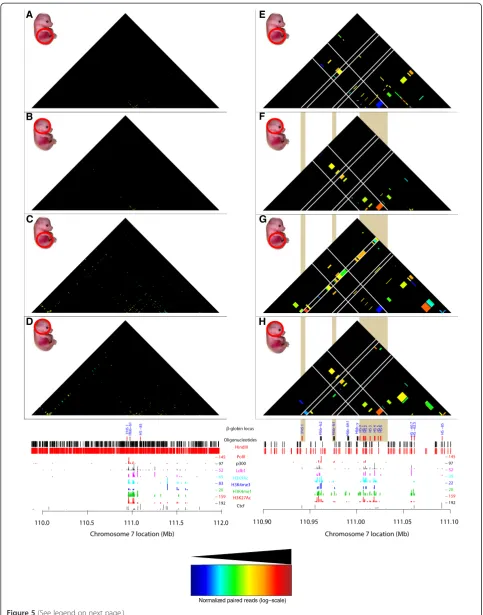
Normalized paired reads (log−scale) Figure 5(See legend on next page.)
Kolovoset al. Epigenetics & Chromatin2014,7:10 Page 11 of 17
hematopoiesis and for the development of megakaryocytes [43,44] and controls essential hematopoietic pathways in mouse early development [45]. Depletion of Ldb1 is lethal for mouse embryos after E9.5 with severe effects such as impairment of hematopoietic and vascular development [46]. It is well established that the LCR has higher
inter-action frequencies with the β-globin locus in mouse
primary erythroid cells comparing to mouse brain cells
[16,20,35] and that Ldb1 is significantly enriched in the LCR region in mouse primary erythroid cells relative to
mouse fetal brain cells [36] (Figure 5E vs. Figure 5F).
Furthermore, Ctcf is an insulator binding protein known to be involved in chromatin conformation [33] and is enriched at the boundaries of topological domains [1]. Ctcf mediates long range interactions in theβ-globinlocus [13] (Figure 5Cvs.Figure 5D and Figure 5Gvs.Figure 5H). (See figure on previous page.)
Figure 5T2C/ChIP-seq intersection plot.A comparison of the interactions containing one or two fragments with a Ldb1 or Ctcf binding site. Interactions are plotted, at restriction fragment resolution, over a 2.1 Mb region around theβ-globinlocus for Ldb1(A, B)or Ctcf(C, D)for mouse primary erythroid cells(A, C)and mouse fetal brain cells(B, D)from E12.5 mice. The topological sub-domain around theβ-globinlocus is clearly depicted in the mouse primary erythroid cells when compared to mouse brain cells. Focusing on theβ-globinlocus, T2C-intersection plots, at restriction fragment resolution, of interactions that contain a Ldb1 bound fragment(E, F)or a Ctcf bound fragment(G, H), for mouse primary erythroid cells(E, G)and mouse brain cells(F, H). White lines indicate particular areas of interest (like 3′HS1, theβ-globinpromoter and the Locus Control Region (LCR)) in theβ-globinlocus. The mouse primary erythroid cells interactions between LCR,β-globinpromoter, and 3′HS1 are lost in mouse brain cells. The shaded vertical bars indicate the comparison between the different panels. All the interactions are normalized to the same color code (see color inset). The bottom tracks show a linear representation of theβ-globinlocus, the oligonucleotides probes positions (black lines),HindIII recognition sites (red lines) and the ChIP-seq derived binding sites of PolII (red lines), Ldb1 (purple lines) [38], Ctcf (black lines), p300 (black lines), and various histone modification markers (light blue, dark blue, green, and red) [37] in mouse erythroleukemia cells.
A
C
B
D
0 20 40 60 80 100
number of Ldb1 interactions
number of Ctcf interactions
0 50 100 150 200 250
distance between Ctcf interaction partners (bp)
mean median p= 0.0599
1e+03
1e+05
1e+07
distance between Ldb1 interaction partners (bp)
p= 0.00842
5e+02
1e+04
5e+05
mean median 120
Hence, it is no surprise that for Ldb1 and Ctcf occupied restriction fragments we observe a higher number of inter-acting fragments at larger linear distances of fragments that interact in mouse primary erythroid cells than in mouse brain cells (Figure 6). This effect can be explained
by the fact that the β-globin locus is active in mouse
primary erythroid cells. Furthermore, we observe that the boundaries of the topological domain, which contains the
β-globinlocus, are easily observed in mouse erythroid cells
(Figure 3A). That is prominent when depicting only the
Ctcf interacting fragments (Figure 5C vs. Figure 5D).
Furthermore, the number of interactions within that topological domain, appear higher in the erythroid cells comparing to fetal brain cells (Figure 3A vs. Figure 3B, Figure 6A, B). We hypothesize that this is due to the
fact that the β -globin locus is active with open
chro-matin in mouse primary erythroid cells. Hence, the chromatin has a different conformation by enabling the interaction between many different elements ne-cessary for the regulation of the gene [34]. However, in mouse fetal brain cells, whereβ-globin locus is not ac-tive, that is not necessary and there are no important elements that need to spatially be in close proximity.
The method may be improved by bringing the cost fur-ther down. For example each of theβ-globinlocus experi-ments was carried out by using one sequencing lane on an Illumina HiSeq machine for each different biological sam-ple (mouse primary erythoid cells and mouse fetal brain cells). That yielded after comprehensive data analysis and 271,177 and 557,763 paired-reads within the limits of the region of interest excluding self-ligations and uncut frag-ments for both fetal brain and liver (see Methods). These reads represented 2,369 and 4,057 distinct interactions with 114 and 137 reads per interaction on average for fetal brain and liver, respectively (Table 2). The read frequency of the highest 20% of the interactions is from 11,858 to 202 in fetal liver and from 29,637 to 188 (the top 30% is from 11,858 to 123 and 29,637 to 120 for fetal liver and fetal brain, respectively). The bottom 20% account for four reads in both tissues (while 30% account for nine and 13 for fetal liver and fetal brain, respectively). The question then becomes whether one could do more samples per lane (that is, a reduction in cost per sample) which would result in fewer reads per interaction point. The decision on this depends to some extent on the research question asked. Analysis of functional interactions and/or the ‘rough’ overall structure of a locus, can be achieved by using a range between 1/2 and 1/13 of a sequencing lane which will dramatically lower the costs without losing much information.
We also considered using mechanical shearing instead of a secondary restriction enzyme. The advantage of the secondary restriction enzyme over mechanically shearing is that it is very reproducible and provides a better repair
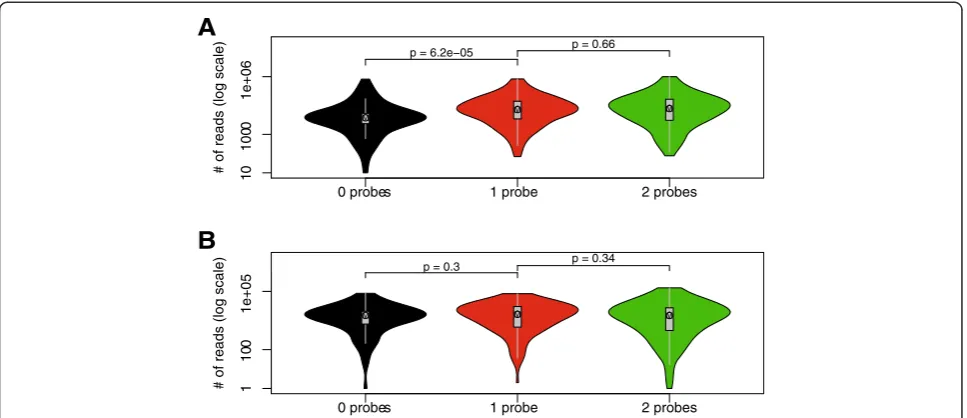
step of the ends and hence ligation of the adapters. The possible disadvantage of the second cleavage would seem to be a loss of fragment, because a number of fragments would be represented by one or no oligonucleotide. How-ever when the oligonucleotides are used in excess, as in T2C, there is virtually no statistically significant difference in detecting the reads of fragments represented by two, one, or no oligonucleotides (Figure 7). Mechanically shea-ring would have the advantage that the chance of cap-turing a fragment is improved, because some of the secondary restriction sites are too close to the primary restriction sites. However the disadvantages are that mechanically shearing is random, which will have the same possible loss addressed above, but more importantly mechanical shearing is difficult to standardize between different laboratories. Using two different sets of oligonu-cleotides in combination with two different restriction enzymes for the first or second cleavage would give the most advantage because fewer fragments would be lost and the overall resolution and coverage would be further improved.
The‘quantification’could be further improved by spiking the samples with control cells preferably from another spe-cies, to allow easy recognition of the spike when mapping the sequences back to the genome during the analysis of the ligated fragments. This would also require the addition of a spike specific set of capturing oligonucleotides. Spiking the sample with a DNA sample with a different address se-quence at the amplification and sequencing stage of the procedure would also be an improvement, although it would be less quantitative than the spiking with cells at the start of the procedure. The normalization of the signals using the capture efficiency of each of the fragments (Figure 7) also increases the ‘quantification’, although it should be noted these are all relative numbers rather than a real quantification because a number of parameters can-not be controlled or assessed properly.
Because T2C is focused on particular regions of interest, it would be easy to design a set of oligonucleotides for a number of loci that are known to be associated with a par-ticular disease and design a diagnostic kit on that basis that could handle many samples at the same time. Since SNPs are often linked to diseases, dedicated oligonucleotides for them can be designed in order to assess their effect in long range interactions and the regulation of the gene trans-cription. For non-clinical research purposes the size of the region used in our experiments is sufficient (more than 2 Mb) to extract safe conclusions about the local chro-matin interactome and the compartmentalization of the genome.
Conclusions
We conclude that T2C can be used as an affordable, cost-effective, diagnostic tool with single restriction fragment
Kolovoset al. Epigenetics & Chromatin2014,7:10 Page 13 of 17
resolution to explore the local spatial organization of the genome and chromatin interactions without requiring la-borious procedures or massive sequencing efforts.
Methods
Oligonucleotide design
A microarray for the β-globin locus was designed
con-taining unique oligonucleotides and physically as close as possible to the HindIII restriction sites spanning 2.1 Mb around the gene (chr7: 109876329-111966581, mm9). For
theH19/IGF2locus unique oligonucleotides were designed
close to BglII restriction sites (chr11:1100646-3173091, hg18) spanning an area of 2.1 Mb (Table 2).
The oligonucleotides were designed with the follow-ing criteria, they should be: (1) as close as possible to the first restriction site; (2) a unique DNA sequence within the area of interest and preferably in the entire genome; (3) similar melting temperatures, but with different base composition and the length; (4) oligo-nucleotides which exceed the second restriction site due to very small end fragments, were trimmed keeping in mind to stay close to the same melting temperature.
A custom-made NimbleGen Sequence Capture 2.1 M
capture array is produced separately for the H19/IGF2
locus and for theβ-globinlocus containing for each one the oligonucleotides which satisfy the aforementioned
criteria. The oligonucleotides, 525 for the H19/IGF2
locus and 800 for the β-globin locus, were replicated
proportionally and equally up to 2.1 M in total for each
design, that is, for the β-globin locus each of the 800 oligonucleotides was spotted in 2,625 spots.
Chromatin isolation and library preparation
Nuclei from approximately 107mouse primary erythroid
cells from mouse fetal liver E12.5, mouse fetal brain cells E12.5, and a human breast endothelial cell line (HB2) were isolated, cross-linked (in 2% formaldehyde at room tem-perature) quenched with 1 M glycine and were
re-suspended in lysis buffer (10 mM Tris–HCl (pH 8.0),
10 mM NaCl, 0.2% (vol/vol) NP-40 and 1× protease in-hibitor solution). The chromatin was digested with a 6-cutter (400 units ofHindIII for mouse cells andBglII for the HB2 cells) and ligated using 100 units of T4 DNA ligase (Promega) under conditions favoring intramolecular ligation events. After reversing the cross-link at 65°C over-night, 50μg of the resulting DNA chromatin library were digested with a frequent 4-cutter (DpnII orNlaIII for the mouse cells,NlaIII for the HB2 cells, at a DNA concentra-tion of 100 ng/μL, using 1 unit of enzyme perμg of DNA). All these steps were performed according to the initial steps of 3C-seq protocol, as described previously [23].
The final library is prepared for analysis on the Illumina Cluster Station and HiSeq 2000 Sequencer according to the Illumina TruSeq DNA protocol with modifications (www.illumina.com). In short, the digested library is puri-fied using AMPure XP beads (Beckman Coulter), end-repaired, and cleaned using AMPure XP beads. The now blunt-ended fragments were A-tailed using the Klenow exo enzyme in the presence of ATP and purified again
B
A
# of reads (log scale)
0 probes 1 probe 2 probes
1
0
100
0
1e+06
p = 6.2e−05 p = 0.66
# of reads (log scale)
0 probes 1 probe 2 probes
1
1
0
0
1e+05
p = 0.3 p = 0.34
using AMPure XP beads. Then indexed adapters provided by Illumina were ligated to the A-tailed DNA fragments with subsequent purification using AMPure XP beads.
Array capturing
The resulting adapter-modified DNA library (300 to
500 ng) was hybridized in 35 μL for 64 h at 42°C on
a custom-made NimbleGen Sequence Capture 2.1 M capture array according to NimbleGen Sequence Cap-ture array protocol (www.nimblegen.com/seqcapez) on the NimbleGen Hybridization System. The captured DNA fragments are eluted from the capture array and purified using MinElute columns (Qiagen). The yield for a positive region (a fragment inside the region of interest) and a negative region (a fragment outside the region of interest) differ by >30-fold on average. The captured DNA fragments are amplified by 12 PCR cycles. PCR products
are purified using AMPure XP beads and eluted in 30μL
of re-suspension buffer. One microliter is loaded on an Agilent Technologies 2100 Bioanalyzer using a DNA 1000 assay to determine the library concentration and to check for quality.
Cluster generation and high throughput sequencing Cluster generation is performed according to the Illumina Cluster Reagents preparation protocol (www.illumina. com). Briefly, 1μL of a 10 nM TruSeq DNA library stock DNA is denatured with NaOH, diluted to 9-10 pM and hybridized onto the flowcell. The hybridized fragments are sequentially amplified, linearized, and end-blocked ac-cording to the Illumina Paired-end Sequencing user guide protocol. After hybridization of the sequencing primer, se-quencing by synthesis is performed using the HiSeq 2000 sequencer with a 101 cycle protocol according to
manu-facturer’s instructions. The sequenced fragments were
denatured with NaOH using the HiSeq 2000 and the index-primer was hybridized onto the fragments. The index was sequenced with a seven-cycle protocol. The frag-ments are denatured with NaOH, sequentially amplified, linearized, and end-blocked. After hybridization of the se-quencing primer, sese-quencing by synthesis of the third read is performed using the HiSeq 2000 sequencer with a 101-cycle protocol.
Targeted Chromatin Capture data analysis
The generated HiSeq 2000 sequencing reads were trimmed if the reads contained the first enzyme restriction recognition site (HindIII for the mouse derived reads and BglII for the human derived reads) For each read with one or more enzyme recognition sites, the DNA sequence after the 3′end of the first site was removed, that is, after the trimming procedure the trimmed reads contained and ended with a single restriction recognition site. Subse-quently, consecutive bases with a quality score lower than
10 were cut off from the ends of all the reads and the reads that contained less than 12 bases were omitted using Trim-momatic [47]. We used the Burrows-Wheeler Alignment tool (BWA, version 0.6.1) to the whole genome NCBI36/ hg18 assembly for the human derived reads and to NCBI37/mm9 assembly for the mouse derived reads, using default settings [48]. Aligned reads that localized between two second enzyme recognition sites that did not contain a first enzyme recognition site, that is, all NlaIII-NlaIII re-striction fragments were removed using BEDtools [49].
In the alignment, paired reads were removed if one of the reads was not uniquely mapped. Furthermore, paired reads that were a result of a self-ligation event, non-digestion/re-ligation event, or a ligation of identical ends were removed from the analysis, since these paired reads introduce a common bias in chromosome conformation capture techniques [50,51]. The alignments were further processed with SAMtools [48] to generate paired-end Bin-ary Alignment/Map (BAM) files. BEDtools [49] was used to remove reads that overlapped more than one restriction fragment. Interaction matrices were generated from the alignments at a resolution of the restriction fragments and at 40 kb resolution (using BEDtools on a 40 kbp binned genome). In addition, the human T2C 40 kb binned data were compared to IMR90 40 kb Hi-C data of the com-bined replicates [1]. The T2C interaction plots were nor-malized for capture efficiency of the fragments. For each interaction the number reads of each interaction was nor-malized through dividing it by the sum of the reads of both fragments involved in the interaction. Similarly, the T2C plots of the 40 kb bins were normalized after all the fragments were divided into 40 kb bins along each chro-mosome. ChIP-seq and T2C interaction-intersection plots were generated from normalized T2C interaction plots and intersected with fragments that contained a ChIP-seq peak signal of the protein of interest. The statistical software package R (version 3.1.0) was used to generate the interaction plots and to conduct the statistical cal-culations [52].
ChIP-seq analysis
Published ChIP-seq datasets [37,38] were obtained and an-alyzed. MACS [53] was used to identify peaks (fdr≤0.01, peak height≥20 overlapping reads) to intersect their posi-tions with the interacting fragments obtained from T2C.
Competing interests
The authors declare that they have no competing interest.
Authors’contributions
PK, KSW, TAK, and FG designed the experiments. PK, JZ, and KSW carried out the experiments. HJGvdW performed the bioinformatics analysis. NK and RWWB conducted the initial steps of bioinformatics analysis. CEMK and WFJvI carried out the Illumina sequencing. PK, HJGvdW and FG wrote the manuscript. All authors read and approved the final manuscript.
Kolovoset al. Epigenetics & Chromatin2014,7:10 Page 15 of 17
Acknowledgments
We thank the members of the FG Laboratory, Argyris Papantonis, Robert-Jan Palstra, and Danny Huylebroeck for discussions and reading the manuscript. PK was supported by grants from EpiGenSys/ERASysBio +/FP7 (NL: NWO, UK: BSRC, D: BMBF). JZ was supported by an NWO ALW grant and KSW by E-RARE/TARGET-CdLS (NL: ZonMW). NK and the grid infrastructure were supported by the BMBF (grant #01AK803A (German MediGRID), and #01IG07015G (Services@MediGRID). HJGvdW was supported by Zenith (93511036) grant from the Netherlands Genomics Initiative (NGI). The work was supported by EpiGenSys/ERASysBio +/FP7 (NL: NWO, UK: BSRC, D: BMBF), the Bluescript EU Integrated Project, the Netherlands Institute for Regenerative Medicine (NIRM), the MEC Booster grant by the Netherlands Genomics Institute (MEC Booster grant) and the KNAW (professorship to FG).
Accession number
The accession number is SRP042002.
Author details
1Department of Cell Biology, Erasmus MC, Dr. Molewaterplein 50, 3015GE Rotterdam, The Netherlands.2Deutsches Krebsforschungszentrum (DKFZ) & BioQuant, Im Neuenheimer Feld 280, Heidelberg 69120, Germany.3Center for Biomics, Erasmus MC, Dr. Molewaterplein 50, 3015GE Rotterdam, The Netherlands.
Received: 28 April 2014 Accepted: 28 May 2014 Published: 16 June 2014
References
1. Dixon JR, Selvaraj S, Yue F, Kim A, Li Y, Shen Y, Hu M, Liu JS, Ren B:
Topological domains in mammalian genomes identified by analysis of chromatin interactions.Nature2012,485:376–380.
2. Cremer T, Cremer C:Chromosome territories, nuclear architecture and gene regulation in mammalian cells.Nat Rev Genet2001,2:292–301. 3. Dillon N, Trimborn T, Strouboulis J, Fraser P, Grosveld F:The effect of
distance on long-range chromatin interactions.Mol Cell1997,1:131–139. 4. Mueller-Storm HP, Sogo JM, Schaffner W:An enhancer stimulates
transcription in trans when attached to the promoter via a protein bridge.Cell1989,58:767–777.
5. Jhunjhunwala S, van Zelm MC, Peak MM, Cutchin S, Riblet R, van Dongen JJ, Grosveld FG, Knoch TA, Murre C:The 3D structure of the
immunoglobulin heavy-chain locus: implications for long-range genomic interactions.Cell2008,133:265–279.
6. Medvedovic J, Ebert A, Tagoh H, Tamir IM, Schwickert TA, Novatchkova M, Sun Q, Veld PJHI’t, Guo C, Yoon HS, Denizot Y, Holwerda SJ, de Laat W, Cogne M, Alt FW, Busslinger M:Flexible long-range loops in the VH gene region of the Igh locus facilitate the generation of a diverse antibody repertoire.Immunity2013,39:229–244.
7. Bulger M, Groudine M:Functional and mechanistic diversity of distal transcription enhancers.Cell2011,144:327–339.
8. Maeda RK, Karch F:Gene expression in time and space: additive vs hierarchical organization of cis-regulatory regions.Curr Opin Genet Dev 2011,21:187–193.
9. Kolovos P, Knoch TA, Grosveld FG, Cook PR, Papantonis A:Enhancers and silencers: an integrated and simple model for their function.Epigenetics Chromatin2012,5:1.
10. Maas SA, Fallon JF:Single base pair change in the long-range Sonic hedgehog limb-specific enhancer is a genetic basis for preaxial polydactyly.Dev Dyn2005,232:345–348.
11. Lin YC, Murre C:Nuclear location and the control of developmental progression.Curr Opin Genet Dev2013,23:104–108.
12. Splinter E, de Wit E, Nora EP, Klous P, van de Werken HJ, Zhu Y, Kaaij LJ, van Ijcken W, Gribnau J, Heard E, de Laat W:The inactive X chromosome adopts a unique three-dimensional conformation that is dependent on Xist RNA.Genes Dev2011,25:1371–1383.
13. Splinter E, Heath H, Kooren J, Palstra RJ, Klous P, Grosveld F, Galjart N, de Laat W:
CTCF mediates long-range chromatin looping and local histone modification in the beta-globin locus.Genes Dev2006,20:2349–2354.
14. Zuin J, Dixon JR, van der Reijden MI, Ye Z, Kolovos P, Brouwer RW, van de Corput MP, van de Werken HJ, Knoch TA, van Ijcken WF, Grosveld FG, Ren B, Wendt KS:Cohesin and CTCF differentially affect chromatin
architecture and gene expression in human cells.Proc Natl Acad Sci U S A 2014,111:996–1001.
15. Deng W, Lee J, Wang H, Miller J, Reik A, Gregory PD, Dean A, Blobel GA:
Controlling long-range genomic interactions at a native locus by targeted tethering of a looping factor.Cell2012,149:1233–1244.
16. Drissen R, Palstra RJ, Gillemans N, Splinter E, Grosveld F, Philipsen S, de Laat W:
The active spatial organization of the beta-globin locus requires the transcription factor EKLF.Genes Dev2004,18:2485–2490.
17. Hou C, Dale R, Dean A:Cell type specificity of chromatin organization mediated by CTCF and cohesin.Proc Natl Acad Sci U S A2010,
107:3651–3656.
18. Lin YC, Benner C, Mansson R, Heinz S, Miyazaki K, Miyazaki M, Chandra V, Bossen C, Glass CK, Murre C:Global changes in the nuclear positioning of genes and intra- and interdomain genomic interactions that orchestrate B cell fate.Nat Immunol2012,13:1196–1204.
19. Dekker J, Rippe K, Dekker M, Kleckner N:Capturing chromosome conformation.Science2002,295:1306–1311.
20. Tolhuis B, Palstra RJ, Splinter E, Grosveld F, de Laat W:Looping and interaction between hypersensitive sites in the active beta-globin locus.
Mol Cell2002,10:1453–1465.
21. Hagege H, Klous P, Braem C, Splinter E, Dekker J, Cathala G, de Laat W, Forne T:Quantitative analysis of chromosome conformation capture assays (3C-qPCR).Nat Protoc2007,2:1722–1733.
22. Naumova N, Smith EM, Zhan Y, Dekker J:Analysis of long-range chromatin interactions using Chromosome Conformation Capture.Methods2012,
58:192–203.
23. Stadhouders R, Kolovos P, Brouwer R, Zuin J, van den Heuvel A, Kockx C, Palstra RJ, Wendt KS, Grosveld F, van Ijcken W, Soler E:Multiplexed chromosome conformation capture sequencing for rapid genome-scale high-resolution detection of long-range chromatin interactions.Nat Protoc2013,8:509–524.
24. van de Werken HJ, Landan G, Holwerda SJ, Hoichman M, Klous P, Chachik R, Splinter E, Valdes-Quezada C, Oz Y, Bouwman BA, Verstegen MJ, de Wit E, Tanay A, de Laat W:Robust 4C-seq data analysis to screen for regulatory DNA interactions.Nat Methods2012,9:969–972.
25. Simonis M, Klous P, Splinter E, Moshkin Y, Willemsen R, de Wit E, van Steensel B, de Laat W:Nuclear organization of active and inactive chromatin domains uncovered by chromosome conformation capture-on-chip (4C).Nat Genet2006,38:1348–1354.
26. Sexton T, Kurukuti S, Mitchell JA, Umlauf D, Nagano T, Fraser P:Sensitive detection of chromatin coassociations using enhanced chromosome conformation capture on chip.Nat Protoc2012,7:1335–1350. 27. Gondor A, Rougier C, Ohlsson R:High-resolution circular chromosome
conformation capture assay.Nat Protoc2008,3:303–313.
28. Fullwood MJ, Liu MH, Pan YF, Liu J, Xu H, Mohamed YB, Orlov YL, Velkov S, Ho A, Mei PH, Chew EG, Huang PY, Welboren WJ, Han Y, Ooi HS, Ariyaratne PN, Vega VB, Luo Y, Tan PY, Choy PY, Wansa KD, Zhao B, Lim KS, Leow SC, Yow JS, Joseph R, Li H, Desai KV, Thomsen JS, Lee YK:An oestrogen-receptor-alpha-bound human chromatin interactome.Nature2009,
462:58–64.
29. Dostie J, Dekker J:Mapping networks of physical interactions between genomic elements using 5C technology.Nat Protoc2007,2:988–1002. 30. Lieberman-Aiden E, van Berkum NL, Williams L, Imakaev M, Ragoczy T, Telling A,
Amit I, Lajoie BR, Sabo PJ, Dorschner MO, Sandstrom R, Bernstein B, Bender MA, Groudine M, Gnirke A, Stamatoyannapoulos J, Mirny LA, Lander ES, Dekker J:
Comprehensive mapping of long-range interactions reveals folding principles of the human genome.Science2009,326:289–293.
31. Dostie J, Richmond TA, Arnaout RA, Selzer RR, Lee WL, Honan TA, Rubio ED, Krumm A, Lamb J, Nusbaum C, Green RD, Dekker J:Chromosome Conformation Capture Carbon Copy (5C): a massively parallel solution for mapping interactions between genomic elements.Genome Res2006,
16:1299–1309.
32. Jin F, Li Y, Dixon JR, Selvaraj S, Ye Z, Lee AY, Yen CA, Schmitt AD, Espinoza CA, Ren B:A high-resolution map of the three-dimensional chromatin interactome in human cells.Nature2013,503:290–294.
33. Nativio R, Wendt KS, Ito Y, Huddleston JE, Uribe-Lewis S, Woodfine K, Krueger C, Reik W, Peters JM, Murrell A:Cohesin is required for higher-order chromatin conformation at the imprinted IGF2-H19 locus.
PLoS Genet2009,5:e1000739.
folding dynamics of the beta-globin locus upon gene activation.J Cell Sci 2012,125:4630–4639.
35. Palstra RJ, Tolhuis B, Splinter E, Nijmeijer R, Grosveld F, de Laat W:The beta-globin nuclear compartment in development and erythroid differentiation.
Nat Genet2003,35:190–194.
36. Song SH, Hou C, Dean A:A positive role for NLI/Ldb1 in long-range beta-globin locus control region function.Mol Cell2007,28:810–822. 37. ENCODE Project Consortium, Bernstein BE, Birney E, Dunham I, Green ED,
Gunter C, Snyder M:An integrated encyclopedia of DNA elements in the human genome.Nature2012,489:57–74.
38. Soler E, Andrieu-Soler C, de Boer E, Bryne JC, Thongjuea S, Stadhouders R, Palstra RJ, Stevens M, Kockx C, van Ijcken W, Hou J, Steinhoff C, Rijkers E, Lenhard B, Grosveld F:The genome-wide dynamics of the binding of Ldb1 complexes during erythroid differentiation.Genes Dev2010,
24:277–289.
39. Fraser P, Bickmore W:Nuclear organization of the genome and the potential for gene regulation.Nature2007,447:413–417. 40. Misteli T:Beyond the sequence: cellular organization of genome
function.Cell2007,128:787–800.
41. Simonis M, Klous P, Homminga I, Galjaard RJ, Rijkers EJ, Grosveld F, Meijerink JP, de Laat W:High-resolution identification of balanced and complex chromosomal rearrangements by 4C technology.Nat Methods2009,
6:837–842.
42. Stadhouders R, van den Heuvel A, Kolovos P, Jorna R, Leslie K, Grosveld F, Soler E:Transcription regulation by distal enhancers: who’s in the loop?
Transcription2012,3:181–186.
43. Li L, Lee JY, Gross J, Song SH, Dean A, Love PE:A requirement for Lim domain binding protein 1 in erythropoiesis.J Exp Med2010,207:2543–2550. 44. Li L, Jothi R, Cui K, Lee JY, Cohen T, Gorivodsky M, Tzchori I, Zhao Y, Hayes
SM, Bresnick EH, Zhao K, Westphal H, Love PE:Nuclear adaptor Ldb1 regulates a transcriptional program essential for the maintenance of hematopoietic stem cells.Nat Immunol2011,12:129–136.
45. Mylona A, Andrieu-Soler C, Thongjuea S, Martella A, Soler E, Jorna R, Hou J, Kockx C, van Ijcken W, Lenhard B, Grosveld F:Genome-wide analysis shows that Ldb1 controls essential hematopoietic genes/pathways in mouse early development and reveals novel players in hematopoiesis.Blood 2013,121:2902–2913.
46. Mukhopadhyay M, Teufel A, Yamashita T, Agulnick AD, Chen L, Downs KM, Schindler A, Grinberg A, Huang SP, Dorward D, Westphal H:Functional ablation of the mouse Ldb1 gene results in severe patterning defects during gastrulation.Development2003,130:495–505.
47. Bolger AM, Lohse M, Usadel B:Trimmomatic: a flexible trimmer for Illumina sequence data.Bioinformatics2014, [Epub ahead of print]. 48. Li H, Durbin R:Fast and accurate short read alignment with
Burrows-Wheeler transform.Bioinformatics2009,25:1754–1760.
49. Quinlan AR, Hall IM:BEDTools: a flexible suite of utilities for comparing genomic features.Bioinformatics2010,26:841–842.
50. Nagano T, Lubling Y, Stevens TJ, Schoenfelder S, Yaffe E, Dean W, Laue ED, Tanay A, Fraser P:Single-cell Hi-C reveals cell-to-cell variability in chromosome structure.Nature2013,502:59–64.
51. van de Werken HJ, de Vree PJ, Splinter E, Holwerda SJ, Klous P, de Wit E, de Laat W:4C technology: protocols and data analysis.Methods Enzymol 2012,513:89–112.
52. R-Core-Team:R: A language and environment for statistical computing.Vienna, Austria: R Foundation for Statistical Computing; 2013 [http://www.r-project.org/] 53. Zhang Y, Liu T, Meyer CA, Eeckhoute J, Johnson DS, Bernstein BE, Nusbaum C, Myers RM, Brown M, Li W, Liu XS:Model-based analysis of ChIP-Seq (MACS).
Genome Biol2008,9:R137.
doi:10.1186/1756-8935-7-10
Cite this article as:Kolovoset al.:Targeted Chromatin Capture (T2C): a novel high resolution high throughput method to detect genomic interactions and regulatory elements.Epigenetics & Chromatin20147:10.
Submit your next manuscript to BioMed Central and take full advantage of:
• Convenient online submission
• Thorough peer review
• No space constraints or color figure charges
• Immediate publication on acceptance
• Inclusion in PubMed, CAS, Scopus and Google Scholar
• Research which is freely available for redistribution
Submit your manuscript at www.biomedcentral.com/submit
Kolovoset al. Epigenetics & Chromatin2014,7:10 Page 17 of 17
![Table 1 Comparison between different chromatin conformation capturing techniques (adopted and modifiedfrom [23])](https://thumb-us.123doks.com/thumbv2/123dok_us/690666.2067193/2.595.56.540.516.733/comparison-different-chromatin-conformation-capturing-techniques-adopted-modifiedfrom.webp)

![Figure 3 Comparison of the compartmentalization and interactions for therecognition sites (red lines) and the ChIP-seq derived binding sites of PolII (red lines), Ldb1 (purple lines) [38], Ctcf (black lines), p300 (black lines), β-globin locus](https://thumb-us.123doks.com/thumbv2/123dok_us/690666.2067193/8.595.57.540.87.519/figure-comparison-compartmentalization-interactions-therecognition-derived-binding-purple.webp)