ORIGINAL ARTICLE
Prognostic value of programmed
death-1, programmed death-ligand 1,
programmed death-ligand 2 expression,
and CD8(
+
) T cell density in primary tumors
and metastatic lymph nodes from patients
with stage T1-4N
+
M0 gastric adenocarcinoma
Yuan Gao
1,2†, Su Li
1,2†, Dazhi Xu
1,3†, Shangxiang Chen
1,3, Yuchen Cai
1,4, Wenqi Jiang
1,4, Xinke Zhang
1,5, Jin Sun
1,2,
Kefeng Wang
1,4, Boyang Chang
1,6, Fenghua Wang
1,4*and Minghuang Hong
1,2*Abstract
Background: Anti-programmed death-1/programmed death-ligand 1 (PD-1/PD-L1) immunotherapy has been
proved to be effective on gastric cancer in ongoing clinical trials. However, the value of PD-L1 in predicting responses of patients with gastric cancer to anti-PD-1/PD-L1 immunotherapy is controversial. Some studies suggested that intra- and inter-tumoral heterogeneity of PD-L1 expression might explain the controversy. This study aimed to analyze
the expression of PD-L1, PD-L2, and PD-1 as well as CD8(+) T-cell density in primary tumors and lymph nodes from
patients with stage T1-4N+M0 gastric adenocarcinoma to explore the heterogeneity of PD-1 signaling pathway
molecules.
Methods: In primary tumors and metastatic as well as non-metastatic lymph nodes from patients with stage
T1-4N+M0 gastric adenocarcinoma, we detected PD-L1 and PD-L2 expression with immunohistochemistry. CD8(+)
T-cell density in primary tumors and PD-1 expression on CD8(+) T cells were detected with immunofluorescence.
Uni-variate analysis was used to determine the prognostic values of them. Cox proportional hazard regression model was used to identify independent risk factors that affect patients’ overall survival and disease-free survival.
Results: Among 119 eligible patients who had undergone surgical resection, the positive rate of PD-L1 was higher
in metastatic lymph nodes than in primary tumors (45.4% vs. 38.7%, P= 0.005); the positive rate of PD-1 on CD8(+)
T cells was significantly higher in primary tumors and metastatic lymph nodes than in tumor-free lymph nodes (both
P < 0.001). The intensity of PD-1 expression on CD8(+) T cells in primary tumors and in metastatic lymph nodes were
stronger than that in tumor-free lymph nodes from the same patient. Beside, the positive rate of PD-L2 did not show any differences between primary tumors and metastatic lymph nodes. In multivariate analysis, PD-L1 expression,
PD-L2 expression, a low density of CD8(+) T cells in primary tumors, and PD-1 expression on CD8(+) T cells in primary
tumors were associated with poor prognosis.
© The Author(s) 2017. This article is distributed under the terms of the Creative Commons Attribution 4.0 International License (http://creativecommons.org/licenses/by/4.0/), which permits unrestricted use, distribution, and reproduction in any medium, provided you give appropriate credit to the original author(s) and the source, provide a link to the Creative Commons license, and indicate if changes were made. The Creative Commons Public Domain Dedication waiver (http://creativecommons.org/ publicdomain/zero/1.0/) applies to the data made available in this article, unless otherwise stated.
Open Access
*Correspondence: [email protected]; [email protected] †Yuan Gao, Su Li and Dazhi Xu contributed equally to this work 1 Sun Yat-sen University Cancer Center; State Key Laboratory of Oncology in South China; Collaborative Innovation Center for Cancer Medicine, Guangzhou 510060, Guangdong, P. R. China
Background
The programmed cell death-1 (PD-1)/programmed cell death-ligand 1 (PD-L1) pathway is important in the negative regulation of cell-mediated immune responses. Immunotherapy targeting the PD-1/PD-L1 axis has great promise in treating many types of cancer and was a breakthrough in cancer treatment. Exploring a molecu-lar biomarker to predict clinical response to anti-PD-1/ PD-L1 immunotherapy is thus critically important. How-ever, there is no validated predictive biomarker that can identify patients who would likely respond to anti-PD-1/ PD-L1 immunotherapy.
Immune checkpoint molecule PD-1 is expressed by various immune cells, including tumor-infiltrating CD8(+) T cells and CD4(+) T cells, and is activated by its ligands (either PD-L1 or PD-L2). PD-L1 and PD-L2 are expressed by antigen-presenting cells and cancer cells. PD-L1 expression has been detected in cancers of the skin [1], lung [2], breast [3], kidney [4], bladder [5], esophagus [6], stomach [7], head and neck [8], among others. PD-L1 expression, assessed with immunohisto-chemistry, is currently used in clinical trials as one poten-tial biomarker to predict patients’ poor prognosis.
Some clinical trials have found that patients with PD-L1-positive tumors had higher rates of response to anti-1/L1 immunotherapy than patients with PD-L1-negative tumors [9–12], and others have found that patients with PD-L1-negative tumors also benefited from anti-PD-1/PD-L1 immunotherapy and that their objec-tive response rate (ORR) was similar to that of patients with PD-L1-positive tumors [13, 14]. Questions arise when using immunohistochemical examination of PD-L1 expression as a companion diagnostic assay for anti-PD-1/PD-L1 immunotherapy. For example, how to deter-mine the threshold that defines positive PD-L1 labeling; what impact the intra- and inter-tumoral heterogeneity of PD-L1 expression might take to the diagnostic assay; how to choose tissue compartment and immune cell pop-ulation for detection of PD-L1 expression.
Gastric cancer (GC) is the fifth most common can-cer globally, with a high incidence in East Asia, espe-cially China [15–17]. Gastric adenocarcinoma is the most common type of GC. Many clinical, molecular, and pathologic data suggest that gastric adenocarcinoma is a
heterogeneous disease [18]. Some studies have associated PD-L1 expression with the prognosis of gastric adenocar-cinoma [7, 19, 20], although so far, research has focused only on primary tumors. Whether PD-L1 expression in gastric adenocarcinoma differs between primary tumors and metastatic sites is unknown. Moreover, several recent studies of anti-PD-1/PD-L1 antibodies in gastric adeno-carcinoma have reported a relatively strong relationship between PD-L1 expression and the rate of response to anti-PD-1/PD-L1 immunotherapy [21–23], which makes it important to identify the exact expression condition of PD-L1 in patients with gastric adenocarcinoma.
We retrospectively detected the expression patterns of PD-L1 and PD-L2 in primary tumors and metastatic lymph nodes, the density of CD8(+) T cells in primary tumors, and the expression of PD-1 on CD8(+) T cells from patients with gastric adenocarcinoma, and deter-mined their associations with clinicopathologic features and patient survival. To make sure the pathologic speci-mens of the primary tumor, metastatic lymph nodes, and tumor-free lymph nodes were available for every indi-vidual patient, we chose patients with stage T1-4N+M0 gastric adenocarcinoma.
Patients and methods Patients
Patients with gastric adenocarcinoma who had under-gone radical resection in Sun Yat-sen University Cancer Center (SYSUCC, Guangzhou, China) between January 2008 and December 2012 were selected in the study ret-rospectively. The inclusion criteria were as follows: (1) a diagnosis of gastric adenocarcinoma was confirmed by pathologic analysis; (2) the disease was classified as path-ologic T1-4N+M0 cancer according to the 2010 Ameri-can Joint Commission on Cancer TNM Staging Manual; (3) pathologic specimens were available for the primary tumor, metastatic lymph nodes, and tumor-free lymph nodes; (4) patients had completed at least 4 courses of adjuvant chemotherapy as documented in the medical record; and (5) complete follow-up data were available.
Tissue slides were constructed with materials collected from the Tissue Bank of SYSUCC, and this institution is allowed to perform translational research in compliance with ethical standards and patient confidentiality.
Conclusion: The expression of PD-L1 is heterogeneous in primary tumors and in metastatic lymph nodes from
patients with stage T1-4N+M0 gastric adenocarcinoma, which might explain the inconsistent results in assessing the
prognostic value of PD-L1 expression in previous studies.
Keywords: Gastric cancer, Programmed cell death-ligand 1, Programmed cell death-ligand 2,
We had obtained consent from all patients to report their individual data. We also had obtained the approval from the Ethical Committee and Institutional Review Board of SYSUCC to conduct the present study.
Immunohistochemistry
PD-L1 and PD-L2 expression was detected with immu-nohistochemistry in both primary tumors and meta-static lymph nodes. All lymph nodes were examined by pathologists after surgeries, and those with cancer cell invasion were conformed as metastatic lymph nodes. All metastatic lymph nodes were numbered and paraf-fin-embedded. Pathologists chose the metastatic lymph nodes with less necrosis for future detection. Formalin-fixed, paraffin-embedded tissue slides of 3-μm thickness were dewaxed in xylene and rehydrated through graded alcohol. To block endogenous peroxidase, the tissue slides were put in 3% H2O2 for 15 min. Tissue slides were then heated at 100 °C for 25 min in a microwave oven in EDTA (pH 8.0) (ThermoFisher Scientific, Waltham, MA, USA) for antigen retrieval. After cooling to room temper-ature, slides were incubated with 5% goat serum (Ther-moFisher Scientific) for 60 min to prevent non-specific binding. Then, the slides were incubated with the pri-mary antibodies of PD-L1 (E1L3N, 1:100, Cell Signaling Technology, Danvers, MA, USA) and PD-L2 (MAB1224, 1:200, R&D, Minneapolis, MN, USA) overnight at 4 °C. Afterward, the tissue slides were incubated with a goat anti-rabbit secondary antibody (Maixin Biotech, Fuzhou, Fujian, China) for 30 min. Then, 3,3-diaminobenzidine was used for color developing, and hematoxylin for nucleus counterstaining.
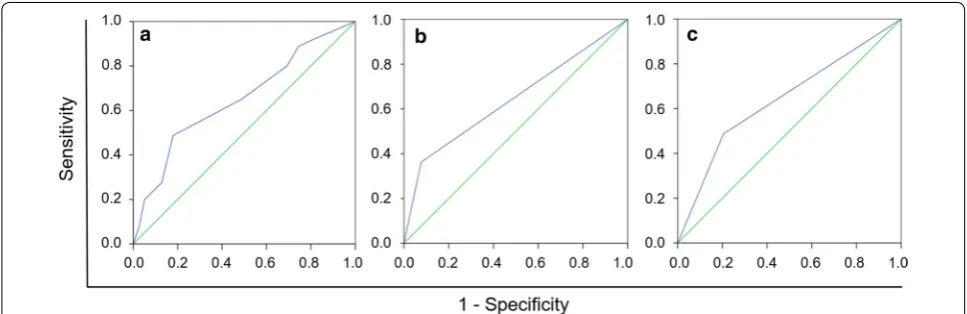
The expression of PD-L1 and PD-L2 was scored by two pathologists, both blinded to patients’ information. They selected five high-power fields per slide as repre-sentatives of the tumor, without known bias, and counted cancer cells with positive staining in these fields. The staining intensity was scored as follows: 0 for no stain-ing, 1 for weak stainstain-ing, 2 for moderate stainstain-ing, and 3 for strong staining. The percentage of cancer cells with positive staining was scored as follows: 0%–5% posi-tive staining was scored 0, 6%–25% scored 1, 26%–50% scored 2, 51%–75% scored 3, and 76%–100% scored 4 [19]. The final PD-L1 and PD-L2 expression score was calculated by multiplying the staining intensity score by the percentage score, the product of which ranged from 0 to 12. A receiver operating characteristic (ROC) curve and Youden Index (Youden Index = sensitivity + speci-ficity − 1) were used to determine the optimal cut-off score of PD-L1 and PD-L2 expression. Specimens with an expression score higher than the cut-off were classified as positive; those equal to or lower than the cut-off were classified as negative.
Immunofluorescence
The density of CD8(+) T cells in primary tumors and the
expression of PD-1 on CD8(+) T cells in primary tumors,
metastatic lymph nodes, and tumor-free lymph nodes were detected with immunofluorescence. The paraffin-embedded tissue slides were dewaxed and rehydrated, and antigen retrieval and non-specific binding preven-tion were performed as described in the previous subsec-tion. The tissue slides were incubated with the primary antibody of CD8 (ab93278, 1:200, Abcam, Cambridge, Cambridgeshire, UK) and PD-1 (ab52587, 1:200, Abcam) overnight at 4 °C. The secondary antibodies (Alexa Fluor 488 goat anti-rabbit IgG [H + L] and Alexa Fluor 555 goat anti-mouse IgG [H + L], Life Technologies, Los Angeles, CA, USA) were used to bind the primary antibodies for 60 min at room temperature. After counterstaining with 4′,6-diamidino-2-phenylindole (DAPI) (P36931, Life technologies) for 5 min, the slides were observed under a confocal laser scanning microscope (OLYMPUS FV1000, OLYMPUS, Tokyo, Japan).
The density of CD8(+) T cells in primary tumors was scored as follows: 0 for no CD8(+) T-cell infiltration, 1 for focal infiltration with mostly perivascular distribution in tumor, 2 for moderate infiltration with prominent dis-tribution among tumor cells, and 3 for severe infiltration with diffused distribution in tumor [24]. Scores of 2 and 3 were considered to indicate a high density of CD8(+)
T cells infiltrating the tumor, whereas scores of 0 and 1 indicated a low density.
PD-1 expression on CD8(+) T cells was evaluated with fluorescence intensity as well as the percentage of CD8(+) T cells with positive PD-1 staining. The fluores-cence intensity was scored from 0 to 3 for none, weak, moderate, and strong staining, respectively. The percent-age of positive CD8(+) T cells was scored from 0 to 4 for
0%–5%, 6%–25%, 26%–50%, 50%–75%, and 76%–100% positive staining, respectively. The product of the two scores determined the final score of PD-1 expression, which ranged from 0 to 12. ROC and Youden Index were also used for PD-1 expression classification.
Follow‑up
The follow-up information was obtained from the Department of Follow-up at SYSUCC. The patients were followed via telephone every month. The final date of fol-low-up was June 30th, 2016.
Statistical analysis
The associations between PD-L1 and PD-L2 expres-sion in primary tumors and metastatic lymph nodes, the density of CD8(+) T cells in primary tumors, and PD-1
expression on CD8(+) T cells and clinicopathologic
between PD-L1, PD-L2, PD-1 expression and CD8(+) T-cell density were analyzed with the Kendall’s tau-b test. Overall survival (OS) was calculated from the date of diagnosis to the date of death. Disease-free survival was calculated from the date of diagnosis to the date of relapse. OS and DFS were analyzed with Kaplan–Meier curves. Patients alive at the end of the study were cen-sored at the last follow-up. Variables with P values less than 0.05 in the univariate analysis were included in the Cox proportional hazards regression model for multi-variate analysis.
All data were analyzed with the IBM SPSS Statistics 21 software (SPSS Inc., Chicago, IL, USA). Alpha was set at 0.05, and all tests were two-tailed.
Results
Patients’ characteristics
A total of 119 patients were eligible, with a median age of 55 years (range 25–66 years). The median number of courses of adjuvant chemotherapy was 6 (range 4–12). 85 patients were treated with the capecitabine–oxalipl-atin or the leucovorin–fluorouraci–oxaliplcapecitabine–oxalipl-atin regimen. The median follow-up was 28.0 months (range 4.5– 92.0 months). As of the last follow-up visit, the cancer had progressed in 86 patients and was the cause of death in 80 patients.
Cut‑off score determination
The areas under the ROC curves of PD-L1, PD-L2, and PD-1 expression were 0.652 [95% confidence interval (CI) 0.550–0.754, P = 0.007], 0.671 (95% CI 0.571–0.771, P = 0.003), and 0.627 (95% CI 0.527–0.726, P = 0.025), respectively (Fig. 1). A PD-L1 expression score of 4 maximized the Youden Index 0.163 as the optimal cut-off score. A PD-L2 expression score of 6 maximized the
Youden Index 0.259 as the optimal cut-off score. A PD-1 expression score of 4 maximized the Youden Index 0.203 as the optimal cut-off score.
PD‑L1 expression
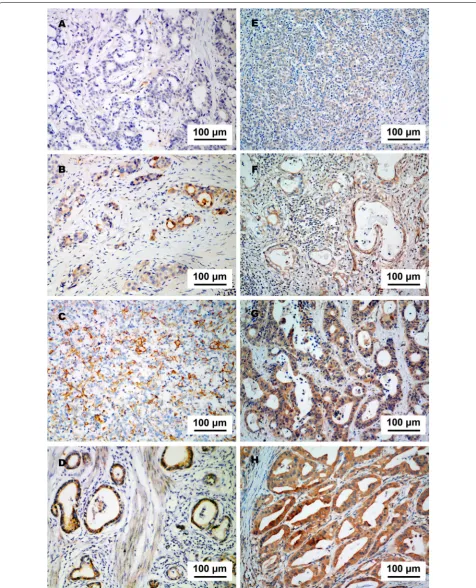
PD-L1 was expressed predominantly in the cytoplasm and on the membrane of tumor cells (Fig. 2a–d). The positive rates of PD-L1 in both primary tumors and met-astatic lymph nodes were significantly associated with Lauren classification and vascular invasion (all P < 0.05; Table 1). PD-L1 expression was inconsistent in pri-mary tumors and metastatic lymph nodes in individual patients (Fig. 3). The positive rate of PD-L1 was signifi-cantly higher in metastatic lymph nodes than in primary tumors (45.4% vs. 38.7%, P = 0.005).
PD‑L2 expression
PD-L2 was also expressed predominantly in the cyto-plasm and on the membrane of tumor cells (Fig. 2e–h). The positive rates of PD-L2 in both primary tumors and metastatic lymph nodes were associated with vascu-lar invasion and neural invasion, and that in metastatic lymph nodes was associated with Lauren classification (all P < 0.05; Table 1). The positive rate of PD-L2 was not significantly different in primary tumors and metastatic lymph nodes (28.6% vs. 26.9%, P > 0.05).
Density of CD8(+) T cells in primary tumors
The density of CD8(+) T cells in primary tumors was higher in non-intestinal type than in intestinal type gas-tric adenocarcinoma (P = 0.011). Stage IIIB–IIIC tumors exhibited a lower CD8(+) T-cell density than stage II– IIIA tumors (P = 0.018). The density of CD8(+) T cells in primary tumors was not associated with vascular inva-sion or neural invainva-sion (Table 2).
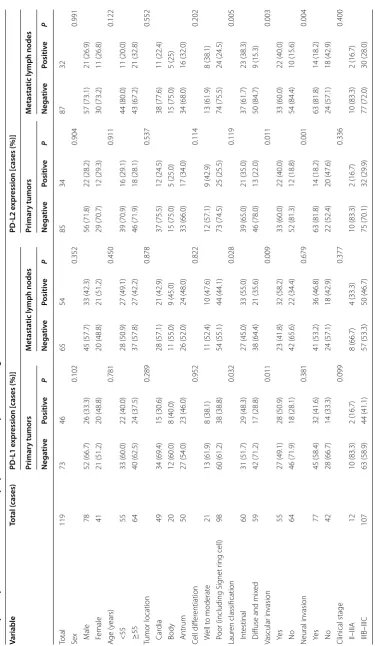
Table 1 A sso cia tion b et w een clinic opa tholo gic fac tors and the e xpr ession of pr ogr ammed c ell dea
th-ligand 1 (PD
-L1) and
pr
ogr
ammed c
ell dea
th-ligand 2 (PD
-L2) in primar
y tumors and metasta
tic lymph no
des fr
om pa
tien
ts with gastric adeno
car cinoma Variable Total (cases) PD ‑L1 e xpr
ession [cases (%)]
PD
‑L2 e
xpr
ession [cases (%)]
Primar
y tumors
M
etasta
tic lymph nodes
Primar
y tumors
M
etasta
tic lymph nodes
Nega tiv e Positiv e P Nega tiv e Positiv e P Nega tiv e Positiv e P Nega tiv e Positiv e P Total 119 73 46 65 54 85 34 87 32 Sex 0.102 0.352 0.904 0.991 M ale 78 52 (66.7) 26 (33.3) 45 (57.7) 33 (42.3) 56 (71.8) 22 (28.2) 57 (73.1) 21 (26.9) F emale 41 21 (51.2) 20 (48.8) 20 (48.8) 21 (51.2) 29 (70.7) 12 (29.3) 30 (73.2) 11 (26.8) A ge (y ears) 0.781 0.450 0.911 0.122 <55 55 33 (60.0) 22 (40.0) 28 (50.9) 27 (49.1) 39 (70.9) 16 (29.1) 44 (80.0) 11 (20.0) ≥ 55 64 40 (62.5) 24 (37.5) 37 (57.8) 27 (42.2) 46 (71.9) 18 (28.1) 43 (67.2) 21 (32.8) Tumor location 0.289 0.878 0.537 0.552 C ar dia 49 34 (69.4) 15 (30.6) 28 (57.1) 21 (42.9) 37 (75.5) 12 (24.5) 38 (77.6) 11 (22.4) Body 20 12 (60.0) 8 (40.0) 11 (55.0) 9 (45.0) 15 (75.0) 5 (25.0) 15 (75.0) 5 (25) Antrum 50 27 (54.0) 23 (46.0) 26 (52.0) 24 (48.0) 33 (66.0) 17 (34.0) 34 (68.0) 16 (32.0) Cell diff er entiation 0.952 0.822 0.114 0.202 W ell t o moderat e 21 13 (61.9) 8 (38.1) 11 (52.4) 10 (47.6) 12 (57.1) 9 (42.9) 13 (61.9) 8 (38.1) P
oor (including Sig
net r ing cell) 98 60 (61.2) 38 (38.8) 54 (55.1) 44 (44.1) 73 (74.5) 25 (25.5) 74 (75.5) 24 (24.5) Laur en classification 0.032 0.028 0.119 0.005 Int estinal 60 31 (51.7) 29 (48.3) 27 (45.0) 33 (55.0) 39 (65.0) 21 (35.0) 37 (61.7) 23 (38.3)
Diffuse and mix
PD‑1 expression
PD-1 was expressed predominantly on the membrane of tumor cells (Fig. 4). The positive rates of PD-1 expression on CD8(+) T cells were 37.8% in primary tumors, 39.5% in metastatic lymph nodes, and 10.9% in tumor-free lymph nodes. PD-1 expression on CD8(+) T cells in pri-mary tumors was not associated with any clinicopatho-logic factors (Table 2). The intensity of PD-1 expression on CD8(+) T cells in primary tumors and in metastatic lymph nodes were stronger than that in tumor-free lymph nodes from the same patient (Fig. 5).
Associations among PD‑L1, PD‑L2, PD‑1 expression and CD8(+) T‑cell density
PD-L1 expression was associated with PD-L2 expres-sion in both primary tumors (P = 0.043) and metastatic lymph nodes (P = 0.012). In primary tumors, the density of CD8(+) T cells was associated with PD-L1 expression (P = 0.022) and PD-L2 expression (P = 0.004). Neither PD-L1 nor PD-L2 expression was associated with PD-1 expression on CD8(+) T cells in primary tumors (both P > 0.05; Table 3). In metastatic lymph nodes, both PD-L1 expression (P = 0.034) and PD-L2 expression (P = 0.002)
were associated with PD-1 expression on CD8(+) T cells
(Table 4).
Univariate analysis on prognostic values of PD‑L1, PD‑L2, PD‑1 expression and CD8(+) T‑cell density
Patients with PD-L1 expression in primary tumors had lower 5-year OS and DFS rates than patients without PD-L1 expression (OS: 15.2% vs. 43.8%, P = 0.001, Fig. 6a;
DFS: 10.9% vs. 38.4%, P = 0.002, Fig. 6b). Also, patients
with PD-L1 expression in metastatic lymph nodes had lower 5-year OS and DFS rates than patients without PD-L1 expression (OS: 14.8% vs. 47.7%, P < 0.001; Fig. 6c; DFS: 13.0% vs. 40.0%, P = 0.004, Fig. 6d).
Patients with PD-L2 expression in primary tumors had lower 5-year OS and DFS rates than patients with-out PD-L2 expression (OS: 11.8% vs. 41.2%, P = 0.008, Fig. 6e; DFS: 8.8% vs. 35.3%, P = 0.007, Fig. 6f). Patients with PD-L2 expression in metastatic lymph nodes also had lower 5-year OS and DFS rates than patients without PD-L2 expression (OS: 9.4% vs. 41.4%, P < 0.001, Fig. 6g; DFS: 9.4% vs. 34.5%, P < 0.001, Fig. 6h).
Patients with PD-1 expression on CD8(+) T cells in
Table 2 A sso cia tions b et w een clinic opa tholo gic fac tors and densit y of CD8( +
) T c
ells and pr ogr ammed c ell dea th-1 (PD -1) e xpr ession on CD8( +
) T c
ells in
pri
-mar
y tumors and lymph no
des of gastric adeno
car cinoma Variable Total (cases) Densit y of CD8( + ) T cells in primar
y tumors [cases (%)]
PD
‑1 e
xpr
ession on CD8(
+
) T c
ells [cases (%)]
Primar
y tumors
M
etasta
tic lymph nodes
Tumor
‑fr
ee lymph nodes
Lo w H igh P Nega tiv e Positiv e P Nega tiv e Positiv e P Nega tiv e Positiv e P Total 119 46 73 74 45 72 47 106 13 Sex 0.263 0.155 0.434 0.982 M ale 78 33 (42.3) 45 (57.7) 45 (57.7) 33 (42.9) 45 (57.7) 33 (42.3) 69 (88.5) 9 (11.5) F emale 41 13 (31.7) 28 (68.3) 29 (70.7) 12 (29.3) 27 (65.9) 14 (34.1) 37 (90.2) 4 (9.8) A ge (y ears) 0.631 0.940 0.852 0.934 <55 55 20 (36.4) 35 (63.6) 34 (61.8) 21 (38.2) 34 (61.8) 21 (38.2) 49 (89.1) 6 (10.9) ≥ 55 64 26 (40.6) 38 (59.4) 40 (62.5) 24 (37.5) 38 (59.4) 26 (40.6) 57 (89.1) 7 (10.9) Tumor location 0.782 0.464 0.552 0.648 C ar dia 49 19 (38.8) 30 (61.2) 32 (65.3) 17 (34.7) 30 (61.2) 19 (38.8) 43 (87.8) 6 (12.2) Body 20 9 (45.0) 11 (55.0) 10 (50.0) 10 (50.0) 10 (50.0) 10 (50.0) 17 (85.0) 3 (15.0) Antrum 50 18 (36.0) 32 (64.0) 32 (64.0) 18 (36.0) 32 (64.0) 18 (36.0) 46 (92.0) 4 (8.0) Cell diff er entiation 0.660 0.981 0.799 0.906 W ell t o moderat e 21 9 (42.9) 12 (57.1) 13 (61.9) 8 (38.1) 12 (57.1) 9 (42.9) 20 (95.2) 1 (4.8) P
oor (including Sig
net r ing cell) 98 37 (37.8) 61 (62.2) 61 (62.2) 37 (37.8) 60 (61.2) 38 (38.8) 86 (87.8) 12(12.2) Laur en classification 0.011 0.103 0.061 0.239 Int estinal 60 30 (50.0) 30 (50.0) 33 (55.0) 27 (45.0) 31 (51.7) 29 (48.3) 51 (85.0) 9 (15.0)
Diffuse and mix
than patients without PD-1 expression (OS: 17.0% vs. 43.1%, P < 0.001, Fig. 6i; DFS: 11.1% vs. 37.8%, P = 0.002, Fig. 6j). Patients with PD-1 expression in CD8(+) T cells in metastatic lymph nodes had lower 5-year OS and DFS rates than patients without PD-1 expression (OS:
17.0% vs. 43.1%, P = 0.007, Fig. 6k; DFS: 14.9% vs. 36.1%, P = 0.021, Fig. 6l).
Patients with a high density of CD8(+) T cells in pri-mary tumors had higher 5-year OS and DFS rates than patients with a low density of CD8(+) T cells (OS: 39.7% Fig. 4 PD-1 expression (red signals) on CD8(+) T cells (green signals) in primary tumors of gastric adenocarcinoma. a Moderate intensity of PD-1 expression on CD8(+) T cells with a low density in the primary tumor; b weak intensity of PD-1 expression on CD8(+) T cells with a moderate density in the primary tumor; c strong intensity of PD-1 expression on CD8(+) T cells with a high density in the primary tumor
Fig. 5 PD-1 expression (red signals) on CD8(+) T cells (green signals) in primary tumors and lymph nodes from a 54-year-old male patient with stage II gastric adenocarcinoma. PD-1 expression on CD8(+) T cells was stronger in the primary tumor (a) and in metastatic lymph nodes (b) than in tumor-free lymph nodes (c)
Table 3 Associations among PD-L1, PD-L2, PD-1 expression, and CD8(+) T-cell density in primary tumors from patients with gastric adenocarcinoma
Variable PD‑L1 expression [cases (%)] PD‑L2 expression [cases (%)]
Negative Positive P Negative Positive P
PD-L2 expression 0.043
Negative 57 (47.9) 28 (23.5)
Positive 16 (13.4) 18 (15.1)
Density of CD8(+) T cells 0.022 0.004
Low 22 (18.5) 24 (20.2) 26 (21.8) 20 (16.8)
High 51 (42.9) 22 (18.5) 59 (49.6) 14 (11.8)
PD-1 expression on CD8(+) T cells 0.162 0.951
Negative 49 (41.2) 25 (21.0) 53 (44.5) 21 (17.6)
vs. 21.7%, P = 0.007, Fig. 6m; DFS: 34.2% vs. 17.4%, P = 0.010, Fig. 6n).
When patients were allocated into four groups based on different combinations of PD-L1 expression in tumor
cells and PD-1 expression on CD8(+) T cells in primary tumors, patients without PD-L1 and PD-1 expression had the best prognosis (Fig. 6o, p).
Table 4 Associations among PD-L1, PD-L2, and PD-1 expression in metastatic lymph nodes from patients with gastric adenocarcinoma
Variable PD‑L1 expression [cases (%)] PD‑L2 expression [cases (%)]
Negative Positive P Negative Positive P
PD-L2 expression 0.012
Negative 54 (45.4) 11 (9.2)
Positive 33 (27.7) 21 (17.6)
PD-1 expression on CD8(+) T cells 0.034 0.002
Negative 45 (37.8) 27 (22.7) 60 (50.4) 12 (10.1)
Positive 20 (16.8) 27 (22.7) 27 (22.7) 20 (16.8)
Multivariate analysis on prognostic values of PD‑L1, PD‑L2, PD‑1 expression and CD8(+) T‑cell density
In multivariate analysis, PD-L1 expression in primary tumors, PD-L2 expression in metastatic lymph nodes, a high density of CD8(+) T cells in primary tumors, and
PD-1 expression on CD8(+) T cells in primary tumors
were independent prognostic factors for shorter DFS; PD-L1 expression in metastatic lymph nodes, PD-L2 expression in primary tumors, a high density of CD8(+) T cells in primary tumors, and PD-1 expression on CD8(+) T cells in primary tumors were independent prognostic factors for shorter OS. Besides, stage T3–T4 and tumor location were independent prognostic factors for shorter OS and DFS; neural invasion was an inde-pendent prognostic factor for shorter OS (Table 5).
Discussion
We evaluated the expression of immune checkpoint molecules PD-L1 and PD-L2 in tumor cells, as well as the density of CD8(+) T cells and PD-1 expression on
CD8(+) T cells in patients with T1-4N+M0 gastric
adenocarcinoma. PD-L1, PD-L2, and PD-1 expression and a low density of CD8(+) T cells in primary tumors were associated with a poor prognosis.
The positive rate and prognostic value of PD-L1 expression in GC has been inconsistent. In one study that involved 102 patients with gastric adenocarcinoma in China, the positive rate of PD-L1 was 42.2% [25], which was slightly higher than that in our study. The difference in criteria to evaluate PD-L1 expression might account for the inconsistency. Besides, both studies found that PD-L1 expression in primary tumors was associated with vascular invasion and was an independent risk fac-tor of prognosis. A study in Korea reported that PD-L1 expression was associated with vascular invasion and Lauren classification of gastric adenocarcinoma and was an independent risk factor of poor prognosis for patients with a high density of CD8(+) T cells in primary tumors [26], which were consistent with the results of our study. One study in USA also reported that PD-L1 expression in tumor cells from primary tumors was associated with poor prognosis of patients with gastric adenocarcinoma,
Table 5 Multivariate analysis of prognostic factors for disease-free survival and overall survival of patients with gastric adenocarcinoma
HR hazard ratio, CI confidence interval
Variable Disease‑free survival Variable Overall survival
HR 95% CI P HR 95% CI P
T stage <0.001 T stage <0.001
T1–T2 1.000 T1–T2 1.000
T3–T4 4.475 2.084–9.610 T3–T4 4.736 2.116–10.599
Tumor location 0.005 Tumor location 0.002
Cardia 1.000 Cardia 1.000
Body 1.327 0.691–2.547 Body 2.500 1.234–5.064
Antrum 0.498 0.295–0.840 Antrum 0.671 0.394–1.143
PD-L1 expression in primary tumors 0.025 Neural invasion 0.008
Negative 1.000 Negative 1.000
Positive 1.735 1.073–2.807 Positive 2.172 1.220–3.459
Density of CD8(+) T cells in primary tumors 0.009 PD-L2 expression in primary tumors 0.003
Low 1.000 Negative 1.000
High 0.519 0.318–0.847 Positive 2.362 1.342–4.157
PD-1 expression on CD8(+) T cells in
primary tumors 0.014 Density of CD8(+) T cells in primary tumors 0.004
Negative 1.000 Low 1.000
Positive 1.833 1.131–2.972 High 0.460 0.272–0.780
PD-L2 expression in metastatic lymph
nodes 0.033 PD-1 expression on CD8(+) T cells in primary tumors 0.006
Negative 1.000 Negative 1.000
Positive 1.785 1.047–3.043 Positive 2.079 1.239–3.489
PD-L1 expression in metastatic lymph
nodes 0.003
Negative 1.000
but the positive rate of PD-L1 was only 12% [7], which was significantly lower than data from Asia studies [25, 26]. Although most studies showed that PD-L1 expres-sion was associated with poor prognosis of GC, a Japa-nese study including 243 patients with curatively resected GC found that both PFS and OS were longer in PD-L1-positive patients than in PD-L1-negative patients [11]. It is possible that the difference in patients’ races might be related to the inconsistency.
The relationship between PD-L1 expression and patients’ response rate to anti-PD-1/PD-L1 immuno-therapy was also not clear [27]. In the phase 1b KEY-NOTE-012 study of 39 patients, pembrolizumab showed promising antitumor effect on PD-L1-positive, recur-rent or metastatic gastric adenocarcinoma, with an ORR of 22% and a median OS of 11.4 months among these patients [21]. The prognostic and predictive values of PD-L1 expression in gastric adenocarcinoma patients who underwent anti-PD-1/PD-L1 immunotherapy thus remain to be explored. The inconsistent results from dif-ferent studies might be explained by the difdif-ferent anti-bodies and specimens (frozen vs. paraffin-embedded tissues) used for detection [20]. In our study, we chose a commonly used, commercially available antibody E1L3N clone to detect PD-L1 expression. Besides the E1L3N clone, several other antibodies for PD-L1 expression detection are also used in clinical practice, including 9A11 (general usage), Ventana SP142 (for patients treated with atezolizumab), Ventana SP263 (for patients treated with durvalumab), Dako 22C3 (for patients treated with pembrolizumab), and Dako 28-8 (for patients treated with nivolumab). In a study assessing these six antibod-ies for the detection of PD-L1 expression with microarray immunofluorescent staining, concordance among four antibodies (SP142, E1L3N, 9A11, and SP263) revealed regression of tumor tissue cores (R2 = 0.42–0.91) and cell line cores (R2 = 0.83–0.97) [28]. All six antibodies had high levels of concordance (R2 = 0.76–0.99) when using chromogenic staining in isogenic cell lines. A phase I trial involving 39 non-small cell lung cancer (NSCLC) patients compared four anti-PD-L1 antibodies (Dako 22C3, Dako 28-8, Ventana SP142, and Ventana SP263) using the Blueprint PD-L1 IHC Assay and demonstrated that the percentage of PD-L1-positive tumor cells was comparable when the 22C3, 28-8, and SP263 clones were used, whereas fewer tumor cells were stained with the SP142 clone [29]. Based on results from previous studies, the results of PD-L1 expression detected with the E1L3N clone in the present study was reliable and comparable with those of other studies.
Because PD-L1 expression can also be detected in stro-mal cells, the cell types chosen to detect PD-L1 expres-sion might also influence the results [7]. We only detected
PD-L1 expression in tumor cells in five high-power fields per slide which were selected without known bias to avoid influence caused by cell type.
We found significant heterogeneity of PD-L1 expres-sion between primary tumors and metastatic lymph nodes. The abundant immune cytokines in the microen-vironment of metastatic lymph nodes can induce PD-L1 expression, which might explain the increased positive rate of PD-L1 expression in metastatic lymph nodes than in primary tumors. However, some cases showed PD-L1 expression in the primary tumor, but not in metastatic lymph nodes. The heterogeneity of PD-L1 expression is probably responsible for the inaccuracy of using PD-L1 as a predictor of response to anti-PD-1/PD-L1 immu-notherapy in current clinical trials. Sunshine and Taube [30] reported that patients with PD-L1 expression in pre-treatment specimens of primary tumors were more likely to respond to anti-PD-1/PD-L1 immunotherapy than those without PD-L1 expression. However, objective response was also observed in patients without PD-L1 expression, although with a relatively low rate [30]. Fur-ther exploration in one patient with several pre-treat-ment specimens found heterogeneous PD-L1 expression in the primary tumor, the metastatic lymph node, and subsequent subcutaneous metastases [31]. Thus, if PD-L1 expression status is detected in only one specimen, false negative results might reduce the efficiency of using PD-L1 as a predictor of response to anti-PD-1/PD-L1 immunotherapy.
Few studies have evaluated the expression and function of PD-L2 in patients with gastric adenocarcinoma. One study of anti-PD-1 immunotherapy for 41 patients with various cancer types reported that PD-L2 expression was detected in 8 patients with renal cell carcinoma, mela-noma, or NSCLC [24]. Another study found a 51.7% rate of PD-L2 expression in patients with esophageal adeno-carcinoma [32]. In our study, PD-L2 was expressed in 28.6% of patients with gastric adenocarcinoma and pre-dicted short OS in those patients. As in another study, PD-L2 expression was positively correlated with PD-L1 expression in gastric adenocarcinoma, indicating a pos-sible interaction between the two molecules [24].
protein 4, and indoleamine 2,3-dioxygenase, and infiltra-tion density of immune cells, including CD3(+), CD4(+), CD8(+), and PD-1(+) cells, in the tumor microenviron-ment [20]. This discrepancy might be explained by the mechanisms of PD-L1 overexpression in tumor cells and by the difference in signatures of tumor immunity between Asian and non-Asian patients with gastric ade-nocarcinoma. On one hand, PD-L1 could be up-regulated by both intrinsic aberrant pathways involved in carcino-genesis and extrinsic cytokines produced by other stro-mal cells in the tumor microenvironment [38–40]. On the other hand, the density of tumor-infiltrating T cells was lower in Asian patients with gastric adenocarcinoma than non-Asian patients as reported in a previous study [41], revealing a large distinction in the immune status of tumor environment in patients from different geographic areas. Besides, different characteristics of gastric adeno-carcinoma between Asian and non-Asian populations might also be associated with the difference in median age of patients. The median age of patients in our study was 55 years old, which is consistent with the data reported by other studies in China [25, 42]. However, in the USA study, the median age of patients was 67 years old [7].
PD-1 is important in inhibiting the function of T cells by tumor cells through the PD-1/PD-L1 pathway [43], and it is a significant prognostic factor in several types of cancer [44–47]. PD-1 can be expressed on various types of activated T cells, and its function might be different [19]. The prognostic values of PD-1 expression on T cells were inconsistent among different studies [20, 46–48]. In the present study, we analyzed PD-1 expression on CD8(+) T cells and found it to be a unfavorable prognos-tic factor in gastric adenocarcinoma. The clinical value of PD-1 expression on other types of immune cells needs to be explored in further studies.
There were some limitations in the present study. First, we only analyzed the density of tumor-infiltrat-ing CD8(+) T cells, but did not analyze the densities of CD3(+) T cells and CD4(+) T cells, which may also have prognostic values in GC patients. Second, the heteroge-neity of PD-L1 expression was analyzed by comparing primary tumors with metastatic lymph nodes. If distant metastasis tissues could be obtained to detect PD-L1 expression, the heterogeneity analysis could be improved.
In conclusion, PD-L1 and PD-L2 expression in pri-mary tumors and matched metastatic lymph nodes, low density of CD8(+) T cells in primary tumors, and PD-1 expression on CD8(+) T cells in primary tumors were unfavorable prognostic factors in patients with stage II/III gastric adenocarcinoma. PD-L1 expression was associated with PD-L2 expression as well as the density of CD8(+) T cells in primary tumors. PD-L1 expres-sion in primary tumors was not consistent with that in
metastatic lymph nodes. We suggest assessing multiple specimens when determining the status of PD-L1 expres-sion in GC.
Abbreviations
GC: gastric cancer; PD-L1: programmed cell death-ligand 1; PD-L2: pro-grammed cell death-ligand 2; PD-1: propro-grammed cell death-1; ROC curve: receiver operating characteristic curve.
Authors’ contributions
YG, SXC, JS collected patients’ information. YG and DZX wrote the manuscript. YG, KFW, BYC finished immunohistochemistry. YG and YCC finished immuno-fluorescence. XKZ and colleagues scored the staining of slides. SL, WQJ guided experiments operating. Design of experiments was accomplished by MHH and FHW. All authors read and approved the final manuscript.
Author details
1 Sun Yat-sen University Cancer Center; State Key Laboratory of Oncology in South China; Collaborative Innovation Center for Cancer Medicine, Guang-zhou 510060, Guangdong, P. R. China. 2 Department of Clinical Trial Center, Sun Yat-sen University Cancer Center, Guangzhou 510060, Guangdong, P. R. China. 3 Department of Gastric Surgery, Sun Yat-sen University Cancer Center, Guangzhou 510060, Guangdong, P. R. China. 4 Department of Medical Oncol-ogy, Sun Yat-sen University Cancer Center, Guangzhou 510060, Guangdong, P. R. China. 5 Department of Pathology, Sun Yat-sen University Cancer Center, Guangzhou 510060, Guangdong, P. R. China. 6 Department of Image-guided Minimally Invasive Therapy, Sun Yat-sen University Cancer Center, Guang-zhou 510060, Guangdong, P. R. China.
Acknowledgements
Not applicable.
Competing interests
The authors declare that they have no competing interests.
Availability of data and materials
The key raw data have been deposited into the Research Data Deposit (http:// www.researchdata.org.cn), with the Approval Number of RDDB2017000071.
Received: 2 January 2017 Accepted: 13 May 2017
References
1. Massi D, Brusa D, Merelli B, Falcone C, Xue G, Carobbio A, et al. The status of PD-L1 and tumor-infiltrating immune cells predict resistance and poor prognosis in BRAFi-treated melanoma patients harboring mutant BRAFV600. Ann Oncol. 2015;26(9):1980–7.
2. McLaughlin J, Han G, Schalper KA, Carvajal-Hausdorf D, Pelekanou V, Rehman J, et al. Quantitative assessment of the heterogeneity of PD-L1 expression in non-small-cell lung cancer. JAMA Oncol. 2016;2(1):46–54. 3. Ali HR, Glont SE, Blows FM, Provenzano E, Dawson SJ, Liu B, et al.
PD-L1 protein expression in breast cancer is rare, enriched in basal-like tumours and associated with infiltrating lymphocytes. Ann Oncol. 2015;26(7):1488–93.
4. Choueiri TK, Fay AP, Gray KP, Callea M, Ho TH, Albiges L, et al. PD-L1 expression in nonclear-cell renal cell carcinoma. Ann Oncol. 2014;25(11):2178–84.
5. Massard C, Gordon MS, Sharma S, Rafii S, Wainberg ZA, Luke J, et al. Safety and efficacy of durvalumab (MEDI4736), an anti-programmed cell death ligand-1 immune checkpoint inhibitor, in patients with advanced urothe-lial bladder cancer. J Clin Oncol. 2016;34(26):3119–25.
7. Thompson ED, Zahurak M, Murphy A, Cornish T, Cuka N, Abdelfatah E, et al. Patterns of PD-L1 expression and CD8 T cell infiltration in gastric adenocarcinomas and associated immune stroma. Gut. 2016;66:794–801. 8. Lyford-Pike S, Peng S, Young GD, Taube JM, Westra WH, Akpeng B, et al.
Evidence for a role of the PD-1:PD-L1 pathway in immune resistance of HPV-associated head and neck squamous cell carcinoma. Cancer Res. 2013;73(6):1733–41.
9. Reck M, Rodriguez-Abreu D, Robinson AG, Hui R, Csőszi T, Fülöp A, et al. Pembrolizumab versus chemotherapy for PD-L1-positive non-small-cell lung cancer. N Engl J Med. 2016;375(19):1823–33.
10. Ansell SM, Lesokhin AM, Borrello I, Halwani A, Scott EC, Gutierrez M, et al. PD-1 blockade with nivolumab in relapsed or refractory Hodgkin’s lymphoma. N Engl J Med. 2015;372(4):311–9.
11. Herbst RS, Soria JC, Kowanetz M, Fine GD, Hamid O, Gordon MS, et al. Predictive correlates of response to the anti-PD-L1 antibody MPDL3280A in cancer patients. Nature. 2014;515(7528):563–7.
12. Topalian SL, Hodi FS, Brahmer JR, Gettinger SN, Smith DC, McDermott DF, et al. Safety, activity, and immune correlates of anti-PD-1 antibody in cancer. N Engl J Med. 2012;366(26):2443–54.
13. Wolchok JD, Kluger H, Callahan MK, Postow MA, Rizvi NA, Lesokhin AM, et al. Nivolumab plus ipilimumab in advanced melanoma. N Engl J Med. 2013;369(2):122–33.
14. Postow MA, Chesney J, Pavlick AC, Robert C, Grossmann K, McDermott D, et al. Nivolumab and ipilimumab versus ipilimumab in untreated melanoma. N Engl J Med. 2015;372(21):2006–17.
15. GLOBOCAN 2012. Estimated cancer incidence, mortality and prevalence worldwide in 2012. http://globocan.iarc.fr/Pages/fact_sheets_cancer. aspx. Accessed 24 July 2017.
16. Chen W, Zheng R, Zeng H, Zhang S. The incidence and mortality of major cancers in China, 2012. Chin J Cancer. 2016;35(1):430–4.
17. Chen W, Zheng R, Baade PD, Zhang S, Zeng H, Bray F, et al. Cancer statis-tics in China, 2015. CA Cancer J Clin. 2016;66(2):115–32.
18. Li Y. The journey of personalizing gastric cancer treatment. Chin J Cancer. 2016;35(8):84.
19. Eto S, Yoshikawa K, Nishi M, Higashijima J, Tokunaga T, Nakao T, et al. Programmed cell death protein 1 expression is an independent prog-nostic factor in gastric cancer after curative resection. Gastric Cancer. 2015;19:466–71.
20. Kim JW, Nam KH, Ahn SH, Park DJ, Kim HH, Kim SH, et al. Prognostic implications of immunosuppressive protein expression in tumors as well as immune cell infiltration within the tumor microenvironment in gastric cancer. Gastric Cancer. 2016;19(1):42–52.
21. Muro K, Chung HC, Shankaran V, Geva R, Catenacci D, Gupta S, et al. Pembrolizumab for patients with PD-L1-positive advanced gastric cancer (KEYNOTE-012): a multicentre, open-label, phase 1b trial. Lancet Oncol. 2016;17:717–26.
22. Dung L, Johanna B, Emiliano C. Safety and activity of nivolumab mono-therapy in advanced and metastatic (A/M) gastric or gastroesophageal junction cancer (GC/GEC): results from the CheckMate-032 study. J Clin Oncol. 2016;34(4 suppl):6.
23. Hyun C, Hendrik-Tobias A, Lucjan W. Safety, PD-L1 expression, and clinical activity of avelumab (MSB0010718C), an anti-PD-L1 antibody, in patients with advanced gastric or gastroesophageal junction cancer. J Clin Oncol. 2016;34:167.
24. Taube JM, Klein A, Brahmer JR, Xu H, Pan X, Kim JH, et al. Association of PD-1, PD-1 ligands, and other features of the tumor immune micro-environment with response to anti-PD-1 therapy. Clin Cancer Res. 2014;20(19):5064–74.
25. Wu C, Zhu Y, Jiang J, Zhao J, Zhang XG, Xu N, et al. Immunohistochemical localization of programmed death-1 ligand-1 (PD-L1) in gastric carci-noma and its clinical significance. Acta Histochem. 2006;108(1):19–24. 26. Chang H, Jung WY, Kang Y, Lee H, Kim A, Kim HK, et al. Programmed
death-ligand 1 expression in gastric adenocarcinoma is a poor prognostic factor in a high CD8+ tumor infiltrating lymphocytes group. Oncotarget. 2016;7(49):80426–34.
27. Sharon E, Streicher H, Goncalves P, Chen HX. Immune checkpoint inhibi-tors in clinical trials. Chin J Cancer. 2014;33(9):434.
28. Gaule P, Smithy JW, Toki M, Rehman J, Patell-Socha F, Cougot D, et al. A quantitative comparison of antibodies to programmed cell death 1 ligand 1. JAMA Oncol. 2016;3:256–9.
29. Hirsch FR, McElhinny A, Stanforth D, Ranger-Moore J, Jansson M, Kulan-gara K, et al. PD-L1 immunohistochemistry assays for lung cancer: results from phase 1 of the blueprint PD-L1 IHC assay comparison project. J Thorac Oncol. 2017;12(2):208–22.
30. Sunshine JC, Taube JM. PD-1/PD-L1 inhibitors. Curr Opin Pharmacol. 2015;23:32–8.
31. Taube JM. Unleashing the immune system: PD-1 and PD-Ls in the pre-treatment tumor microenvironment and correlation with response to PD-1/PD-L1 blockade. Oncoimmunology. 2014;3(11):e963413. 32. Derks S, Nason KS, Liao X, Stachler MD, Liu KX, Liu JB, et al. Epithelial
PD-L2 expression marks barrett’s esophagus and esophageal adenocarci-noma. Cancer Immunol Res. 2015;3(10):1123–9.
33. Naito Y, Saito K, Shiiba K, Ohuchi A, Saigenji K, Nagura H, et al. CD8+ T cells infiltrated within cancer cell nests as a prognostic factor in human colorectal cancer. Cancer Res. 1998;58(16):3491–4.
34. Pages F, Berger A, Camus M, Sanchez-Cabo F, Costes A, Molidor R, et al. Effector memory T cells, early metastasis, and survival in colorectal cancer. N Engl J Med. 2005;353(25):2654–66.
35. Sato E, Olson SH, Ahn J, Bundy B, Nishikawa H, Qian F, et al. Intraepithelial CD8+ tumor-infiltrating lymphocytes and a high CD8+/regulatory T cell ratio are associated with favorable prognosis in ovarian cancer. Proc Natl Acad Sci USA. 2005;102(51):18538–43.
36. Liu K, Yang K, Wu B, Chen H, Chen X, Chen X, et al. Tumor-infiltrating immune cells are associated with prognosis of gastric cancer. Medicine. 2015;94(39):e1631.
37. Galon J, Costes A, Sanchez-Cabo F. Type, density, and location of immune cells within human colorectal tumors predict clinical outcome. Science. 2006;313(5795):1960–4.
38. Liu J, Hamrouni A, Wolowiec D, Coiteux V, Kuliczkowski K, Hetuin D, et al. Plasma cells from multiple myeloma patients express B7-H1 (PD-L1) and increase expression after stimulation with IFN-{gamma} and TLR ligands via a MyD88-, TRAF6-, and MEK-dependent pathway. Blood. 2007;110(1):296–304.
39. Jiang X, Zhou J, Giobbie-Hurder A, Wargo J, Hodi FS. The activation of MAPK in melanoma cells resistant to BRAF inhibition promotes PD-L1 expression that is reversible by MEK and PI3K inhibition. Clin Cancer Res. 2013;19(3):598–609.
40. Akbay EA, Koyama S, Carretero J, Altabef A, Tchaicha JH, Christensen CL, et al. Activation of the PD-1 pathway contributes to immune escape in EGFR-driven lung tumors. Cancer Discov. 2013;3(12):1355–63. 41. Lin SJ, Gagnon-Bartsch JA, Tan IB, Earle S, Ruff L, Pettinger K, et al.
Signatures of tumour immunity distinguish Asian and non-Asian gastric adenocarcinomas. Gut. 2015;64(11):1721–31.
42. Wang W, Li Y, Sun X, Chen Y, Li W, Xu D, et al. Prognosis of 980 patients with gastric cancer after surgical resection. Chin J Cancer. 2010;29(11):923–30.
43. Freeman GJ, Long AJ, Iwai Y, Bourque K, Chernova T, Nishimura H, et al. Engagement of the PD-1 immunoinhibitory receptor by a novel B7 family member leads to negative regulation of lymphocyte activation. J Exp Med. 2000;192(7):1027–34.
44. Lim YJ, Koh J, Kim K, Chie EK, Kim B, Lee KB, et al. High ratio of pro-grammed cell death protein 1 (PD-1)(+)/CD8(+) tumor-infiltrating lymphocytes identifies a poor prognostic subset of extrahepatic bile duct cancer undergoing surgery plus adjuvant chemoradiotherapy. Radiother Oncol. 2015;117(1):165–70.
45. Shi F, Shi M, Zeng Z, Qi R, Liu Z, Zhang J, et al. PD-1 and PD-L1 upregula-tion promotes CD8(+) T-cell apoptosis and postoperative recurrence in hepatocellular carcinoma patients. Int J Cancer. 2011;128(4):887–96. 46. Thompson RH, Dong H, Lohse CM, Leibovich BC, Blute ML, Cheville JC, et al. PD-1 is expressed by tumor-infiltrating immune cells and is associated with poor outcome for patients with renal cell carcinoma. Clin Cancer Res. 2007;13(6):1757–61.
47. Zhang Y, Kang S, Shen J, He J, Jiang L, Wang W, et al. Prognostic sig-nificance of programmed cell death 1 (PD-1) or PD-1 ligand 1 (PD-L1) Expression in epithelial-originated cancer: a meta-analysis. Medicine. 2015;94(6):e515.