Open Access
Research article
The inflammatory and normal transcriptome of mouse bladder
detrusor and mucosa
Marcia R Saban
1, Helen L Hellmich
2, Mary Turner
3, Ngoc-Bich Nguyen
1,7,
Rajanikanth Vadigepalli
4, David W Dyer
5, Robert E Hurst
6, Michael Centola
3and Ricardo Saban*
1Address: 1Department of Physiology, The University Oklahoma Health Sciences Center, Oklahoma City, USA, 2Department of Anesthesiology, University of Texas Medical Branch, Galveston, USA, 3Oklahoma Medical Research Foundation (OMRF), Arthritis and Immunology Research Program, Microarray Core Facility, Oklahoma City, USA, 4Daniel Baugh Institute for Functional Genomics and Computational Biology. Department of Pathology, Anatomy and Cell Biology, Thomas Jefferson University, Philadelphia, USA, 5Department of Microbiology and Immunology, Laboratory for Genomics and Bioinformatics, Oklahoma University Health Sciences Center, Oklahoma City, USA, 6Department of Urology, The University Oklahoma Health Sciences Center, Oklahoma City, USA and 7Cellular & Structural Biology, The University of Texas Health Science Center at San Antonio, San Antonio, USA
Email: Marcia R Saban - [email protected]; Helen L Hellmich - [email protected]; Mary Turner - [email protected]; Ngoc-Bich Nguyen - [email protected]; Rajanikanth Vadigepalli - [email protected]; David W Dyer - [email protected]; Robert E Hurst - [email protected]; Michael Centola - [email protected]; Ricardo Saban* - [email protected] * Corresponding author
Abstract
Background: An organ such as the bladder consists of complex, interacting set of tissues and cells. Inflammation has been implicated in every major disease of the bladder, including cancer, interstitial cystitis, and infection. However, scanty is the information about individual detrusor and urothelium transcriptomes in response to inflammation. Here, we used suppression subtractive hybridizations (SSH) to determine bladder tissue- and disease-specific genes and transcriptional regulatory elements (TRE)s. Unique TREs and genes were assembled into putative networks.
Results: It was found that the control bladder mucosa presented regulatory elements driving genes such as myosin light chain phosphatase and calponin 1 that influence the smooth muscle phenotype. In the control detrusor network the Pax-3 TRE was significantly over-represented. During development, the Pax-Pax-3 transcription factor (TF) maintains progenitor cells in an undifferentiated state whereas, during inflammation, Pax-3 was suppressed and genes involved in neuronal development (synapsin I) were up-regulated. Therefore, during inflammation, an increased maturation of neural progenitor cells in the muscle may underlie detrusor instability. NF-κB was specifically over-represented in the inflamed mucosa regulatory network. When the inflamed detrusor was compared to control, two major pathways were found, one encoding synapsin I, a neuron-specific phosphoprotein, and the other an important apoptotic protein, siva. In response to LPS-induced inflammation, the liver X receptor was over-represented in both mucosa and detrusor regulatory networks confirming a role for this nuclear receptor in LPS-induced gene expression.
Conclusion: A new approach for understanding bladder muscle-urothelium interaction was developed by assembling SSH, real time PCR, and TRE analysis results into regulatory networks. Interestingly, some of the TREs and their downstream transcripts originally involved in organogenesis and oncogenesis were also activated during inflammation. The latter represents an additional link between inflammation and cancer. The regulatory networks represent key targets for development of novel drugs targeting bladder diseases.
Published: 18 January 2006
BMC Physiology 2006, 6:1 doi:10.1186/1472-6793-6-1
Received: 15 September 2005 Accepted: 18 January 2006
This article is available from: http://www.biomedcentral.com/1472-6793/6/1 © 2006 Saban et al; licensee BioMed Central Ltd.
Background
The lower urinary tract is subject to a number of func-tional disorders in which a cross-communication between urothelium and detrusor muscle is a factor. Bladder over-activity has been attributed to detrusor muscle dysfunc-tion, and several in vitro and in vivo methodologies have been developed to better understand its pathophysiology [1]. Although the detrusor muscle participates intensively in the inflammatory response, practically every major dis-ease of the urinary bladder, including cancer, interstitial cystitis, and infection [2], involves the urothelium [3].
The urinary bladder develops as a result of indispensable epithelial-mesenchymal interactions responsible for directing urothelial differentiation and for normal smooth muscle development [4,5]. However, in adult-hood, the urinary bladder is a highly heterogeneous organ, consisting of a large variety of cell types, and this complexity presents challenges to the study of physiolog-ical and cellular processes in health and disease. This was evident in studies determining gene regulation [6-11] and target validation [12]. In the latter study, the expression of protease-activating receptors (PAR) was differentially dis-tributed between bladder mucosa, detrusor smooth mus-cle, and nerve elements. Moreover, during inflammation, PAR expression was up-regulated in the mucosa contrast-ing with its down-regulation in the detrusor muscle [12]. These results suggested a possible differential distribution of proteins between bladder mucosa and detrusor muscle and indicated the need for reduction of the whole tissue into specific layers.
The present work was undertaken to elucidate the tran-scriptional complexity of inflammation, as modeled in the mouse urinary bladder. The first step towards the study of individual layers was the separation of the mucosa and submucosa layers away from the detrusor smooth muscle and adventitia (See Additional file 1). We went further to determine low abundant transcripts, using suppression subtractive hybridization (SSH) and selected ones were confirmed by real time PCR. Next, the SSH-originated transcripts were annotated and analyzed for significantly enriched transcriptional regulatory elements (TRE) using PAINT [Promoter Analysis and Interaction Network Toolset; [13]]. PAINT utilizes TRANSFAC data-base [14] containing eukaryotic cis-acting regulatory DNA elements and trans-acting factors. The pattern search tool MATCH in TRANSFAC suite is employed to identify the TREs on cognate 5' upstream regulatory sequences [15]. Putative regulatory networks were assembled using known interactions among genes and their coded proteins as well as information about TREs that were significantly over-represented in the genes comprising inflammatory and control transcriptomes. Together, these results consti-tute the first demonstration of the transcriptional com-plexity underlying the different layers of the urinary bladder and their contribution to the early phases of blad-der inflammation.
Results
SSH. From each library, at least 50 clones were further sequenced and annotated, for a total of 300 clones. The present work reports only tissue-specific transcripts
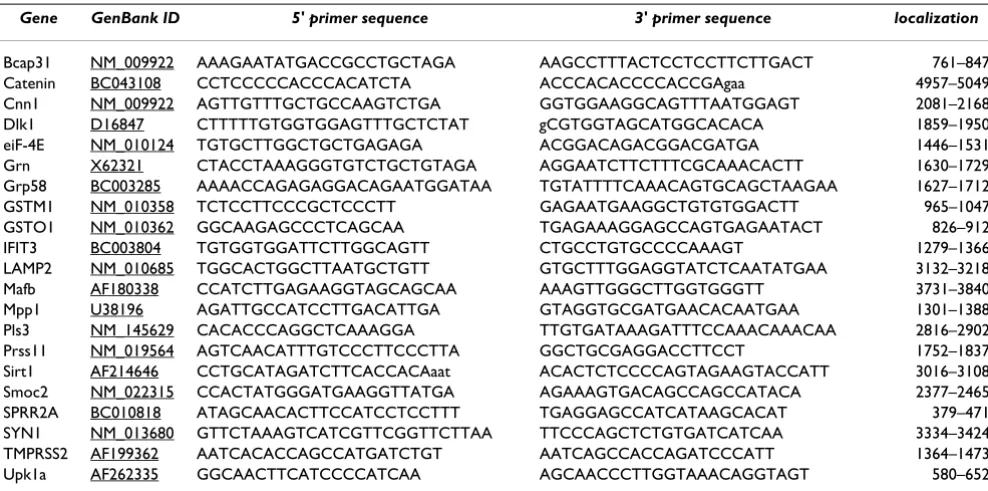
Table 1: Primers for real time PCR
Gene GenBank ID 5' primer sequence 3' primer sequence localization
Bcap31 NM_009922 AAAGAATATGACCGCCTGCTAGA AAGCCTTTACTCCTCCTTCTTGACT 761–847
Catenin BC043108 CCTCCCCCACCCACATCTA ACCCACACCCCACCGAgaa 4957–5049
Cnn1 NM_009922 AGTTGTTTGCTGCCAAGTCTGA GGTGGAAGGCAGTTTAATGGAGT 2081–2168
Dlk1 D16847 CTTTTTGTGGTGGAGTTTGCTCTAT gCGTGGTAGCATGGCACACA 1859–1950
eiF-4E NM_010124 TGTGCTTGGCTGCTGAGAGA ACGGACAGACGGACGATGA 1446–1531
Grn X62321 CTACCTAAAGGGTGTCTGCTGTAGA AGGAATCTTCTTTCGCAAACACTT 1630–1729
Grp58 BC003285 AAAACCAGAGAGGACAGAATGGATAA TGTATTTTCAAACAGTGCAGCTAAGAA 1627–1712
GSTM1 NM_010358 TCTCCTTCCCGCTCCCTT GAGAATGAAGGCTGTGTGGACTT 965–1047
GSTO1 NM_010362 GGCAAGAGCCCTCAGCAA TGAGAAAGGAGCCAGTGAGAATACT 826–912
IFIT3 BC003804 TGTGGTGGATTCTTGGCAGTT CTGCCTGTGCCCCAAAGT 1279–1366
LAMP2 NM_010685 TGGCACTGGCTTAATGCTGTT GTGCTTTGGAGGTATCTCAATATGAA 3132–3218
Mafb AF180338 CCATCTTGAGAAGGTAGCAGCAA AAAGTTGGGCTTGGTGGGTT 3731–3840
Mpp1 U38196 AGATTGCCATCCTTGACATTGA GTAGGTGCGATGAACACAATGAA 1301–1388
Pls3 NM_145629 CACACCCAGGCTCAAAGGA TTGTGATAAAGATTTCCAAACAAACAA 2816–2902
Prss11 NM_019564 AGTCAACATTTGTCCCTTCCCTTA GGCTGCGAGGACCTTCCT 1752–1837
Sirt1 AF214646 CCTGCATAGATCTTCACCACAaat ACACTCTCCCCAGTAGAAGTACCATT 3016–3108
Smoc2 NM_022315 CCACTATGGGATGAAGGTTATGA AGAAAGTGACAGCCAGCCATACA 2377–2465
SPRR2A BC010818 ATAGCAACACTTCCATCCTCCTTT TGAGGAGCCATCATAAGCACAT 379–471
SYN1 NM_013680 GTTCTAAAGTCATCGTTCGGTTCTTAA TTCCCAGCTCTGTGATCATCAA 3334–3424
TMPRSS2 AF199362 AATCACACCAGCCATGATCTGT AATCAGCCACCAGATCCCATT 1364–1473
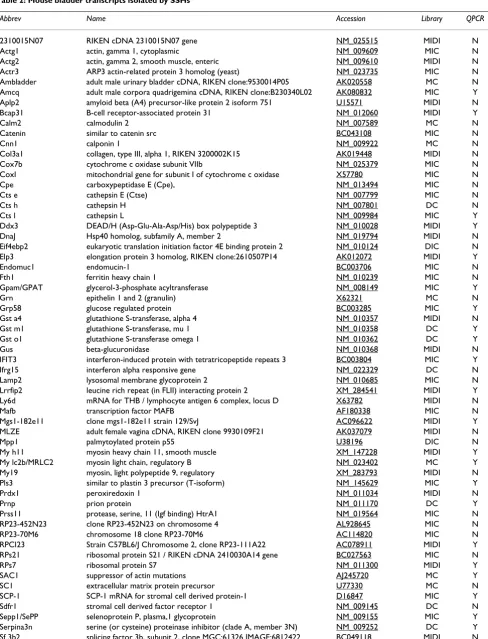
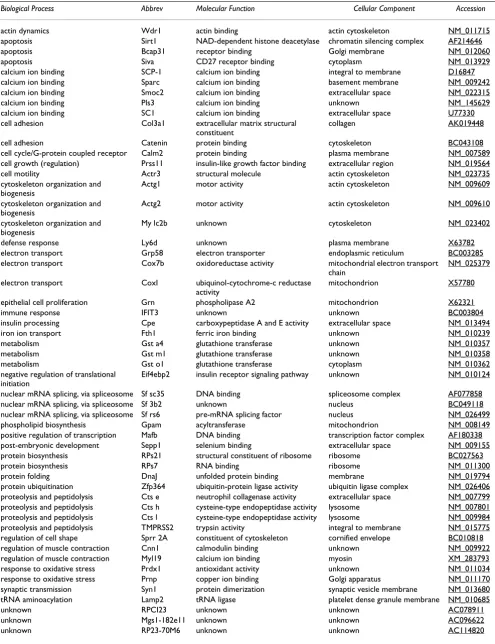
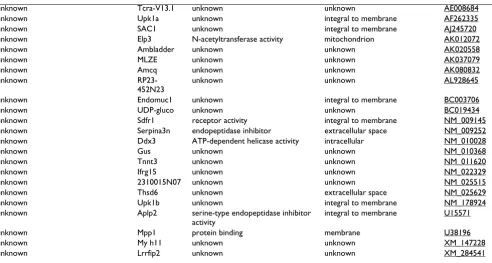
Table 2: Mouse bladder transcripts isolated by SSHs
Abbrev Name Accession Library QPCR
2310015N07 RIKEN cDNA 2310015N07 gene NM_025515 MIDI N
Actg1 actin, gamma 1, cytoplasmic NM_009609 MIC N
Actg2 actin, gamma 2, smooth muscle, enteric NM_009610 MIDI N
Actr3 ARP3 actin-related protein 3 homolog (yeast) NM_023735 MIC N
Ambladder adult male urinary bladder cDNA, RIKEN clone:9530014P05 AK020558 MC N Amcq adult male corpora quadrigemina cDNA, RIKEN clone:B230340L02 AK080832 MIC Y Aplp2 amyloid beta (A4) precursor-like protein 2 isoform 751 U15571 MIDI N
Bcap31 B-cell receptor-associated protein 31 NM_012060 MIDI Y
Calm2 calmodulin 2 NM_007589 MC N
Catenin similar to catenin src BC043108 MIC N
Cnn1 calponin 1 NM_009922 MC N
Col3a1 collagen, type III, alpha 1, RIKEN 3200002K15 AK019448 MIDI N
Cox7b cytochrome c oxidase subunit VIIb NM_025379 MIC N
CoxI mitochondrial gene for subunit I of cytochrome c oxidase X57780 MIC N
Cpe carboxypeptidase E (Cpe), NM_013494 MIC N
Cts e cathepsin E (Ctse) NM_007799 MIC N
Cts h cathepsin H NM_007801 DC N
Cts l cathepsin L NM_009984 MIC Y
Ddx3 DEAD/H (Asp-Glu-Ala-Asp/His) box polypeptide 3 NM_010028 MIDI Y
DnaJ Hsp40 homolog, subfamily A, member 2 NM_019794 MIDI N
Eif4ebp2 eukaryotic translation initiation factor 4E binding protein 2 NM_010124 DIC N Elp3 elongation protein 3 homolog, RIKEN clone:2610507P14 AK012072 MIDI Y
Endomuc1 endomucin-1 BC003706 MIC N
Fth1 ferritin heavy chain 1 NM_010239 MIC N
Gpam/GPAT glycerol-3-phosphate acyltransferase NM_008149 MIC Y
Grn epithelin 1 and 2 (granulin) X62321 MC N
Grp58 glucose regulated protein BC003285 MIC Y
Gst a4 glutathione S-transferase, alpha 4 NM_010357 MIDI N
Gst m1 glutathione S-transferase, mu 1 NM_010358 DC Y
Gst o1 glutathione S-transferase omega 1 NM_010362 DC Y
Gus beta-glucuronidase NM_010368 MIDI N
IFIT3 interferon-induced protein with tetratricopeptide repeats 3 BC003804 MIC Y
Ifrg15 interferon alpha responsive gene NM_022329 DC N
Lamp2 lysosomal membrane glycoprotein 2 NM_010685 MIC N
Lrrfip2 leucine rich repeat (in FLII) interacting protein 2 XM_284541 MIDI Y
Ly6d mRNA for THB / lymphocyte antigen 6 complex, locus D X63782 MIDI N
Mafb transcription factor MAFB AF180338 MIC N
Mgs1-182e11 clone mgs1-182e11 strain 129/SvJ AC096622 MIDI Y
MLZE adult female vagina cDNA, RIKEN clone 9930109F21 AK037079 MIDI N
Mpp1 palmytoylated protein p55 U38196 DIC N
My h11 myosin heavy chain 11, smooth muscle XM_147228 MIDI Y
My lc2b/MRLC2 myosin light chain, regulatory B NM_023402 MC Y
My19 myosin, light polypeptide 9, regulatory XM_283793 MIDI N
Pls3 similar to plastin 3 precursor (T-isoform) NM_145629 MIC Y
Prdx1 peroxiredoxin 1 NM_011034 MIDI N
Prnp prion protein NM_011170 DC Y
Prss11 protease, serine, 11 (Igf binding) HtrA1 NM_019564 MIC N
RP23-452N23 clone RP23-452N23 on chromosome 4 AL928645 MIC N
RP23-70M6 chromosome 18 clone RP23-70M6 AC114820 MIC N
RPCI23 Strain C57BL6/J Chromosome 2, clone RP23-111A22 AC078911 MIDI Y
RPs21 ribosomal protein S21 / RIKEN cDNA 2410030A14 gene BC027563 MIC N
RPs7 ribosomal protein S7 NM_011300 MIDI Y
SAC1 suppressor of actin mutations AJ245720 MC Y
SC1 extracellular matrix protein precursor U77330 MC N
SCP-1 SCP-1 mRNA for stromal cell derived protein-1 D16847 MIC Y
Sdfr1 stromal cell derived factor receptor 1 NM_009145 DC N
Sepp1/SePP selenoprotein P, plasma,1 glycoprotein NM_009155 MIC Y
Sf rs6 splicing factor, arginine/serine-rich 6 NM_026499 MIC N
Sf sc35 splicing factor SC35 AF077858 MIDI N
Sirt1 Sir1 alpha protein AF214646 MIDI N
Siva Cd27 binding proapoptotic protein NM_013929 DIC Y
Smoc2 SPARC related modular calcium binding 2 NM_022315 MIC N
Sparc secreted acidic cysteine rich glycoprotein NM_009242 MIDI N
Sprr 2A small proline-rich protein 2A BC010818 MC Y
Syn1 synapsin I or ribosomal protein S15a NM_013680 DIC Y
Tcra-V13.1 T-cell receptor alpha/delta locus AE008684 MIC N
Thsd6 thrombospondin, type I domain containing 6 NM_025629 DC Y
TMPRSS2 transmembrane protease, serine 2 NM_015775 MIDI N
Tnnt3 troponin T3, skeletal, fast NM_011620 MIDI N
UDP-gluco UDP-glucuronosyltransferase 1 family, member 2 BC019434 MIC N
Upk1a uroplakin 1a AF262335 DC N
Upk1b uroplakin 1b NM_178924 DC N
Wdr1 WD repeat domain 1 NM_011715 MIDI N
Zfp364 zinc finger protein 364/Rab7 NM_026406 MIDI N
Table 2: Mouse bladder transcripts isolated by SSHs (Continued)
(mucosa vs detrusor) and treatment-specific transcripts (saline vs LPS). 120 transcripts were considered to be unique. These indicate that each of these 120 transcript occurred in a specific subtraction. Transcripts that appeared in more than one subtraction were not consid-ered unique and therefore, not included. Selection of clones ceased when a substantial number of additional sequences [approximately 180] did not reveal any addi-tional unique transcript. Next, 120 clones were sequenced and analyzed for homology in the GenBank and EMBL databases.
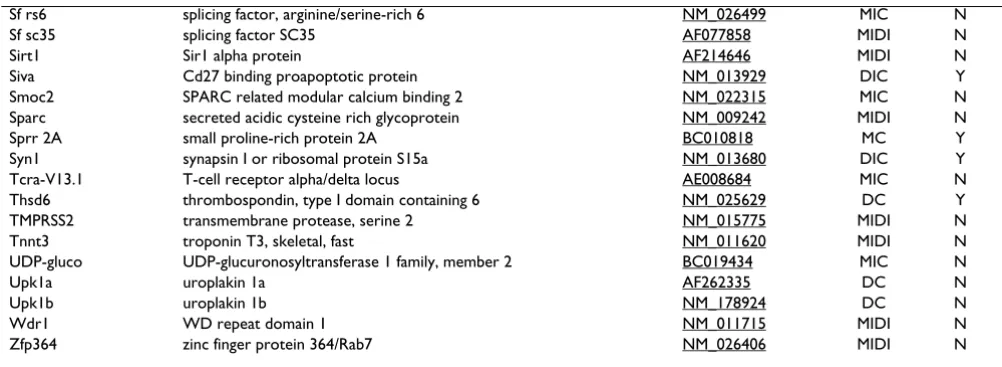
Seventy six cDNA fragments (Table 2) were further anno-tated using the Mouse Genome Information [16] accord-ing to Gene Ontology and presented in Table 3. Among the 76 fragments selected for futher annotation, 21 frag-ments had homology with expressed sequence tags (ESTs) and cDNA clones for which information about tissue spe-cificity, biologycal or molecular function is not available. Interestingly, one of these clones (ambladder; RIKEN clone:9530014P05) was originally isolated from an adult male bladder cDNA library [17].
SSH-selected transcripts
Table 3 summarizes the isolated transcripts that in general are involved in: actin dynamics (wdr1); apoptosis (sirt1, siva, and bcap31); calcium ion binding (pls3, sc1, scp-1, sparc, and smoc2); cell adhesion (col3a1 and catenin); cell cycle/ G-protein coupled receptor (cam2); cell growth (prss11); cell motility (actr3); cytoskeleton organization and biogenesis (actg1, actg2, and mylc2b);defense response (ly6d); electron transport (cox7b, grp58, and
coxI); epithelial cell proliferation (grn); immune response (ifit3); insulin processing (cpe); iron ion transport (fth1); metabolism/ glutathione transferase activity (gsto1, gsta4, and gstm1); negative regulation of translational initiation (eif4ebp2); nuclear mRNA splicing (sfsc35 and sfrs6);
phos-pholipid biosynthesis (gpam); positive regulation of tran-scription (mafb); post-embryonic development (sepp1); protein biosynthesis (rps7 and rps21); protein folding (dnaJ); protein ubiquitination (zfp364); proteolysis (ctse,
ctsh, ctsl, Aplp2, serpina3n, and tmprss2); regulation of cell shape (sprr2A); regulation of muscle contraction (my19
and cnn1); response to oxidative stress (prdx1 and prnp); synaptic transmission (syn1); and tRNA aminoacylation (lamp2).
Target validation by quantitative real-time polymerase chain reaction (QRT-PCR)
From the annotated transcripts (Table 2), twenty six were selected for further analysis by QRT-PCR. The results are summarized in Table 4. In tissues isolated from saline-treated mice the following transcripts were expressed pref-erentially in the detrusor muscle when compared to the mucosa layer: ctsh, eif4ebp2, gstm1, gsto1, serpina3n, sprr2A,
upk1a, and upk1b. With the exception of serpina3n, all detrusor-specific transcripts were also preferentially up regulated in the inflamed detrusor. In contrast, calm2, cnn1, and smoc2 were preferentially expressed in the blad-der mucosa of control mice. With the exception of calm2, all other mucosa-specific transcripts were up-regulated during inflammation. Table 4 also segregates transcripts that were represented in both layers of control mice and that were up-regulated during the inflammatory process. The latter include: bcap31, catenin, pls3, mafb, prss11, mpp1, syn1, lamp2, and sepp1.
TREs
Table 3: ANNOTATION (GENE ONTOLOGY) OF SSH-ISOLATED TRANSCRIPT FROM MOUSE URINARY BLADDER
Biological Process Abbrev Molecular Function Cellular Component Accession
actin dynamics Wdr1 actin binding actin cytoskeleton NM_011715
apoptosis Sirt1 NAD-dependent histone deacetylase chromatin silencing complex AF214646
apoptosis Bcap31 receptor binding Golgi membrane NM_012060
apoptosis Siva CD27 receptor binding cytoplasm NM_013929
calcium ion binding SCP-1 calcium ion binding integral to membrane D16847
calcium ion binding Sparc calcium ion binding basement membrane NM_009242
calcium ion binding Smoc2 calcium ion binding extracellular space NM_022315
calcium ion binding Pls3 calcium ion binding unknown NM_145629
calcium ion binding SC1 calcium ion binding extracellular space U77330
cell adhesion Col3a1 extracellular matrix structural constituent
collagen AK019448
cell adhesion Catenin protein binding cytoskeleton BC043108
cell cycle/G-protein coupled receptor Calm2 protein binding plasma membrane NM_007589 cell growth (regulation) Prss11 insulin-like growth factor binding extracellular region NM_019564
cell motility Actr3 structural molecule actin cytoskeleton NM_023735
cytoskeleton organization and biogenesis
Actg1 motor activity actin cytoskeleton NM_009609
cytoskeleton organization and biogenesis
Actg2 motor activity actin cytoskeleton NM_009610
cytoskeleton organization and biogenesis
My lc2b unknown cytoskeleton NM_023402
defense response Ly6d unknown plasma membrane X63782
electron transport Grp58 electron transporter endoplasmic reticulum BC003285 electron transport Cox7b oxidoreductase activity mitochondrial electron transport
chain
NM_025379
electron transport CoxI ubiquinol-cytochrome-c reductase activity
mitochondrion X57780
epithelial cell proliferation Grn phospholipase A2 mitochondrion X62321
immune response IFIT3 unknown unknown BC003804
insulin processing Cpe carboxypeptidase A and E activity extracellular space NM_013494
iron ion transport Fth1 ferric iron binding unknown NM_010239
metabolism Gst a4 glutathione transferase unknown NM_010357
metabolism Gst m1 glutathione transferase unknown NM_010358
metabolism Gst o1 glutathione transferase cytoplasm NM_010362
negative regulation of translational initiation
Eif4ebp2 insulin receptor signaling pathway unknown NM_010124
nuclear mRNA splicing, via spliceosome Sf sc35 DNA binding spliceosome complex AF077858
nuclear mRNA splicing, via spliceosome Sf 3b2 unknown nucleus BC049118
nuclear mRNA splicing, via spliceosome Sf rs6 pre-mRNA splicing factor nucleus NM_026499
phospholipid biosynthesis Gpam acyltransferase mitochondrion NM_008149
positive regulation of transcription Mafb DNA binding transcription factor complex AF180338 post-embryonic development Sepp1 selenium binding extracellular space NM_009155 protein biosynthesis RPs21 structural constituent of ribosome ribosome BC027563
protein biosynthesis RPs7 RNA binding ribosome NM_011300
protein folding DnaJ unfolded protein binding membrane NM_019794
protein ubiquitination Zfp364 ubiquitin-protein ligase activity ubiquitin ligase complex NM_026406 proteolysis and peptidolysis Cts e neutrophil collagenase activity extracellular space NM_007799 proteolysis and peptidolysis Cts h cysteine-type endopeptidase activity lysosome NM_007801 proteolysis and peptidolysis Cts l cysteine-type endopeptidase activity lysosome NM_009984 proteolysis and peptidolysis TMPRSS2 trypsin activity integral to membrane NM_015775 regulation of cell shape Sprr 2A constituent of cytoskeleton cornified envelope BC010818 regulation of muscle contraction Cnn1 calmodulin binding unknown NM_009922 regulation of muscle contraction Myl19 calcium ion binding myosin XM_283793
response to oxidative stress Prdx1 antioxidant activity unknown NM_011034
response to oxidative stress Prnp copper ion binding Golgi apparatus NM_011170 synaptic transmission Syn1 protein dimerization synaptic vesicle membrane NM_013680 tRNA aminoacylation Lamp2 tRNA ligase platelet dense granule membrane NM_010685
unknown RPCI23 unknown unknown AC078911
unknown Mgs1-182e11 unknown unknown AC096622
downstream transcripts specifically expressed in bladder mucosa during inflammation were compared to control mucosa (Figure 3) or to the inflamed detrusor (Figure 4). In contrast, the response of detrusor muscle to inflamma-tion was determined in comparison to detrusor control (Figure 6) or inflamed mucosa (Figure 7). The results pre-sented here demonstrate the concept that combining SSH methodology with PAINT-guided transcriptional regula-tory element analysis permitted the generation of testable hypotheses regarding differences between mucosa and detrusor regulatory networks in health and disease states.
Discussion
We used a highly effective method for differential gene analysis, termed suppression subtractive hybridization (SSH), which has been developed for the generation of subtracted cDNA libraries. It is based primarily on sup-pression PCR and combines normalization and subtrac-tion in a single procedure [18]. The normalizasubtrac-tion step equalizes the abundance of cDNAs within the target pop-ulation and the subtraction step excludes the common sequences between the target and driver populations. In a model system, the SSH technique enriched for rare sequences over 1,000-fold in one round of subtractive hybridization [18]. Unlike microarrays, which mainly identify moderate to high abundant genes, SSH identifies clones that are expressed at very low levels. It is possible that some of the extremely low-level gene expression is not biologically significant, as it might arise from 'random transcription' [19]. Therefore, we confirmed the
differen-tial expression of twenty six SSH-selected transcripts by
QRT-PCR and the results were highly correlated. In addi-tion, we introduced a redundancy factor by comparing the data generated from the analysis of multiple SSH libraries (MC, DC, MIC, MIDI, DID, and DIMI). Nevertheles, the question of validation certainly is an important one, and it is one we have considered. For one, we examined prop-erties of the candidate genes that were independent of expression, such as the presence of promoter sequences, to increase the probability that mechanisms suggested by the expression data were not simply statistical anomalies. Moreover, the finding that mechanisms known to be operant emerged from the analysis also increases confi-dence that novel ones are valid as well.
This study was carried out at a single time point. The 24 hour time point was chosen because it coincides with the peak of acute inflammation [8,9]. This point characterizes the acute inflammatory responses to LPS and in addition to edema and vasodilation, the peak response of neu-trophil infiltration occurred at 24 h in the mucosa and submucosa as well as in the detrusor smooth muscle [8,9]. The rationale for a single time point was to keep the number of variables within a reasonable limit. We under-stand that 24 h time point may not identify preceding or proceeding events as we indicated previously [7-9]. There-fore, the results of regulatory network here presented should be viewed as a snapshot of the inflammatory tran-scriptome at the point of maximal inflammatory response. Nevertheless, genes identified as important at
unknown Tcra-V13.1 unknown unknown AE008684
unknown Upk1a unknown integral to membrane AF262335
unknown SAC1 unknown integral to membrane AJ245720
unknown Elp3 N-acetyltransferase activity mitochondrion AK012072
unknown Ambladder unknown unknown AK020558
unknown MLZE unknown unknown AK037079
unknown Amcq unknown unknown AK080832
unknown
RP23-452N23
unknown unknown AL928645
unknown Endomuc1 unknown integral to membrane BC003706
unknown UDP-gluco unknown unknown BC019434
unknown Sdfr1 receptor activity integral to membrane NM_009145
unknown Serpina3n endopeptidase inhibitor extracellular space NM_009252
unknown Ddx3 ATP-dependent helicase activity intracellular NM_010028
unknown Gus unknown unknown NM_010368
unknown Tnnt3 unknown unknown NM_011620
unknown Ifrg15 unknown unknown NM_022329
unknown 2310015N07 unknown unknown NM_025515
unknown Thsd6 unknown extracellular space NM_025629
unknown Upk1b unknown integral to membrane NM_178924
unknown Aplp2 serine-type endopeptidase inhibitor activity
integral to membrane U15571
unknown Mpp1 protein binding membrane U38196
unknown My h11 unknown unknown XM_147228
unknown Lrrfip2 unknown unknown XM_284541
this time point can now be followed over time by other techniques.
By using cDNA subtractions between mucosa and detru-sor smooth muscle layers isolated from control and inflamed bladders, several clones identified transcripts that were further annotated. It has to be taken in consid-eration that the mucosal layer contains the urothelial layer and the lamina propria which involves other cell types (fibroblasts, myofibroblasts, etc.) in addition to urothelial cells that may underlie the transcriptomes iden-tified. In addition, during the inflammation, inflamma-tory cells are present in the detrusor as well as in the mucosa and may contribute to the inflammatory bladder transcriptome.
Some of the transcripts are RIKEN sequences and there-fore, have no biological process attributed. Interestingly, some of these transcripts with unknown function, such as
ambladder, have been reported in the adult male urinary bladder by others using SSH [17]. However, the present work indicates that the same transcript was isolated from female urinary bladder as well.
Central to elucidation of hypothetical cis-regulatory net-works is the identification and classification of naturally occurring transcription factor-binding sites in subtracted libraries. The combination of SSH-derived transcripts with PAINT-guided query of the TRANSFAC database per-mitted the generation of regulatory networks containing upstream TREs connecting corresponding TFs to the respective transcripts. Interestingly, many of the genes identified by SSH are transcription factors which empha-size the use of SSH to identify low expression transcripts.
Mucosa control [MC], (figure 2)
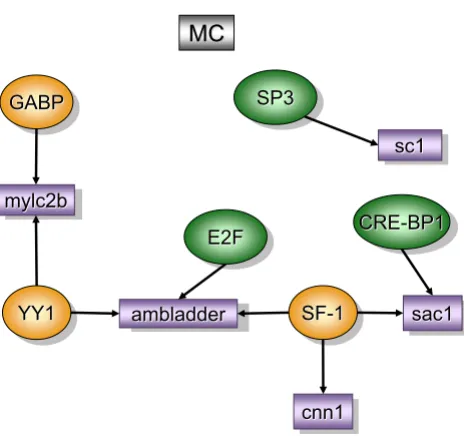
The regulatory network for the control bladder mucosa (MC) was obtained in comparison to detrusor control and contained the following over-represented TREs: GA-bind-ing protein (GABP), YY1 (yin yang 1), SF-1 (steroidogenic factor-1), EF2, CRE-BP1, and Sp-3 (trans-acting transcrip-tion factor 3).
GABP, also known as nuclear respiratory factor 2 (NRF-2), is a transcriptional coordinator of mitochondrial and nuclear-encoded subunits of cytochrome oxidase genes [20]. NRF-2 responds to increased neuronal activity by translocating from the cytoplasm to the nucleus, where it engages in transcriptional activation of target genes [21]. GABP is abundant in the kidney [22], however, the infor-mation about GABP is scanty in the rest lower urinary tract.
YY1 is a zinc finger TF which is thought to regulate cell growth and differentiation. YY1 normally antagonizes
serum response factor (SRF) [23]. Interestingly, in the inflamed mucosa YY1 was not expressed and SRF was con-sidered over-represented (Figure 2). YY1 along with GAPB drives the expression of myosin light chain phosphatase (mylc2b) which can be developmentally regulated in mammalian urinary bladders [24] and it is involved in the bladder response to obstruction [25].
SF-1 is a zinc finger motif of nuclear receptors [26] essen-tial for steroidogenesis as well as for the development of the reproductive axis [27]. CRE-BP1, which is an ubiqui-tous basic-leucine zipper, is required for normal skeletal development.
YY1, SF-1, and EF2 were found upstream of ambladder
(RIKEN clone 9530014P05 or prothymosin alpha). Pro-thymosin alpha is an oxidative stress-protecting gene [28] and transgenic mice over-expressing this transcript develop polycystic kidney disease PKD [29]. Another gene downstream of SF-1 was calponin 1 (cnn1). Cnn1 encodes for a multifunctional protein whose expression is tightly restricted to differentiated smooth muscle cell lineages during embryonic and post-natal life [30].
SF-1 and CRE-BP1 were found upstream of sac1 (a murine homolog of S. cerevisiae suppressor of actin mutations). Finally, an additional TRE, Sp-3 was found upstream of
sc1 which is a calcium binging protein and an extracellular matrix protein precursor.
Epithelial-stromal interactions in bladder development have been extensively studied [5]. However, the present results depicted in the MC regulatory network raises the hypothesis that the bladder mucosa exhibits TREs and genes whose proteins may regulate the smooth muscle phenotype (Figure 2).
Detrusor control [DC] (figure 5)
The regulatory network for the control detrusor smooth muscle suggests that Pax-3 plays a central role. In addition to Pax-3, other TREs such as: PITX2, CDP, and c-Myb were also found over-represented (figure 5).
Pax-3 was found upstream of the following transcripts: prion protein (prnp), cathepsin L (ctsl), stromal cell derived factor receptor 1 (sdfr1) [31], thrombospondin, type I domain containing 6 (thsd6), and uroplakin 1b (upk1b). Prnp seems to be involved in cell-to-cell interac-tion and its expression has been observed in germ cell dif-ferentiation during spermatogenesis [32]. Ctsl is a lysosomal proteolytic enzyme and an imbalance between
Table 4: Differential expression of selected SSH transcripts by quantitative real-time polymerase chain reaction (QRT-PCR) ***
Genes Normalized CT values log2 CT X1000000 Fold Change (Delta CT Values)*
Average (n = 3) SEM
LD LM CD CM LD LM CD CM LD LM CD CM CD/CM CM/CD LD/LM LD/CD LM/CM
Cts h 26.5 24.2 26.1 24.1 0.03 0.01 0.05 0.01 96 19 70 18 3.9 0.3 5.0 1.4 1.1 Eif4ebp2 36.5 30.4 33.7 30.9 0.62 0.07 0.07 0.05 95252 1430 13833 1974 7.0 0.1 66.6 6.9 0.7 Gst m1 23.4 19.1 23.2 18.2 0.32 0.02 0.00 0.06 11 1 9 0 29.9 0.0 19.7 1.2 1.8 Gst o1 36.0 26.9 35.5 29.8 0.14 0.17 0.56 0.06 68660 125 47023 909 51.7 0.0 550.9 1.5 0.1 Serpina3n 21.8 21.1 26.1 23.5 0.03 0.02 0.09 0.05 4 2 72 12 6.1 0.2 1.6 0.1 0.2 Sprr 2A 29.4 21.8 25.4 19.8 0.06 0.14 0.03 0.00 697 4 45 1 51.0 0.0 185.1 15.3 4.2
Upk1a 32.5 24.4 30.0 23.7 0.18 0.01 0.02 0.13 6162 23 1050 14 76.4 0.0 271.4 5.9 1.7 Upk1b 26.5 22.2 26.7 21.4 0.04 0.02 0.12 0.05 98 5 112 3 39.3 0.0 20.6 0.9 1.7 Calm2 23.2 24.0 22.2 23.8 0.11 0.09 0.04 0.11 9 17 5 14 0.3 3.0 0.6 2.0 1.2 Cnn1 32.1 33.1 27.2 31.0 0.50 0.09 0.15 0.05 4547 9400 149 2177 0.1 14.6 0.5 30.5 4.3
Smoc2 33.9 34.7 26.0 28.4 0.06 0.27 0.04 0.06 15953 27402 68 352 0.2 5.2 0.6 234.8 77.7
Bcap31 33.3 29.2 26.7 26.9 0.40 0.07 0.08 0.01 10331 627 106 127 0.8 1.2 16.5 97.6 4.9
Catenin 36.9 33.0 27.1 28.0 0.23 0.07 0.42 0.09 130085 8592 143 273 0.5 1.9 15.1 912.8 31.5
Mafb 32.1 30.1 31.8 30.5 0.65 0.10 0.34 0.44 4703 1154 3615 1570 2.3 0.4 4.1 1.3 0.7 Pls3 37.4 35.3 28.6 29.3 0.10 0.18 0.14 0.15 179012 41906 402 661 0.6 1.6 4.3 444.9 63.4
Prss11 29.9 27.9 25.8 24.5 0.05 0.03 0.06 0.00 999 259 59 23 2.5 0.4 3.9 17.1 11.0
Syn1 30.1 25.3 24.1 22.8 0.22 0.04 0.21 0.13 1148 42 18 7 2.4 0.4 27.3 65.6 5.9
Lamp2 31.6 31.1 28.1 27.8 0.21 0.14 0.05 0.01 3342 2379 285 230 1.2 0.8 1.4 11.7 10.3
Mpp1 31.0 30.0 29.2 29.5 0.44 0.11 0.11 0.19 2114 1090 632 753 0.8 1.2 1.9 3.3 1.4 Sepp1 23.0 23.9 22.0 21.6 0.06 0.03 0.08 0.05 8 15 4 3 1.4 0.7 0.6 2.0 4.8
Thsd6 28.1 28.3 28.3 28.0 0.13 0.08 0.03 0.04 293 329 338 272 1.2 0.8 0.9 0.9 1.2 IFIT3 30.4 31.2 30.8 30.9 0.08 0.00 0.12 0.05 1455 2396 1885 1988 0.9 1.1 0.6 0.8 1.2 Ifrg15 27.9 27.9 28.2 27.6 0.03 0.05 0.09 0.07 254 245 307 210 1.5 0.7 1.0 0.8 1.2 Sdfr1 24.4 25.6 24.1 24.8 0.06 0.09 0.10 0.09 23 52 18 29 0.6 1.6 0.4 1.3 1.8 Siva 26.7 25.8 27.1 25.8 0.03 0.07 0.06 0.07 110 59 147 59 2.5 0.4 1.9 0.7 1.0 Prnp 24.1 25.7 23.3 24.6 0.02 0.07 0.02 0.00 18 53 11 26 0.4 2.5 0.3 1.7 2.0
*(ratio of antilog2 of cycle threshold values) ** (bolded cells indicate values greater than 3.0)
***Female C57BL/6J mice were instilled with saline (n = 20) or LPS (n = 20). Twenty four hours after LPS instillation, mice were euthanized, the bladder was removed and placed in RNAlater™ (Ambion) for separation of the mucosa and submucosa from the detrusor smooth muscle, as described in Material and Methods. Four sample groups were obtained as follows: control mucosa (CM), control detrusor (CD), LPS-treated mucosa (LM), and LPS-treated detrusor (LD). The QRT-PCR amplifications were accomplished on an ABIPRISM 7700 using SYBRGreen I dye assay chemistry
All samples were run in triplicate with the appropriate single QRT-PCR controls (no reverse transcriptase and no template). From the QRT-PCR data, an average cycle threshold (Ct) value was calculated from the triplicate reactions. Averaged Ct values were then normalized (to adjust for different amounts of cDNA within each reaction) to the exongenous control gene, RCA. The relative expression level of each transcript within each sample group (CD, CM, LD, and LM) was determined by calculating the ratio of the antilog2 of the delta Ct values.
In addition to ctsl, the detrusor also presents ctsh under the control of c-Myb. Interestingly, thsd is involved in bladder cancer development [34] and is a target for methylation [35]. In addition, thsd has been described as inhibitor of angiogenesis. Finally, upk1b gene is highly expressed in normal human urothelium and its mRNA was undetecta-ble or markedly reduced in bladder carcinoma [36].
Interestingly, the control detrusor normally expresses genes in the Pax-3 pathway that maintain neural progeni-tor cells [37] and myoblasts [38] undifferentiated. There-fore, our data suggests that Pax-3-regulated suppression of neural development in control detrusor changed
substan-tially during inflammation and genes involved in neuro-nal development such as syn were found to be up-regulated. The later implies that detrusor instability may be a consequence of alterations in Pax-3 pathway leading to increased maturation of neural progenitor cells within the bladder smooth muscle.
Mucosa inflamed versus control [MIC]. (figure 3)
Overall experimental design
Figure 1
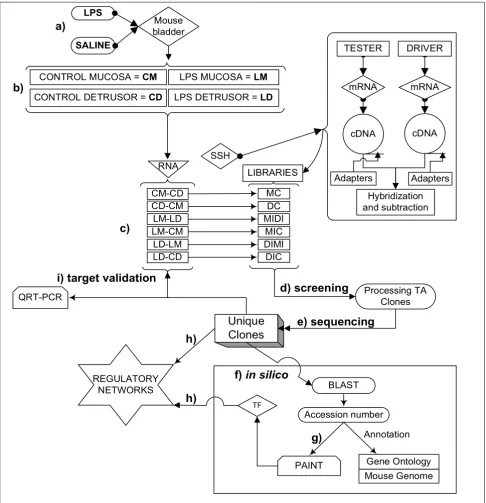
Overall experimental design. a) A well established animal model of LPS- induced bladder inflammation was used. b) RNA was extracted from isolated detrusor muscle and mucosa layers. c) Extracted RNA was used to generate 6 different libraries by suppressive subtraction hybridization (SSH) in order to determine bladder tissue- and treatment- dependent transcripts. d) Transcripts were then screened and e) Sequenced f) All unique transcripts were fully annotated by querying public (PubMed, Gene Ontology, Mouse Genome [108]) and private (Transfac professional [109]) databases. g) The accession number of each SSH-selected transcript was uploaded into the PAINT 3.3 feasnet builder [110] to query the Transfac database [109]. h) A reg-ulatory network for each library was originated by a combination of SSH-selected transcripts and over-represented TF (0 < p < 0.05) in the matrix when compared to the PAINT database reference equivalent to the all the genes in the Ensembl anno-tated genome (Figures 2, 3, 4, 5, 6, 7). i) Unique clones were validated by QRT-PCR.
SSH
Processing TA Clones
PAINT QRT-PCR
Hybridization and subtraction Adapters
RNA
LIBRARIES
CM-CD MC
CD-CM DC
LM-LD MIDI
LM-CM MIC
LD-LM DIMI
LD-CD DIC
Adapters
BLAST
Annotation Accession number REGULATORY
NETWORKS
Mouse Genome Gene Ontology
TF
Unique
Clones
c)
d) screening
e) sequencing
f)
in silico
g)
h)
h)
i) target validation
LPS
TESTER
cDNA
a)
mRNA CONTROL MUCOSA = CM
SALINE
CONTROL DETRUSOR = CD
DRIVER
b)
Mouse bladder
mRNA
cDNA LPS MUCOSA = LM
independent identification of NF-κB [39], which is known to play a key role in bladder inflammation [40] strength-ens confidence in the identification of novel pathways.
Three transcripts were found downstream of NF-κB: cat-enin (cadherin-associated protein, delta 1), cox7b, and pIs3
(plastin 3 T-isoform). Regarding catenin, others have described its presence in the bladder mucosa and in par-ticular in the urothelium [41]. Indeed, alpha1-catenin was reported to be reduced in bladder urothelial cells treated with anti-proliferative factor [42] which make this tran-script a possible target in cystitis. Moreover, p120-catenin is frequently altered and/or lost in tumors of bladder [43]. Finally, bladder cancers harboring a beta-catenin mutation may represent aggressive biological behavior with enhanced proliferating activity [44]. Cox7b encodes cyto-chrome C oxidase, subunit VIIb which is the terminal component of the mitochondrial respiratory chain and catalyzes the electron transfer from reduced cytochrome C
to oxygen. Finally, pls3 was found by differential display to have increased expression in cisplatin-resistant human cancer cells [45].
In addition to NF-κB, MIC also had SRF that along with several zinc finger TFs (SF-1 [Steroidogenic factor 1]; Gfi-1 (growth factor independent Gfi-1); ik-3 (Ikaros 3); and vMaf [basic region leucine zipper]), drive the activity of actg1. Actg1 is a highly conserved protein involved in various types of cell motility, and maintenance of the cytoskele-ton.
The MIC regulatory network also includes the following unique transcripts: smoc2 (secreted modular calcium-binding protein 2), amcq (adult male corpora quad-rigemina cDNA; RIKEN clone:B230340L02), prss11 (Ser-ine protease 11), and ifit3 (Interferon-induced protein with tetratricopeptide repeats 3). Smoc2 is a widespread glycoprotein with a calcium-dependent conformation [46]. Prss11 encodes a secreted trypsin (HtrA1) that regu-lates the availability of insulin-like growth factors (IGFs) by cleaving IGF-binding proteins and therefore, may func-tion as a regulator of cell growth [47]. HtrA is involved in stress response pathways [48]. Interestingly, down-regula-tion of prss11 expression may be an indicator of melanoma progression [49].
Ifit3 was originally cloned from a cDNA library prepared from the murine cell line, RAW 264.7, after bacterial LPS stimulation [50]. Although it is a transcript induced by IFN [51], its function is still unknown.
Grp58 encodes a ubiquitously expressed chaperone pro-tein that resides in the endoplasmic reticulum and is part of the protein folding machinery [52]. It is likely that
grp58 is involved in the oncogenic transformation[53] since expression analysis revealed an up-regulation of
grp58 in breast, uterus, lung, and stomach tumors [54].
Together these results confirmed that the bladder mucosa expresses unique transcripts involved in cell growth, motility, and cytoskeleton, protein folding, and proteases. Some of these transcripts have been described to be altered in cystitis as well as in LPS-induced bladder inflammation. However, the most striking result was that of 6 different networks, the MIC library was the only one to have over-representation of NF-κB.
Mucosa inflamed versus detrusor inflamed [MIDI], (figure 4)
The question being answered by this experiment was whether or not the bladder mucosa sets the stage for LPS-induced inflammatory responses by up-regulating a unique set of genes and TFs distinct from the detrusor muscle.
Transcripts and TREs over-represented in the control mucosa when compared to control detrusor (MC)
Figure 2
Transcripts and TREs over-represented in the con-trol mucosa when compared to concon-trol detrusor (MC). The regulatory network was determined by a combi-nation of SSH-selected transcripts (green) and PAINT 3.3 query of transcription factor database (TRANSFAC). PAINT 3.3 was employed to examine 2000 base pairs of regulatory region upstream of the transcriptional start site of each dif-ferentially expressed transcript detected with the SSH. Gen-bank accession numbers were used as the gene identifiers in PAINT test files. Individual elements of the matrix are colored by the significance p-values. Over-representation in the matrix when compared to the reference (all TFs in the PAINT database) is indicated in orange (0 < p < = 0.01) or green (0.01 < p < 0.05). For a detailed origin of each library please see Figure 1 and Material and methods.
YY1
YY1
sc1
sc1
mylc2b
mylc2b
MC
MC
GABP
GABP
E2F
E2F
ambladder
ambladder
cnn1
cnn1
SP3
SP3
SF
SF--11 sac1sac1
CRE
In terms of TFs, the upstream stimulatory factor (USF) was the most significantly over-represented (p < 0.001) and driving unique transcripts (figure 4). USF dimerizes to reg-ulate transcription through E-box motifs in target genes. Although widely expressed, they can mediate tissue-spe-cific transcripts. USF is stimulated by glucose in murine mesangial cells, binds to TGF-β1 promoter, contributes to TGF-β1 expression, and may play a role in diabetes-related gene regulation in the kidney [55]. Others have shown that USF binding activity is enhanced in response to LPS [56].
Another interesting TF was the liver X-activated receptors (LXR) found upstream of several transcripts bearing USF sequence. LXR is a member of the nuclear receptor super-family [57] is a negative regulator of macrophage inflam-matory gene expression [58], and a putative therapeutic
agent for the treatment of inflammation [58], diabetes [59], and neurodegenerative diseases [57,58,60].
LIM-only proteins (LMO), which consist of LMO1, LMO2, LMO3, and LMO4, are involved in cell fate deter-mination and differentiation during embryonic develop-ment [61]. LMO2 was originally identified through its involvement in T-cell leukemia and subsequently shown to be critical for normal hematopoietic and endothelial development [61]. Accumulating evidence suggests that LMO1 and LMO2 act as oncogenic proteins in T-cell acute lymphoblastic leukemia, whereas LMO4 has recently been implicated in the genesis of breast cancer[61].
MAZ (Myc-associated zinc finger protein), also known as serum amyloid A-activating transcription factor-1 (SAF-1), plays a major role in regulating transcription of several inflammation-responsive genes, including matrix metal-loproteinase-1 (81), the mouse mast cell protease (mMCP)-6 [62], and function as growth suppressor in fibroblasts [63]. SAF-1 transgenic mice are prone to develop a severe form of inflammation-induced arthritis [64]. MAZ is upstream of Aplp2 which is a key regulator of structure and function of developing neuromuscular synapses [65].
In terms of unique transcripts isolated from the MIDI library, our results indicate that transcripts such as zfp364
(zinc finger protein 364, also known as rab7) and sir2 are downstream of series of TFs including: USF, LXR, DEAF1, MAZ, and Lmo2 complex (figure 4). Sir2 gene encodes a member of the sirtuin family of proteins which are NAD-dependent histone/protein deacetylases [66]. Zfp364 is a member of the Rab family of small G proteins, and regu-lates intracellular vesicle traffic to late endosomes [67]. Another unique transcript was the androgen-regulated
tmprss2 protease [68] known to be expressed in urogenital tissues [69]. Tmprss2 has gained interest owing to its highly localized expression in the prostate and its over-expression in neoplastic prostate epithelium. Once acti-vated, the serine protease domain of tmprss2 is released from the cell surface into the extracellular space and acti-vates PAR (protease-activated receptor)-2 that has a role in prostate cancer and tumor metastasis [70]. Among the proteins correlating with cytoskeleton dynamics, our SSH identified a transcript (wdr1) encoding a 67-kDa WD40 repeat protein 1 which is the vertebrate homologue of actin-interacting protein 1 [71]. Wdr1 is involved in actin dynamics and seems to be required to induce cell mor-phologic changes, especially mitotic cell rounding [72]. Others have shown that wdr1 was found upregulated in the lung [73] and cell lines [74] following exposure to nickel oxide-induced carinogenesis. Finally, MIDI library also contained a RIKEN cDNA 2310015N07 gene that was
Transcripts and TREs over-represented in the mucosa inflamed when compared to control mucosa (MIC)
Figure 3
Transcripts and TREs over-represented in the mucosa inflamed when compared to control mucosa (MIC). The regulatory network was determined by a combi-nation of SSH-selected transcripts (green) and PAINT 3.3 query of transcription factor database (TRANSFAC). PAINT 3.3 was employed to examine 2000 base pairs of regulatory region upstream of the transcriptional start site of each dif-ferentially expressed transcript detected with the SSH. Gen-bank accession numbers were used as the gene identifiers in PAINT test files. Individual elements of the matrix are colored by the significance p-values. Over-representation in the matrix when compared to the reference (all TFs in the PAINT database) is indicated in orange (0 < p < = 0.01) or green (0.01 < p < 0.05). For a detailed origin of each library please see Figure 1 and Material and methods.
NF
NFNNBB MAJOR TMAJOR T--AA
HMX3
HMX3
actg1
actg1 MIC
MIC
ELK
ELK--11
CCAAT BOX
CCAAT BOX TCF11TCF11
SRF
SRF
VMAF
VMAF
IK
IK--33
GFI
GFI--11 SF
SF--11
ifit3
ifit3
prss11
prss11
pls3
pls3 catenincatenin grp58grp58
smoc2
smoc2
ctsl
ctsl cox7bcox7b
ctse
described to be isolated from developing mouse libraries but no function yet has been attributed [75].
Interestingly, a comparison between MIDI and DIMI libraries indicates that both share LXR as a TRE. The major difference between these two libraries was found down-stream LXR activation. In the inflamed mucosa, LXR pref-erentially activates zfp364 and tmprrs2 whereas in the inflamed detrusor LXR was found as a co-modulator of
actg2.
In conclusion, the mucosa regulatory network presents USF in a central position raising the hypothesis that USF-target promoters such as the TGF-β1 promoter are involved in the mucosal response to inflammation and whether mucosa inflammation follows similar diabetes-related mucosal gene expression.
Detrusor inflamed versus detrusor control [DIC], (figure 6) The regulatory network of the detrusor muscle, inflamed versus control, selected the following transcripts: syn1
(Synapsin I or ribosomal protein S15a), siva (CD27-bind-ing protein), and eif4ebp2 (negative regulation of transla-tional initiation), (figure 6).
Syn1 is a member of the synapsin gene family which is a neuron-specific phosphoprotein of small synaptic vesi-cles.Syn1 has been mapped to an evolutionarily conserved linkage group composed of: araf1, syn1, timp, and proper-din located at human chromosome Xp11.2 [76] and mouse chromosome X [77]. Of interest, araf1 is a proto-oncogene which is predominantly expressed in mouse urogenital tissues [77]. In contrast, siva has an important role in the apoptotic pathway induced by the CD27 anti-gen. Others have described that siva is a direct transcrip-tional target for both tumor suppressors, p53 and E2F1 [78]. Finally, the eukaryotic initiation factor eIF4E and eIF4E-binding proteins (4E-BPs) control the initiation of protein synthesis and are part of a translational signaling pathway sensitive to insulin [79] and rapamycin [80]. Changes in the state of phosphorylation of eIF4E and 4E-BPs occur at an early stage of apoptosis [81]. Interestingly, eIF4E selectively enhances the translation of powerful angiogenic factors such as FGF-2 and VEGF [82] and therefore may have a role in oncogenesis [82] as well as inflammation.
Over represented TFs in DIC regulatory network were NRSF (Kruppel-type zinc-finger transcriptional repressor RE1-silencing transcription factor [REST]; also known as the neuron-restrictive silencing factor), CREB/CRE-BP1, E2F-1, and Evi-1.
CREB/CRE-BP1, also called transcription factor ATF-2, binds to the cAMP response element and its activity is enhanced after phosphorylation by stress-activated pro-tein kinases such as c-Jun N-terminal kinase and p38. ATF-2 plays a central role in TGFβ signaling by acting as a com-mon nuclear target of both Smad and TAK1 pathways [83].
Nrf-1 (nuclear respiratory factor 1) regulates expression of nuclear-encoded mitochondrial genes and it was shown to be part of the response to LPS in rats [84].
FOXp3 belongs to the forkhead gene family which com-prises a diverse group of "winged-helix" TFs with impor-tant roles in development, metabolism, cancer and aging [85]. Recently, several forkhead genes have been demon-strated to play critical roles in lymphocyte development and effector function [85]. FoxP3 is a potential target for treatment of experimental chronic inflammatory renal disease [86] and type I diabetes [87]. In addition, both FOXp3 and NRSF seems to be downstream of Wnt-Friz-zled signaling [88] which was recently proposed to partic-ipate in the pathogenesis of interstitial cystitis [89].
Transcripts and TREs over-represented in the mucosa inflamed when compared to detrusor inflamed (MIDI)
Figure 4
Transcripts and TREs over-represented in the mucosa inflamed when compared to detrusor inflamed (MIDI). The regulatory network was determined by a combination of SSH-selected transcripts (green) and PAINT 3.3 query of transcription factor database (TRANS-FAC). PAINT 3.3 was employed to examine 2000 base pairs of regulatory region upstream of the transcriptional start site of each differentially expressed transcript detected with the SSH. Genbank accession numbers were used as the gene identifiers in PAINT test files. Individual elements of the matrix are colored by the significance p-values. Over-repre-sentation in the matrix when compared to the reference (all TFs in the PAINT database) is indicated in orange (0 < p < = 0.01) or green (0.01<p < 0.05).
USF
USF
aplp2
aplp2
MIDI MIDI
DEAF1
DEAF1
CORE
CORE--BINDINGBINDING
KROX
KROX
LMO2 COMPLEX
LMO2 COMPLEX
sir2
sir2
wdr1
wdr1
2310015N07
2310015N07
zfp354
zfp354
tmprss2
tmprss2
MAZ
MAZ
LXR
E2F, E2F-1, and Rb-E2F-1 belong to a family of TFs impli-cated in the regulation of cell proliferation and their bind-ing sites are present in the promoters of several growth-regulating genes. E2F family members are functionally regulated, in part, by complex formation with one or more members of the nuclear pocket protein family such as the retinoblastoma protein (Rb) and play a role in neu-ronal development [90] by acting as negative regulator of cell proliferation. The interplay between Rb and E2F is critical for proper cell cycle progression [91]. Of interest, E2F-1 has a growth-promoting effect in bladder superfi-cial TCC [92].
ATF-3 (activating transcription factor 3) is transcriptional repressor involved in survival and regeneration of sensory neurons [93,94] that responds to insulin [95]. ATF3 is also a novel stress-activated regulator of p53 protein stability/ function providing the cell with a means of responding to a wide range of environmental insults [96]. In addition,
ATF3 represents a novel mechanism in which anti-inflam-matory drugs exert their anti-invasive activity [97].
The proposed role of nrsf/rest is that of a transcriptional silencer that restricts neuronal gene expression to the nervous system by silencing their expression in non-neu-ral tissues [98]. Interestingly, loss of nrst function in human prostate carcinoma cells is associated with neu-roendocrine phenotype, tumor progression, and andro-gen independence [99]. Others investigators indicated that nrst also modulates the cholinergic gene locus [100,101] which may have some implication in detrusor instability. Recently, it was proposed that activation of the
rest/nrsf target genes overrides muscle differentiation path-ways and converted myoblasts to a physiologically active neuronal phenotype [102]. It remains to be determined whether nrst promotes the same transformation in the inflamed detrusor muscle. The latter would explain the hyperactivity of detrusor muscle observed in over-active bladder disorders such as obstruction, incontinence, and inflammation.
In conclusion two major networks are proposed to be active in the detrusor inflamed when compared to con-trol. One containing a neuron-specific phosphoprotein of small synaptic vesicles (syn) and the other an important protein of apoptotic pathway (siva). In both cases, analy-sis of the intense upstream promoter network leads us to the hypothesis that both genes represent a common downstream target of several pro-inflammatory stimuli.
Detrusor inflamed versus mucosa inflamed [DIMI], (figure 7)
The question being answered by this experiment was whether or not the inflamed detrusor muscle expresses unique transcripts and TFs distinct from the bladder mucosa.
Two major pathways could be constructed with the com-bination of SSH and PAINT results. The first involves key smooth muscle proteins, a myosin light chain encoded by
my19 and gamma actin encoded by actg2. Gamma actins are highly conserved proteins that are involved in various types of cell motility, and maintenance of the cytoskele-ton. In addition, a role for smooth muscle alpha actin in force generation by the urinary bladder has been sug-gested [103]. Several TREs upstream of actg 2 and my19
were over-represented in MIDI, including LXR which was described above, SRF, COUP, Pax-9, CP2, and RFX1.
A second pathway involved the transcripts elp3, gus, and ddx3 and two TFs COMP1 and IRF. Ddx3 is a putative RNA helicase and a member of a highly conserved DEAD box subclass. RNA helicases are highly conserved enzymes involved in transcription, splicing, and translation [104].
Transcripts and TREs over-represented in the control detru-sor when compared to control mucosa (DC)
Figure 5
Transcripts and TREs over-represented in the con-trol detrusor when compared to concon-trol mucosa (DC). The regulatory network was determined by a combi-nation of SSH-selected transcripts (green) and PAINT 3.3 query of transcription factor database (TRANSFAC). PAINT 3.3 was employed to examine 2000 base pairs of regulatory region upstream of the transcriptional start site of each dif-ferentially expressed transcript detected with the SSH. Gen-bank accession numbers were used as the gene identifiers in PAINT test files. Individual elements of the matrix are colored by the significance p-values. Over-representation in the matrix when compared to the reference (all TFs in the PAINT database) is indicated in orange (0 < p < = 0.01) or green (0.01 < p < 0.05). For a detailed origin of each library please see Figure 1 and Material and methods.
PAX
PAX--33
PITX2
PITX2 CDPCDP
C
C--MYBMYB
ctsl
ctsl
gstm1
gstm1
thsd6
thsd6 upk1bupk1b
ctsh
ctsh
sdfr1
sdfr1
prpn
There are several examples of the involvement of RNA hel-icases in differentiation of germ cells, particularly in sper-matogenesis. Upstream of ddx3, PAINT selected a TF that cooperates with myogenic proteins (COMP1) and Inter-feron Regulatory Factor (IRF). Transcription of IRF is syn-ergistically activated by products of inflammation such as IFNγ and TNFα [105].
Two other transcripts were found downstream of COMP1:
Gus (beta-glucoronidase) and elp3. Gus is a sensitive indi-cator LPS activation of macrophages. Elp3 is one of the sub units of the elongator complex, an acetyltransferase important for normal histone acetylation involved in elongation of RNA polymerase II transcription.
By comparing the inflamed detrusor and mucosa (DIMI), the fundamental difference observed was the up-regula-tion in the detrusor of genes and TFs related to smooth muscle function. It is fair to propose that this network could underlie detrusor instability during inflammation.
Conclusion
We here present a novel approach to understanding the bladder response to inflammation as a system. By using SSH, low abundance, differentially expressed transcripts could be detected that probably would have been lost in the background "noise" of a microarray study. That these genes were, in fact, key players was shown by the remark-able concordance in the transcriptional regulatory ele-ments identified and by target validation with QRT-PCR. We suggest that the results identified key players govern-ing the normal growth and differentiation of bladder mucosa and urothelium as well as the cross-communica-tion of these layers during inflammacross-communica-tion resulting from a number of pathologic processes.
As genes encoding DNA-binding TFs are the largest class of genes involved in human oncogenesis, it was obvious that in several instances the vast amount of information was related to cancer, in general and to bladder carci-noma, in particular. Interestingly, some of the TFs and their correlated downstream transcripts originally described to be involved in organogenesis were also acti-vated during inflammation. The implications of these findings may represent one more link between inflamma-tion and cancer.
The networks here described could well represent key tar-gets for development of novel drugs for treatment of blad-der diseases.
Methods
AnimalsTen to twelve-week old female C57BL/6J mice were used in these experiments that were performed in conformity with the "Guiding Principles for Research Involving Ani-mals and Human Beings (OUHSC Animal Care & Use Committee protocol #002-109).
Induction of inflammation
Acute inflammation was induced by instillation of LPS into the mouse bladder, as described previously [8,9,106]. Female mice were anesthetized (ketamine 200 mg/kg and xylazine 2.5 mg/kg, i.p.), then transurethrally catheterized (24 Ga.; 3/4 in; Angiocath, Becton Dickson, Sandy, Utah), and the urine was drained by applying slight digital pres-sure to the lower abdomen. Because the bladder of 10-week old mice has an average capacity of 250 µl, the uri-nary bladders were instilled with 200 µl of one of the fol-lowing substances: pyrogen-free saline (control) or
Escherichia coli LPS strain 055:B5 (Sigma, St. Louis, MO; 100 µg/ml),) (figure 1a). Substances were infused at a slow rate to avoid trauma and vesicoureteral reflux. To ensure consistent contact of substances with the bladder, infusion was repeated twice within a 1-hour interval and a 1-ml syringe was maintained in the catheter end during
Transcripts and TREs over-represented in the detrusor inflamed when compared to detrusor control (DIC)
Figure 6
Transcripts and TREs over-represented in the detru-sor inflamed when compared to detrudetru-sor control (DIC). The regulatory network was determined by a combi-nation of SSH-selected transcripts (green) and PAINT 3.3 query of transcription factor database (TRANSFAC). PAINT 3.3 was employed to examine 2000 base pairs of regulatory region upstream of the transcriptional start site of each dif-ferentially expressed transcript detected with the SSH. Gen-bank accession numbers were used as the gene identifiers in PAINT test files. Individual elements of the matrix are colored by the significance p-values. Over-representation in the matrix when compared to the reference (all TFs in the PAINT database) is indicated in orange (0 < p < = 0.01) or green (0.01 < p < 0.05). For a detailed origin of each library please see Figure 1 and Material and methods.
CREB/CRE
CREB/CRE--BP1BP1
RB:E2F
RB:E2F--11
EF2
EF2
eif4ebp2
eif4ebp2
syn1
syn1
siva
siva DIC
DIC
NRSF
NRSF
FOXP3
FOXP3
ATF
ATF--22 NRFNRF--11
E2F
E2F--11 EVIEVI--11
ATF
this period. The catheter was removed, and mice were allowed to void normally. Twenty-four hours after instil-lation, mice were euthanized with pentobarbital (100 mg/ kg, i.p.) and bladders were removed rapidly.
Tissue layers – separating the mucosa from detrusor Immediately after removal from the animal, bladders were placed in RNAlater™ (Ambion) and visualized under a dissecting microscope (Nikon SMZ 1500). The detrusor smooth muscle was separated by blunt dissection away from the mucosa which contained the epithelium and sub-epithelial layers, (see Additional file 1).
Suppression subtractive hybridization (SSH) (9)
A total of six libraries were obtained by SSH (figure 1c). In order to standardize the names of the groups and to cor-relate with delta CT values (see below), the SSH libraries were named after the tester minus driver. The first library (MC) was obtained by using the mucosa removed from control saline-treated mice (CM) as tester and the respec-tive detrusor smooth muscle (CD) as driver. The resultant
subtraction MC was supposed to contain genes preferen-tially expressed in the control mucosa. The second library was the reverse of MC and therefore, CD was used as tester
and CM as driver and will contain genes preferentially expressed in the detrusor smooth muscle of control mice (DC). The other 4 libraries were obtained to investigate genes whose expression was altered during LPS-induced inflammation (figure 1c). The samples used for each SSH were obtained by pooling RNA from 20 individual mice. The pooling was necessary in order to obtain enough RNA from each layer without amplification.
Construction of subtractive cDNA libraries
mRNA was isolated from total RNA using Poly(A) Quick mRNA Isolation Kit (Stratagene, La Jolla, CA) according to the manufacture's protocol. To compare the two popula-tions of resulting cDNA the method of SSH was per-formed using PCR-Select cDNA Subtraction Kit (BD Biosciences – Clontech, Palo Alto, CA), as described by Diatchenko and colleagues [18]. This method selectively amplifies differentially expressed sequences, and the gen-eration of high- and low-abundance sequences is equal-ized during the first hybridization. The PCR allows amplification of equalized differentially expressed sequences. Each step of the cDNA synthesis and subtrac-tive hybridization procedure was monitored using the positive control samples provided by the manufacturer. We verified the efficiency of subtraction by PCR analysis by comparing GAPDH levels in subtracted and un-sub-tracted cDNA using the method and GAPDH primers pro-vided by the manufacturer. For analysis of efficiency, please see Additional file 2. For analysis of ligation, please see Additional file 3. For the analysis of PCR products, please see Additional file 4. For PCR analysis and subtrac-tion efficiency, please see Addisubtrac-tional file 5.
Next, cDNAs from the testers and drivers were digested with RsaI. To select tissue- and treatment-specific tran-scripts, PCR adapters were ligated to the tester pool popu-lation. The tester cDNA pool was then hybridized with excess cDNAs from the driver pool. After hybridization suppression, PCR using primers specific for the tester PCR adapters selectively amplified differentially expressed transcripts.
Screening the clones (plating out, growing up and analyzing the PCR clones), (figure 1d)
After the PCR subtraction, the amplification products were cloned into the pCR 2.1 plasmid of the TA cloning kit (Invitrogen). Ligated DNA was transformed by heat shock in 100 µl of INVαF competent E. coli cells. Colonies were grown overnight at 37°C on Luria broth agar plates containing ampicillin, X-gal, and isopropyl-B-D-thioga-lactopyranoside for blue/white colony selection. White colonies were isolated and grown individually in 2 ml of
Transcripts and TREs over-represented in the detrusor inflamed when compared to mucosa inflamed (DIMI)
Figure 7
Transcripts and TREs over-represented in the detru-sor inflamed when compared to mucosa inflamed (DIMI). The regulatory network was determined by a com-bination of SSH-selected transcripts (green) and PAINT 3.3 query of transcription factor database (TRANSFAC). PAINT 3.3 was employed to examine 2000 base pairs of regulatory region upstream of the transcriptional start site of each dif-ferentially expressed transcript detected with the SSH. Gen-bank accession numbers were used as the gene identifiers in PAINT test files. Individual elements of the matrix are colored by the significance p-values. Over-representation in the matrix when compared to the reference (all TFs in the PAINT database) is indicated in orange (0 < p < = 0.01) or green (0.01 < p < 0.05). For a detailed origin of each library please see Figure 1 and Material and methods.
SRF_05
SRF_05
COMP1
COMP1
MY19
MY19
actg2
actg2
elp3
elp3
DIMI DIMI
LXR
LXR
PAX
PAX--99
CP2
CP2
RFX1
RFX1
IRF
IRF
SRF_06
SRF_06
COUP
COUP
gus
gus
ddx3
LB medium containing ampicillin for 16 h. After plasmid DNA isolation (Wizard® Plus SV Minipreps DNA
Purifica-tion System – Promega), digesPurifica-tion was performed using
Xba I and BamH I, and the products analyzed in 1% agar-ose gels. Positive clones (representing fragments larger than the original polylinker in the cloning vector) were sent to a sequencing service (figure 1e), and sequences were submitted for a BLAST analysis in GenBank for iden-tification and annotation was done by searching the gene ontology[16], figure 1f.
Tissue- and treatment-specific transcription factors After annotation, a bioinformatics approach to identify functionally relevant putative transcriptional regulatory elements (TREs) for all SSH-selected transcripts was used (figure 1g). We used the Promoter Analysis and Interac-tion Network Toolset [PAINT [13]], available online [107], to integrate functional genomics information from SSH-derived gene expression data with the genomic sequence and TRE data to derive hypotheses about rele-vant transcriptional regulatory networks. PAINT uses the TRANSFAC® database [14] of transcription factors and
position weight matrix descriptions of cis-acting sequences and an associated pattern matching tool MATCH [15] to identify statistically over-represented reg-ulatory sites in 5' upstream sequences of related genes. This information provides a substantially pruned list of TFs regulating tissue- and treatment-specific genes that were identified by SSH. Briefly, the accession numbers of all the SSH-selected transcripts were used as an input gene list in PAINT. Up to 2000 base pairs of 5' upstream sequences were analyzed for the presence of TREs using a MATCH/TRANSFAC setting to minimize false positives and filtering the results further in PAINT to consider only those hits with 100% match to the 5 bp core TRE sequence. The interaction matrix contained 79 genes and 162 TREs.
PAINT can analyze the interaction matrix for over-repre-sented TREs in subsets/clusters of related genes, typically grouped based on gene expression data. The library for each transcript (MC, DC, MI, MIDI, DI and DIMI) was considered as the cluster label and provided as the Gene-Cluster information in the PAINT analysis and visualiza-tion step. The TRE over-representavisualiza-tion in PAINT is calcu-lated as the hyper-geometric probability of the observed number of TREs in a given cluster as compared to that in randomly selected gene clusters from a 'reference' list. In this study, all the genes in the genome as annotated in Ensembl were used to construct the interaction matrix for use as the reference. To construct the hypothesized regula-tory networks, TFs were chosen based on the probability of over-representation (p < 0.05) in any of the six gene groups as compared to all the genes in the genome (or equivalently in PAINT promoter database).
Target validation by QRT-PCR (figure 1i) RNA isolation and cDNA synthesis
An additional 40 C57BL/6J female mice, ten to twelve-weeks old underwent the same intravesical treatment as described above [LPS, (n = 20 mice) and saline (n = 20 mice)]. Twenty four hours after LPS instillation, mice were euthanized, the bladder was removed and placed in RNAlater™ (Ambion) for separation of the mucosa and submucosa from the detrusor smooth muscle, as described above. Four sample groups were obtained as follows: control mucosa (CM), control detrusor (CD), LPS-treated mucosa (LM), and LPS-treated detrusor (LD). Bladders were pooled and homogenized in Ultraspec RNA solution (Biotecx Laboratories, Houston, TX) for isolation and purification of total RNA used for QRT-PCR. High RNA quality from each of these four groups was verified by capillary gel electrophoresis using an Agilent 2100 Bio-analyzer (Agilent Technologies, Inc, Palo Alto, CA). RNA concentration was determined by spectrophotometry using a NanoDrop® ND-1000 UV-Vis Spectrophotometer
(Nano Drop Technologies, Wilmington, DE). Subse-quently, this total RNA was used as a template for each of the first-strand cDNA syntheses. Prior to cDNA synthesis, an exogenous standard of A. thaliana (RCA) mRNA (Strat-agene, L Jolla, CA, USA) was added (0.1 ng) to each CM, CD, LM, and LD total RNA (2 µg) sample for normaliza-tion of succeeding gene expression data. RNA was reverse-transcribed according to the Omniscript RT™ kit (Qiagen, Valencia, CA) instructions and subsequently purified using the Montage PCR 96-well cleanup plate (Millipore, Billerica, MA). Prior to the PCR, primer pairs were designed utilizing both Primer Express® (ABI, Foster City,
CA) and NetPrimer (PREMIER Biosoft International, Palo Alto, CA) software. Primers were designed according to the general guidelines outlined in the Primer Express®
User Bulletin. Details of the primers and the Genebank accession numbers are given in Table 1. The designed primers shared 100% homology with the target sequence but no significant homology with other sequences.
The QRT-PCR amplifications were accomplished on an ABI®PRISM 7700 using SYBR®Green I dye assay chemistry.
A 15 µL PCR assay for each gene of interest consisted of 7.5 µL of 2X SYBR®Green PCR mix (Applied Biosystems