Design, implementation and tuning of an irrigation canal system
SCADA
Manuel Rijo
(Escola de Ciência e Tecnologia, Universidade de Évora, Instituto de Ciências Agrárias e Ambientais Mediterrânicas, Apartado 94, 7002-554 Évora, Portugal)
Abstract: The paper presents the design, implementation and field tuning of the (SCADA) system of a Portuguese irrigation canal network upstream controlled by AMIL radial gates and equipped with other Neyrpic devices. In addition to the irrigation district and its main hydraulic system, the paper also presents SCADA architecture, including two synoptics, and their remote terminal units (monitoring and controlling as well as monitoring units). The SCADA manual controllers – direct, gate position and gate flow controllers - are defined for the intakes of main canals and main distributors, in order to permit a pre-defined flow value or a daily flow schedule achievement. SCADA also monitors outflows from the main canals and main distributors - the most important canal-top-side weirs and terminal weirs of the canal. The developed manual gate flow controllers were tuned in the field using collected data readings from two types of acoustic Doppler flow meters. The field procedures for tuning the flow controllers and the obtained parameter values are also presented.
Keywords: canal control, flow controller, flow equations, irrigation canal, local upstream control, SCADA system
Citation: Rijo, M. 2017. Design, implementation and tuning of an irrigation canal system SCADA. Agricultural Engineering
International: CIGR Journal, 19(2): 1–11.
1 Introduction
Irrigation is the largest water user in the world, using up to 85% of the available fresh water in the developing countries (Plusquellec et al., 1994). The same issue happens in Portugal, where 87% of the available fresh water volumes are used in the agriculture, only with an efficiency of 58% (the ratio of the useful water volumes to the used water volumes) (INAG, 2001).
The stablished user-payer principle in the European Union begins to press the agriculture and the irrigation water prices begin to rise. Nowadays, in Portugal, all the water users have to pay a water resource tax, considering the used water volume. The immediate consequence for irrigation is that present water use efficiencies have to increase drastically and the water management must be
Received date: 2016-09-14 Accepted date: 2017-01-19 Biographies: Manuel Rijo, Associate Professor, Agricultural
Department, Escola de Ciência e Tecnologia, Universidade de Évora, Apartado 94, 7002-554 Évora, Portugal. Phone: +351266740800, Email: [email protected].
moved rigorously. The agriculture has to be developed and intelligent management and operation of the irrigation systems have to be implemented, in order to achieve higher water savings and desirably better water delivery service within a short period of time.
Due to technical and economical reasons, the large untreated water conveyance and delivery networks are usually open-channel systems. In Portugal, 95% of the governmental irrigation projects were built between the 40’s and the 70’s of the last century. In these irrigation districts, the water is conveyed and delivered through an open concrete-lined canal system and the canals are upstream controlled by AMIL gates or duckbill weirs (Kraatz and Mahajan, 1975).
rate changes are made at turnouts, the system will end up with an excess or deficit of water, especially at downstream end of canals (Rijo, 2010).
In Portugal, all these canals operate on an arranged delivery schedule basis (Clemmens, 1987), with flow rate adjustments being approved in advance by the water-master. Water delivery gained flexibility, but the daily operation of the canals became much more complex, difficult and inefficient in the water use. Operational and controlling water losses in the canals (all of them concrete-lined, as mentioned) became significant, reaching values of 50% of the inflow water volumes (Rijo and Almeida, 1993). Most of these systems are still empirically operated according to personal judgments.
Operating a conventional upstream controlled canal system is a difficult and demanding task. Control, reporting, historical data, rising costs of energy, limited water supplies and labour represent only a few management concerns. To overcome some of these problems, a few irrigation districts are considering replacing manual and outdated telemetry systems by Supervisory Control and Data Acquisition (SCADA) systems which are based on state-of-the-art computer.
There are probably three major reasons why irrigation districts are investing in SCADA systems: i) to retire “art” and to shift to an industrial control process, in which real-time information at a central location is constantly used to make appropriate decisions; reducing “art” from the process fulfils the need and desire to reduce inflow; to provide better customer service (adding more flexibility to water delivery); to reduce pumping costs; to conserve water; to remove the mystery of operation details, so that new employees can be easily trained, and so that managers can establish clear and measurable performance guidelines for canal/ pipeline operators; to improve water delivery to farm turnouts which contributes to better on-farm efficiency; ii) there is often a need for automation that requires computers at remote locations; because it is the nature of computers, electronics, sensors and software to have occasional problems, it is prudent to remotely monitor their performance at such sites (Burt, 2005); iii) some districts have key trouble spots where water levels historically get too high, or flow rates get too
low or high; SCADA provides a mean to remotely monitor those sites in real-time, eliminating tremendous labour, distractions, vehicle mileage, dust, etc. (Burt, 2005).
On the other hand, remote monitoring and control systems are becoming cost-effective water management tools because of the constant cost breakthrough in computers, software, controllers, remote terminal units, communication equipment and sensors.
SCADA allows the water manager to continuously compare actual hydraulic state of the canals with their optimal hydraulic state, and to take appropriate corrective steps as required. These innovations allow the manager to react rapidly and effectively to the changing conditions, thereby accommodating both high and low flow conditions and reducing canal spillage and seepage.
The paper presents the SCADA system designed for the Idanha-a-Nova Irrigation District (INID), a Portuguese governmental irrigation district built in the 40’s of the last century, and the corresponding implementation and field tuning.
The paper begins with a brief presentation of the INID and its main and secondary canal system and, after that, makes a general presentation of the developed and implemented SCADA system, including field stations, two of the developed synoptics, monitoring flows and manual controllers. An especial attention is paid to the remote manual gate flow controllers installed at the main canals and main distributors. The general algorithm used for the gate flow controllers was tuned in the field, using two types of acoustic Doppler flow meters. The paper also presents the used flow meters, the obtained results and the calibration methodology of flow gate controllers.
2 Idanha-a-Nova irrigation district
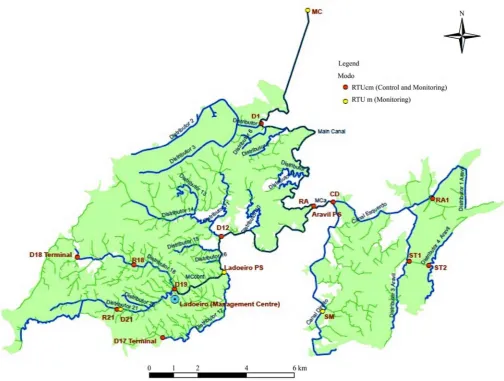
INID is located at the center of Portugal, in the valley of the Ponsul river, a tributary of the Tejo River, the main river of the country. The total area equipped and gravity dominated by the canal system is 8200 ha (Figure 1) and the customers are around 950.
main distributors are open concrete-lined canals and are upstream controlled by AMIL radial gates (Kraatz and Mahajan, 1975) that provide adequate operation conditions for the Neyrpic orifice module (Kraatz and Mahajan, 1975), which equip customers with the great majority of the canal intakes and turnouts.
The irrigation district is composed of two irrigation blocks (Figure 1) – Campina Block, with a surface of 5700 ha, supplied by the Main Canal, by the Distributors 1 to 21 and by the Ladoeiro Pumping Station (Ladoeiro PS); Aravil Block, with a surface of 2500 ha, supplied by the Aravil Main Canal, Canal Direito and Canal Esquerdo, which is with the Distributors 1 to 5, and by the Aravil Pumping Station (Aravil PS), which supplies the Aravil Main Canal.
The main canal system is the water conveyor to the two irrigation blocks and consists of (Figure 1):
• MC – Main Canal – with the intake at the Marechal Carmona Dam and the end section at the Ladoeiro PS; it is designed for 7.38 m3 s-1 and has a length of 23701 m;
• MCcont – Main Canal of continuation – It is the direct continuation of the MC; it develops between the Ladoeiro PS and Distributor 19 (D19) intake, near the Management Centre of the irrigation district and also of the installed SCADA system; it is designed for 1.58 m3 s-1 and has a length of 2614 m;
• MCa – Aravil Main Canal – with the intake at the Aravil PS, it ends at the diversion node of the Canal Direito (CD) and Canal Esquerdo (CE); it is designed for 2.275 m3 s-1 and has a length of 808 m.
Figure 1 INID scheme and the location of SCADA field stations The secondary canal network, beginning at the main
canal system, in addition to the water conveyance, already has a significant water delivery function to the customers and is constituted by the distributors (Figure 1):
• MC – Distributors one to 17 (D1 to D17);
• MCcont – Distributors 18 to 21 (D18 to D21);
3 INID canal system SCADA
3.1 General presentation
Upstream local control can be manual or automatic for water depths. In the present case is automatic, with AMIL radial gates being the controllers. However, with upstream control, all the flows are, always, manual controlled, the inflows at canal (or distributors) intakes and the outflows at turnouts to customers or to the drainage system.
The main goal of a SCADA system is to optimize these manual procedures and, in this way, to improve the traditional manual canal operation.
The central manual control of a canal system is only appropriate and efficient when reliable information exists about the real-time hydraulic state of the system. Therefore, a canal SCADA system usually involves (Rijo, 2008):
• a real-time remote monitoring action in order to keep abreast of the hydraulic conditions or in order to obtain actual hydraulic state; this action is guaranteed by the SCADA;
• a real-time control action in order to lead the system to the desired state – manual flow control at canal intakes and turnouts (eventually, also at a few outlets to drainage system), guaranteed locally or remotely by the SCADA;
• a management action to support operational decisions and correction actions, ensuring the desired service performance, regarding the real and expected demands, the available water storage volumes and economic factors – a watermaster decision.
The SCADA should be robust to local failures, in order not to compromise the functioning of the entire system, and modular and flexible to permit an easy expansion. So, in the present study, the adopted solution was to choose a distributed system by opposition to a centralized system with all the decisions concentrated in one central computer. The distributed control system guarantees flexibility and modularity, since for each new extension, the existing controllers do not need to be altered and also guarantee robustness, as a failure in one of the controllers or in the communication system that links the controllers to the hydraulic structures and
sensors affects just a part of the system.
Basically, the SCADA system involves: a central computer or an Human Machine Interface (HMI), remote terminal units (RTU) and a communication system connecting the central unit to the RTU’s. RTU’s are, basically, small computers that can be programmed for specific requirements at individual sites (Programmable Logic Computers, PLC). The RTU’s are also the points to which sensors are connected and constitute the interfaces between the SCADA and the hydraulic system. For safety, they are located inside field stations (Sta).
3.2 Remote terminal units
RTU’s main purposes are: controlling inputs and outputs of field devices (gates); monitoring water levels, flow rates, gate positions and log alarms; reporting to the management centre and carrying out the commands set they receive from the management centre.
With the implemented SCADA, two functions are guaranteed:
• remote monitoring – through the HMI of the management centre, to receive and plot, depending on needs and functional requirements, the direct information of the sensors (water levels, gate positions and flow rates) of each RTU or the corresponding computed values;
• remote manual control – it is the same as supervisory control and is the historical foundation of the SCADA systems; the operator can raise or lower gates and send flow orders or setpoints to each RTU and thereby effect the canal operation from the central computer directly; this is called remote manual because gate movements are implemented or ordered by the canal company staff just as if they were at the gate or check, but the gate adjustments can be made much more frequently and therefore canal operations, overall, can become more real time.
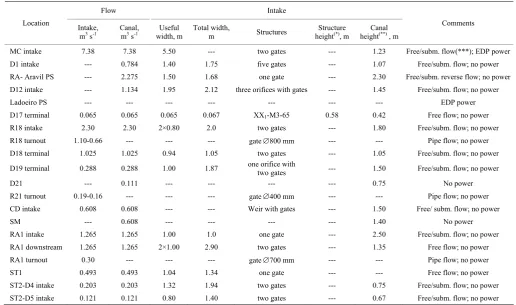
Table 1 presents the main features of the selected locations to be monitored and controlled by the SCADA. These locations were selected in the field in collaboration
with the water master and ditch riders, in order to take into account their experience and knowledge about canals dynamics and operation.
Table 1 Brief characterization of the locations chosen for the INID SCADA field stations installation
Flow Intake Location
Intake,
m3 s-1 Canal, m3 s-1 width, m Useful Total width,m Structures heightStructure (*), m heightCanal (**) , m
Comments
MC intake 7.38 7.38 5.50 --- two gates --- 1.23 Free/subm. flow(***); EDP power D1 intake --- 0.784 1.40 1.75 five gates --- 1.07 Free/subm. flow; no power RA- Aravil PS --- 2.275 1.50 1.68 one gate --- 2.30 Free/subm. reverse flow; no power D12 intake --- 1.134 1.95 2.12 three orifices with gates --- 1.45 Free/subm. flow; no power
Ladoeiro PS --- --- --- --- --- --- --- EDP power
D17 terminal 0.065 0.065 0.065 0.067 XX1-M3-65 0.58 0.42 Free flow; no power
R18 intake 2.30 2.30 2×0.80 2.0 two gates --- 1.80 Free/subm. flow; no power R18 turnout 1.10-0.66 --- --- --- gate ∅800 mm --- --- Pipe flow; no power D18 terminal 1.025 1.025 0.94 1.05 two gates --- 1.05 Free/subm. flow; no power
D19 terminal 0.288 0.288 1.00 1.87 one orifice with two gates --- 1.50 Free/subm. flow; no power
D21 --- 0.111 --- --- --- --- 0.75 No power
R21 turnout 0.19-0.16 --- --- --- gate ∅400 mm --- --- Pipe flow; no power CD intake 0.608 0.608 --- --- Weir with gates --- 1.50 Free/ subm. flow; no power
SM --- 0.608 --- --- --- --- 1.40 No power
RA1 intake 1.265 1.265 1.00 1.0 one gate --- 2.50 Free/subm. flow; no power RA1 downstream 1.265 1.265 2×1.00 2.90 two gates --- 1.35 Free flow; no power RA1 turnout 0.30 --- --- --- gate ∅700 mm --- --- Pipe flow; no power ST1 0.493 0.493 1.04 1.34 one gate --- --- Free flow; no power ST2-D4 intake 0.203 0.203 1.32 1.94 two gates --- 0.75 Free/subm. flow; no power ST2-D5 intake 0.121 0.121 0.80 1.40 two gates --- 0.67 Free/subm. flow; no power Note: (∗) From the weir crest to the top of the Neyrpic module; (∗∗ ) From the canal bottom or weir crest to the canal top; (***) Free or submerged hydraulic jump downstream the gates.
They were defined as two different RTU’s types, one with monitoring functions and the other with control and monitoring functions:
• Field Stations with Control and Monitoring Units (RTUcm) - There are 12 field stations with RTUcm; these RTU’s can include the functions – flow gates control, Q; remote monitoring of upstream gate (or other hydraulic structure) water levels, h1; remote monitoring of
downstream gate (or other hydraulic structure) water levels, h2; remote monitoring of gate openings, w; flow
computations over weir (s), Q1; and flow meter
monitoring sensor, Q2 (Figure 1 and Table 2).
• Field Stations with Monitoring Units (RTUm) – There are four field stations with RTUm, equalling to the RTUcm, but without flow gates controllers, Q (Figure 1 and Table 2).
The different developed controllers were programmed inside each PLC with control functions. The algorithms to monitor water levels and gate openings and to compute
flow over weirs were also programmed inside the PLC’s. The different programmed algorithms are activated by the operator, locally or at the central unit.
The installed PLC’s are industrial devices that use standard Ladder programming language.
3.3 Management centre
The management centre is located at the Water Users Association Building (Ladoeiro, Figure 1) and its main functions are the control and monitoring of the canal system. It coordinates the RTU’s through the central HMI, sending orders or target values and receiving information about the general state of the hydraulic system.
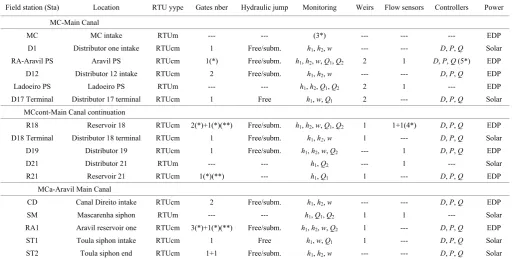
Table 2 INID SCADA field stations
Field station (Sta) Location RTU yype Gates nber Hydraulic jump Monitoring Weirs Flow sensors Controllers Power
MC-Main Canal
MC MC intake RTUm --- --- (3*) --- --- --- EDP
D1 Distributor one intake RTUcm 1 Free/subm. h1, h2, w --- --- D, P, Q Solar
RA-Aravil PS Aravil PS RTUcm 1(*) Free/subm. h1, h2, w, Q1, Q2 2 1 D, P, Q (5*) EDP
D12 Distributor 12 intake RTUcm 2 Free/subm. h1, h2, w --- --- D, P, Q EDP
Ladoeiro PS Ladoeiro PS RTUm --- --- h1, h2, Q1, Q2 2 1 --- EDP
D17 Terminal Distributor 17 terminal RTUcm 1 Free h1, w, Q1 2 --- D, P, Q Solar
MCcont-Main Canal continuation
R18 Reservoir 18 RTUcm 2(*)+1(*)(**) Free/subm. h1, h2, w, Q1, Q2 1 1+1(4*) D, P, Q EDP
D18 Terminal Distributor 18 terminal RTUcm 1 Free/subm. h1, h2, w 1 --- D, P, Q Solar
D19 Distributor 19 RTUcm 1 Free/subm. h1, h2, w, Q2 --- 1 D, P, Q EDP
D21 Distributor 21 RTUm --- --- h1, Q2 --- 1 --- Solar
R21 Reservoir 21 RTUcm 1(*)(**) --- h1, Q1 1 --- D, P, Q EDP
MCa-Aravil Main Canal
CD Canal Direito intake RTUcm 2 Free/subm. h1, h2, w --- --- D, P, Q EDP
SM Mascarenha siphon RTUm --- --- h1, Q1, Q2 1 1 --- Solar
RA1 Aravil reservoir one RTUcm 3(*)+1(*)(**) Free/subm. h1, h2, w, Q2 1 --- D, P, Q EDP
ST1 Toula siphon intake RTUcm 1 Free h1, w, Q1 1 --- D, P, Q Solar
ST2 Toula siphon end RTUcm 1+1 Free/subm. h1, h2, w --- --- D, P, Q Solar
Note: (∗) Already installed; (∗∗) Turnout wall gate; pipe flow; (3*) Signal readings of the already existing SCADA; (4∗) Electromagnetic flow meter in the water intake
pipe; (5∗) Eventual reversal flow.
3.4 Communications
The communications between the RTU’s and the central unit is guaranteed by a mobile phone operator and supported by GPRS/UMTS. It is a two–ways communication, in which the central can call a selected RTU or all the RTU’s, according a pre-defined sequence after a central decision or automatically according a pre-defined time interval, or the RTU’s can call the central system to report alarms. The alarms appear at the central computer but also are transmitted to pre-defined cell phones.
The communications are supported by the IEC60870- 5-104 protocol. With this protocol, it is not necessary that a permanent data is reading by the SCADA. There is only data transmission to the SCADA when alarm situations appear at one or more field stations, being always possible to connect RTU’s, if required or desired.
3.5 Power supply
The RTU’s are supplied by the national electrical power network (EDP, Table 2) or by solar panels (Solar, Table 2).
3.6 Alarms
The SCADA alarms processing has an important role, making possible the information about verified damages, suggesting the corresponding actions and, in extreme
conditions, making pre-defined automatic decisions (open or close gates, for example).
The main alarms of the SCADA are: water depths inside canal pools – in order to prevent the canal empting or overtopping; the operational state of the control devices (gates, water level and gate sensors and controllers).
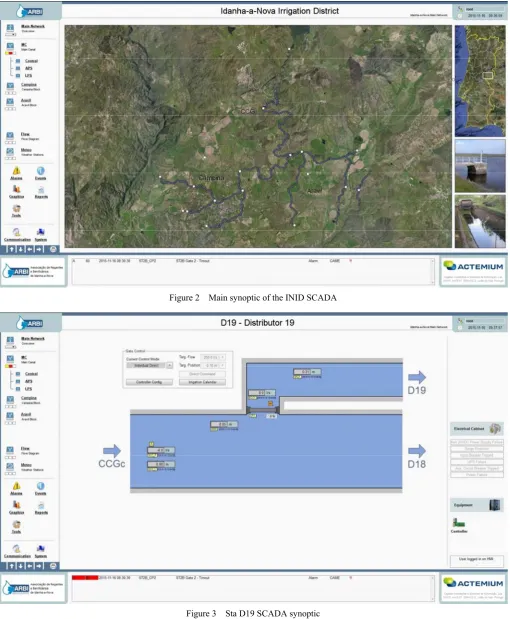
4 Examples of SCADA synoptics
Figure 2 and Figure 3 represent examples of synoptics of the developed SCADA application.
Figure 2 Main synoptic of the INID SCADA
Figure 3 Sta D19 SCADA synoptic
5 Installed controllers
5.1 Gate flow controller (Q)
The main goal of the flow controller is to obtain and maintain a pre-defined flow (or a flow calendar) for the selected gates. Figure 4 shows the control algorithm for
two independent gates at the same installation, the implemented solution for a few field stations (Table 2).
In Figure 4, the presented variables mean:
• G1status, G2status, respectively, gates G1 and G2 states (Open/ Closed / Failure / Manual);
• h1, h2, respectively, water depths at the upstream and
downstream gates;
• Q, global flow for the two gates computed by the flow controller;
• Qref, target flow for the two gates;
• w1me, w2me, respectively, the measured values of the gate G1 and G2 openings;
• w1ref, w2ref, respectively, the target values for the openings of the gates G1 and G2;
• ΔQ, inside the dead band filter, is the error dead band (2-5 Ls-1, defined for each location);
•ΔT1OFF, ΔT2OFF, respectively, minimum stop time required by the servomotors of the gates G1 and G2.
The error, e =Qref – Q, is compared with the pre-defined value of ΔQ and the actuators will open the gate (s) when e>ΔQ and close the gate (s) if e<ΔQ.
Figure 4 Remote/local flow controller algorithm scheme for two gates (Rijo and Arranja, 2010)
Flow Q computation
In order to program a digital flow controller, it is very important to have a general flow algorithm that guarantees the solution continuity for the entire operation domain of the hydraulic structure under study (gate or weir controlled or not by gates), without numerical discontinuities.
There are several flow equations, but, usually, they are only valid for a certain flow condition – weir or gate free flow (free hydraulic jump downstream, Figure 5) or weir or gate submerged flow (submerged hydraulic jump downstream, Figure 5). The combination of these well-known flow equations usually fails in the transition of the free to submerged condition, in one way or another, and makes no difference between totally or partially
submerged flow (Baume et al., 2008; Brunner, 2010).
Figure 5 Sluice gate associated with a Neyrpic weir (Rijo, 2008) Baume et al. (2008) presents a general flow algorithm that guarantees the continuity of the numerical solution for the entire domain of operation of these hydraulic structures. For this reason, this was the flow algorithm chosen for the present study and its general definition is as follows.
Figure 5 presents a low weir (p1→0 and p2→0)
controlled by a sluice gate, whose general flow equation is
3/2 3/2
1 1
2 [ a b( ) ]
Q L= g k h −k h −w (1)
where, L is the weir length; g is the acceleration of gravity, ka=kFμ and kb=kF1μ1, being kF and kF1 reduction
factors and μ e μ1 coefficients of discharge for free flow
conditions.
• Weir flow situation (w≥h1 and kb=0) – the flow is
only controlled by the weir and the reduction factor kF is computed according to Baume et al. (2008) algorithm and, when the downstream water depth h2 does not affect
the discharge over the weir (free hydraulic jump, Figure 5), Equation (1) is the well-known flow weir Bazin equation (kF =1); μ is a function of μ0=2/3CG, where CG is the
• Flow gate situation (w<h1) – for free flow (free
hydraulic jump, Figure 5), and μ and μ1 are functions of
μ0, h1 and μ, with μ0 with the already presented value; for
submerged conditions, the used algorithm considerers two situations – total submersion, where kF and kF1 are
functions of h1, h2 and w and μ and μ1 are computed as
already mentioned; partial submersion, considering the same variables computed in the same ways, but with kF1=1 (Baume et al., 2008).
Calibration of flow Q algorithm
In recent years, Doppler technology has been adapted to accurate water flow measurement. Acoustic pulses sent and received by transducers at a fixed frequency colliding with particles in the water, allowing for a determination of flow velocity. The flow rate for an open channel is then computed using an algorithm based on the measured velocity and the water depth in the channel.
In the present project, two types of acoustic flow meters were used, based on the physical principle called the Doppler shift. One, fixed on the canal bottom in chosen locations, is the SonTeK IQ Plus (SIQ) (SonTek, 2012) and the other is the SonTek River Surveyor S5 (SRS5) (SonTek, 2010), which is mounted on a small moving floating platform and is used to verify SIQ accuracy and for tuning the gate flow controllers.
SIQ uses four independent pulsed Doppler velocity beams that work to map the cross-section flow velocity, two along-axis beams and two skew beams, and feeds back this data to a flow computation algorithm. Additionally, the equipment also has a vertical beam and a pressure sensor to measure the water stage, which permits computing the flow area. Flow rate is computed as a product of the flow area and the mean cross-section flow velocity.
SIQ uses the velocity index (SonTek, 2012), an empirical relationship between the measured velocity and the mean cross-section flow velocity, based on a series of measurements over time for different flow rates. The velocity index is very accurate, with an accuracy within
±2% (Styles, 2001).
As presented in Table 2, were installed SIQ devices at the Sta’s RA-Aravil PS, Ladoeiro PS, R18, D19 and SM.
SRS5 base system, an acoustic Doppler profiler (ADP), consists of four transducers for velocity
measurement and one vertical acoustic beam for water depth. The ADP measures velocities of the water up to 128 cells for the entire cross section, with “swept” being regarded as the profiler moves of a margin for the other. With the SIQ, it is only possible to estimate the water velocity along one vertical profile (with up to 100 points along the profile). The remote communication between the ADP and a PC or the ADP and a Mobile device via radio link, where a specific software runs, permits the computation and the integration of the computed discharge along the canal width in real time. The device is also equipped with a GPS. Manufacturers indicate an accuracy of 0.25% of the measured velocity (SonTek, 2010).
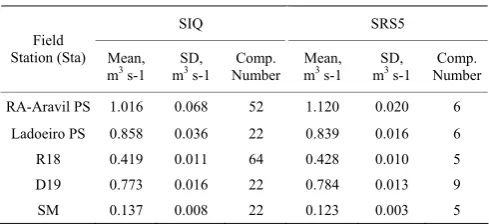
Table 3 presents flow computations comparison between flow meters SIQ and SRS5 for the field stations equipped with SIQ (without Sta D21, because the SIQ device was out of service), always in steady flow situations. The obtained results permit the following conclusions:
• For both devices, the results are relatively consistent; the standard deviation (SD) is always relatively small;
• The SRS5 gives bigger mean values than SIQ for three situations (+10%; +2%; 1.5%) and less values for two situations (–2%; –10%);
• Considering the field situations, without readings exactly for the same instant in both equipment, with readings in neighbouring but not at the same cross sections and knowing that the results depend on the passage or not of debris in suspension and also of the cleanliness of the SIQ sensors head (fixed on the canal bottom), it is thought that differences of up to 10% are acceptable;
• In conclusion, the index velocity equation used for SIQ tuning gives acceptable accuracy and its results can be used for real time management through the SCADA.
Table 3 Field flow computations with flow meters SIQ and SRS5
SIQ SRS5 Field
Station (Sta) Mean,
m3 s-1 mSD,3 s-1 Number Comp. Mean, m3 s-1 mSD,3 s-1 NumberComp.
RA-Aravil PS 1.016 0.068 52 1.120 0.020 6 Ladoeiro PS 0.858 0.036 22 0.839 0.016 6
Figure 6 presents a picture of the estimation of flow with SRS5 at the Sta R18, with the visible profiler mounted on a small floating platform moved very carefully by two operators along the canal width and the third operator controlling in the real-time flow computation in a PC, where the specific software runs.
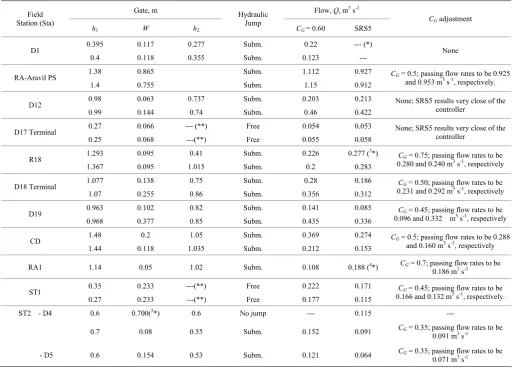
Table 4 presents the adjustment of the theoretical value 0.60 for the coefficient CG introduced into the flow gate controllers, considering the two flow estimations for different steady flow conditions in each installation, using the flow meter SRS5. The adjusted value for the coefficient CG (last column of Table 4) was obtained by
trial and error, running the flow algorithm and comparing the obtained flow with the estimated flow by the SRS5.
Figure 6 Flow estimation with SRS5 at Sta R18
Table 4 Field adjustment of the theoretical coefficient CG for the flow gate controllers
Gate, m Flow, Q, m3 s-1
Field Station (Sta)
h1 W h2
Hydraulic Jump
CG= 0.60 SRS5
CG adjustment
0.395 0.117 0.277 Subm. 0.22 --- (*)
D1
0.4 0.118 0.355 Subm. 0.123 --- None
1.38 0.865 Subm. 1.112 0.927
RA-Aravil PS
1.4 0.755 Subm. 1.15 0.912
CG = 0.5; passing flow rates to be 0.925 and 0.953 m3 s-1, respectively.
0.98 0.063 0.737 Subm. 0.203 0.213 D12
0.99 0.144 0.74 Subm. 0.46 0.422
None; SRS5 results very close of the controller
0.27 0.066 --- (**) Free 0.054 0.053
D17 Terminal
0.25 0.068 ---(**) Free 0.055 0.058
None; SRS5 results very close of the controller
1.293 0.095 0.41 Subm. 0.226 0.277 (3*)
R18
1.367 0.095 1.015 Subm. 0.2 0.283
CG = 0.75; passing flow rates to be 0.280 and 0.240 m3 s-1, respectively
1.077 0.138 0.75 Subm. 0.28 0.186 D18 Terminal
1.07 0.255 0.86 Subm. 0.356 0.312
CG = 0.50; passing flow rates to be 0.231 and 0.292 m3 s-1, respectively
0.963 0.102 0.82 Subm. 0.141 0.085 D19
0.968 0.377 0.85 Subm. 0.435 0.336
CG = 0.45; passing flow rates to be 0.096 and 0.332 m3 s-1, respectively
1.48 0.2 1.05 Subm. 0.369 0.274 CD
1.44 0.118 1.035 Subm. 0.212 0.153
CG = 0.5; passing flow rates to be 0.288 and 0.160 m3 s-1, respectively
RA1 1.14 0.05 1.02 Subm. 0.108 0.188 (4*) CG = 0.7; passing flow rates to be
0.186 m3 s-1
0.35 0.233 ---(**) Free 0.222 0.171 ST1
0.27 0.233 ---(**) Free 0.177 0.115
CG = 0.45; passing flow rates to be 0.166 and 0.132 m3 s-1, respectively.
ST2 - D4 0.6 0.700(5*) 0.6 No jump --- 0.115 ---
0.7 0.08 0.55 Subm. 0.152 0.091 CG= 0.35; passing flow rates to be 0.091 m3 s-1
- D5 0.6 0.154 0.53 Subm. 0.121 0.064 CG = 0.35; passing flow rates to be 0.071 m3 s-1
Note: (∗) Canal covered downstream – not possible to use SRS5; (∗∗) Always free hydraulic jump at the downstream gate; (3*) Diversion gate to reservoir R18;
difference between the values obtained by SRS5 and SIQ, inside the Distributor 18 that supplies R18, respectively, at the upstream and downstream diversion to R18; (4*) Diversion gate to reservoir RA1; difference between the values obtained by SRS5 inside the Canal Direito that supplies RA1, respectively, at the upstream and
downstream diversion to RA1; (5*) Gate above water surface; flow that is not controlled by the gate or weir.
5.2 Direct gate controller (D)
The direct controller block is responsible for the control orders sent to the actuators of the gates (Open/Close/Stop). In Figure 4, it appears as the final block of the flow controller, but it is also available for
remote or local manual operation of the gates (operator, HMI). All the gates were equipped with this controller (Table 2).
5.3 Gate position controller (P)
gate position is established. The gate positions are controlled by a Bang-Off-Bang controller with a deadband (Ogata, 1997). In this controller, the direct controller appears as the final block of the algorithm. All the gates were also equipped with this controller (Table 2).
6 Flow monitoring (Q
1, Q
2)
Table 2 presents the field stations equipped with flow monitoring over weir (Q1). The computation of the flow is done considering the simplification of the Equation (1) for weirs. All the weirs operate in free flow conditions (not submerged from the downstream).
Table 2 also presents the field stations equipped with SIQ flow meters (Q2).
7 Final considerations
Hardware and software is increasing in capacity and decreasing in cost, becoming much more affordable for irrigation districts to use SCADA technologies. Today, real-time monitoring and control are within the cost range of most water user groups, including irrigation districts. SCADA system allows reducing water losses and waste, to increase the ability of meeting real-time water demands and to reduce operation, power and labor costs.
The total cost of the presented SCADA was around 1.4 million euros, including designing project, equipment, software, installation and field calibration.
Acknowledgements
The present project was financially supported by the Water Users Association of the INID, to whom the author thanks.
References
Baume, J. P., P. O. Malaterre, P. Y. Vion and X. Litrico 2008. Simulation of Irrigation Canals (SIC, version 4.27): Theoretical Concepts Modelling Approach. Vol II. Montpellier, France: Irrigation Division of CEMAGREF. Brunner, G. W. 2010. Hydrologic Engineering Center – River
Analysis System (HEC-RAS) version 4.1 – Hydraulic Reference
Manual. Washington, D. C.: Army Corps of Engineers. Burt, C. M. 2005. Overview of supervisory control and data
acquisition (SCADA). In SCADA and Related Technologies for Irrigation District Modernization, eds. C. M. Burt, S. S. Anderson, 1-9. Denver: USCID.
Buyalski, C. P., D. G. Ehler, H. T. Falvey, D. C. Rogers, and E. A. Serfozo. 1991. Canal Systems Automation Manual: Volume I. Denver: Bureau of Reclamation, U. S. Dep. Interior.
Clemmens, A. J. 1987. Delivery system schedules and required capacities. In Planning, operation, rehabilitation and automation of irrigation water delivery systems, ed. D. D. Zimbelman 18-34. New-York: ASCE.
INAG. 2001. Programa Nacional para o Uso Eficiente da Água. Versão Preliminar (National program for the efficiency of the water use. Preliminary version). Report of the INAG-Instituto da Água, Ministério do Ambiente e do Ordenamento do Território, Lisbon, Portugal (In Portuguese).
Kraatz, D. B., and I. K. Mahajan. 1975. Small hydraulic structures. In FAO Irrigation and Drainage Paper, No.26. Rome: FAO. Ogata, K. 1997. Modern Control Engineering. 3rd Edition. Prentice
Hall International, Inc.
Plusquellec, H. L., C. Burt, and H. W. Wolter. 1994. Modern water control in irrigation: concepts, issues, and applications. World Bank Technical Paper No.246 – irrigation and drainage series. Washington D. C.: The World Bank.
Rijo, M. 2008. Design and field tuning of an upstream controlled canal network SCADA. Irrigation and Drainage, 57(2): 123–137.
Rijo, M. 2010. Canais de Adução. Projeto, Operação, Controlo e Modernização (Adduction canals. Design, Operation, Control and modernization), Lisbon, Portugal: Edições Sílabo. (In Portuguese).
Rijo, M., and A. B. Almeida. 1993. Performance of an automatic upstream controlled irrigation system: conveyance efficiencies. Irrigation and Drainage Systems, 7(3): 161–172.
Rijo, M., and C. Arranja. 2010. Supervision and automatic control of an irrigation canal. Journal of Irrigation and Drainage Engineering, 136(1): 3–10.
SonTek. 2010. SonTeK RiverSurveyor S5/M9 System Manual. San Diego, C. A.: SonTeK.
SonTek. 2012. SonTeK IQ Intelligent Flow User’s Manual. San Diego, C. A.: SonTeK.
Styles, S. W. 2001. Bottom Mounted Doppler Flow Meters for Canals. Irrigation Training and Research Center, Report No. R 01-004. Available at: http://works.bepress.com/sstyles/24/. Wahlin, B., and D. Zimbelman, eds. 2014. Canal Automation for