Bank Valuation Models – A Comparative Analysis
Prof. Chitra Gunshekhar Gounder1 & Dr. M. Venkateshwarlu2 1
Research scholar NITIE, Mumbai and Assistant Professor Thakur Institute of Management Studies and Research, Mumbai, India
2 Professor, National Institute of Industrial Engineering (NITIE), Mumbai, India
Correspondence: Prof. Chitra Gunshekhar Gounder, Research scholar NITIE, Mumbai and Assistant Professor Thakur Institute of Management Studies and Research, Mumbai, India
Received: July 26, 2017 Accepted: August 5, 2017 Online Published: August 8, 2017 doi:10.5430/afr.v6n3p116 URL: https://doi.org/10.5430/afr.v6n3p116
Abstract
The Bank valuation model was designed based on objective to fit the most applicable valuation model for banks to help in forecasting bank specific decision and also forecast the market value of share. First study the accuracy and explanatory value of the value estimates from the residual income model compared to the estimates from the Relative valuation model for banks. Empirical evidence suggests that the residual income model is superior to the relative valuation model when it comes to measuring bank shareholder value. The results of the comparison suggest that value estimates from the residual income model are even more reliable for banks. On this basis, we conclude that residual income is an appropriate value estimate for the shareholder value of banks. There was positive significant relationship identified between the intrinsic value of bank share determined by RIV model and Market price of share in all the cases by performing correlation and Regression study. This study will be useful for forecasting the possible changes in market price. It was identified that determinants vary as per the working and regulatory condition as determinants impacting private, public and Indian banks were not similar so panel regression model will vary for each cases. It was also identified that Public Sector Bank in India shows more positive progressive trend as compared to private Sector Bank even after the fact that public Sector Bank has higher regulatory restriction as compared to Private Sector banks. This research will serve very useful for the banker to plan and take decision regarding shareholder value creation by implementing proper valuation model for getting appropriate value estimate and also adopting proper internal performance measure for having accurate and regular check on the process of value creation.
Keywords: Valuation, RIV model, Relative valuation
1. Introduction
2. Brief Literature Review
During 2008, financial crisis European banks have suffered heavy losses due to which economic value (shareholder value) has considerably decreased. If banks want to sustain or regain or increase the confidence of shareholder and customer then they should increase the economic value by adopting best valuation approach, Damodaran (2009), Oleg Deev (2011).
“Bank valuation is an estimation of its market value in terms of money on a certain date, taking into account the factors of aggregate risk, time and income expectations” Oleg Deev (2011). Bank valuation helps banks in achieving their most important and prime objectives that are creating sustainable and continuous growth in shareholder value, Steevens (2005), Hiller and Fehr (2005). A bank valuation model enables us to break the value of the equity of a bank into four components: a liquidation value, a franchise value, a corporate tax penalty, and tax savings due to unrealized capital gains Jean Dermine (2008).
Practical Problems faced in Valuating Banks are Estimation of cash flow which is very essential for valuation cannot be performed without estimating reinvestment done, Damodaran (2000), (2002).Estimation expected future growth become a very difficult task if reinvestment rate cannot be measured, Damodaran (2002).In absence of proper regulatory and auditable system, Valuation models can be misused or misinterpreted, Harry Huizinga & Luc Laeven (2010).The accounting rules that govern bank accounting have historically been very different from the accounting rules for other firms, with assets being marked to market more frequently for financial service firms, Damodaran (2000).
3. Study on Bank Valuation Models
1. Net Asset Based Valuation
Asset based valuation approach establish the liquidation value of a bank for possible legal proceedings but this value-based approach is difficult to apply when the bank enters multiple businesses (commercial banking, investment banking, etc.) or regions (countries), Oleg Deev (2011). Net asset valuation is not useful for the valuation of banks as whole; it is useful to assess the valuation of individual financial investment, Becker (1999) & Stephanie Gross (2006).
2. Discounted cash flow valuation
DCF focuses on overall growth and stability of bank and not only on profit growth therefore has it emphasized on factors such as capital growth & renewal, income generated and risk, Horvatova Eva (2010). DCF valuation helps to know about the underlying characteristics of the firm, understand its business and its future risk income & growth, Copeland (2000).
DCF approach should be application in practice should be increased in banks as the bank’s value is determined by its future performance, which is of significant concern for shareholders and other suppliers of capital, Oleg Deev (2011).
3. Relative valuation
Relative valuation approach is probably the simplest way and can be used on regular basis to value a bank, Oleg Deev (2011). To find a comparable bank with the same proportions in the banking business model from the outside is relatively hard, Damodaran (2002). The use of this model for the measurement and management of bank valuation is limited but multiples in relative valuation have an important auxiliary function and support the fundamental valuation methods as an early indicator, control methodology and negotiation tool, Rezaee (2001). Relative valuation does not focus on the future cash flow generated by banks, it only concentrates on earnings of banks it also is based on the assumption that stock market values correctly the shares of bank which is true only under the efficient market condition, Jean Dermine (2009).
4. Residual Income approach
Residual income approach is more preferable for large-scale samples and to establish metrics for value-based performance management and hence it can be termed as the most the superior method for banks, Stephanie Gross (2006).
5. Contingent valuation approach
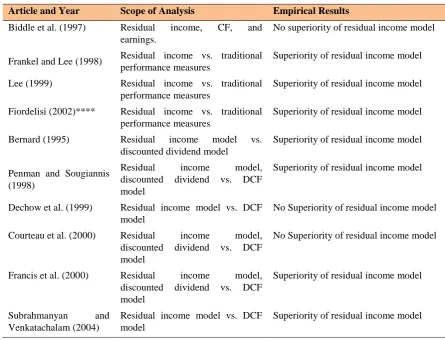
Table 1. Overview of Empirical Evidence of Valuation Models and Approaches on Overall industry
Article and Year Scope of Analysis Empirical Results
Biddle et al. (1997) Residual income, CF, and earnings.
No superiority of residual income model
Frankel and Lee (1998) Residual income vs. traditional performance measures
Superiority of residual income model
Lee (1999) Residual income vs. traditional performance measures
Superiority of residual income model
Fiordelisi (2002)**** Residual income vs. traditional performance measures
Superiority of residual income model
Bernard (1995) Residual income model vs. discounted dividend model
Superiority of residual income model
Penman and Sougiannis (1998)
Residual income model, discounted dividend vs. DCF model
Superiority of residual income model
Dechow et al. (1999) Residual income model vs. DCF model
No Superiority of residual income model
Courteau et al. (2000) Residual income model, discounted dividend vs. DCF model
No Superiority of residual income model
Francis et al. (2000) Residual income model, discounted dividend vs. DCF model
Superiority of residual income model
Subrahmanyan and Venkatachalam (2004)
Residual income model vs. DCF model
Superiority of residual income model
Source: Gross (2006) (****Empirical study on Banks )
Gross (2006): The existing contributions focus either on periodic performance indicators or on fundamental value estimates. The first group, the studies on periodic performance measures, examines the information content of market prices and the relevance of pastor anticipated periodic performance indicators for current changes in market prices. Empirical relevance of shareholder value Indicators are innovative measures of performance such as residual income and cash flows, but also traditional measures such as income or EPS. The second group of research compares fundamental value estimates from the residual income, DCF and discounted dividend model to stock prices observed in the market. The empirical results suggest the superiority of the residual income model. In seven out of the ten listed studies, residual income dominates the alternative periodic performance indicators or fundamental value estimates. Unfortunately, the existing studies do not provide empirical evidence for this superiority for the banking industry. Except from Fiordelisi (2002), none of the listed contributions differentiates by industry and most of the studies explicitly exclude banks and other financial services providers. Fiordelisi (2002) focuses on the banking industry and provides evidence supporting the superiority of residual income compared to traditional performance measures.
Table 2. Overview of Empirical Evidence of Valuation Models and Approaches on Banking Industry:
Sr. No. Dependent Variable Banks Author
1. Residual Income valuation Approach ( EVA)
Non listed banks Koller, Goedhart & Wessels (2010)
2. Residual Income valuation Approach ( EVA)
Non listed banks Fiordelisi, Molyneux (2010)
3. Residual Income valuation Approach ( EVA)
Non-listed banks (Franco Fiordelisi & PhilMolyneux (2007)
4. TSR
(Market Oriented Approach)
Listed banks Dayal (2010)
5. TSR
(Market Oriented Approach)
Listed banks Barefield (1998)
6. Risk - Adjusted TSR (Market Oriented Approach)
Listed banks Sinn et al (2003), (2004).
7. Residual Income valuation model Listed banks MSDW (2001) 8. Risk-adjusted TSR (market
oriented approach)
Listed banks MOW (2003)
9. Residual Income valuation Approach ( EVA)
28 public and private listed banks
Verma (2002)
10. Residual Income valuation Approach ( EVA)
India (SBI and HDFC Bank) Raiyani and Joshi (2009)
11. Residual Income valuation Approach ( EVA)
14 Nationalized banks and 12 Private sector banks
Soral and Bhanawat (2009)
12. Residual Income valuation Approach ( EVA)
Listed banks Parasuraman (2000)
13. Residual Income valuation model on Equity.
Non listed banks Gross (2006)
It is however discussed, that one major weakness of TSR as a shareholder value measure is the stock market expectation affection and some practitioners are therefore reluctant to use it Gross (2006). Therefore, Koller, Goedhart & Wessels (2010) examines different methods to correct for expectations and finds that they become insignificant over a longer time span. A greater weakness is however, that while the total shareholder return belongs to the market measure category, a measure for unlisted companies needs to be found. For this, the consultancy firms have developed a wide range of residual income measures Young,O'Byrne (2001).
In Comparative study of residual income valuation model and other approaches it was found that residual income is a useful measure for understanding a company's operating performance, MSDW (2001). Residual income valuation model give dual benefit as it can be used to measure the intrinsic value of a bank's equity through RIV model and the periodic performance of a bank through Economic Value Added (EVA), as well as it is a useful concept for value-based management, as it serves as a tool for multiyear financial planning and periodic performance controlling and can be easily communicated.
Majorly relative valuation approaches is used by analysts by using stock market data to form peer group multiple analysis in order to compare the value of two banks. The core assumptions behind peer group valuation based on multiples are the similarity between the compared banks both on size, risk, type etc. Koller, Goedhart & Wessels (2010). Major Indian analyst study are focused on relative approach in bank valuation as analyst found it is comfortable but it is not reliable and cannot be utilized for future oriented decision as it based on market oriented data.
based approach and market based approach in order to find the best model which has maximum impact on the market price of share
4. Research Methodologies
4.1 Objective of the Study
Even though there are a growing number of articles surrounding the concept of Valuation and shareholder value maximization, the evidence surrounding this in connection to banks is limited. So the main aim of the research to assess the preferred model for bank valuation from shareholder perspective.
The main objective is
Comparison of Residual Valuation approach which was suggested as per the literature of academic research and Market Based approach (Relative Valuation approach) as suggested by consultancy agency research report , so this study is made to find most appropriate model for bank valuation with goal of decision making and also for forecasting market price of share.
Analyse and interpret a comprehensive bank valuation model so as to help banks to maximize its shareholder value which would incorporate key external and internal determinants which influence bank valuation.
4.2 Variables Selected for Study
Dependent Variables are Market price (Daily average of market price for a year).
Independent Variable are Intrinsic value derived by RIV model and Ratios derived by P/B and P/E ratio under relative valuation model.
Regression equation model for the study: MPit= α0+ α1RIVit + eit
MPit= β0+ β1P/Bit + uit MPit= γ0+ γ1P/Eit + vit
Formula for Residual income valuation model under equity approach
Intrinsic Value per share = Book value per share + (Residual Income per share / 1 + Return on equity). Where,
Book value per share = Total Common Stockholder’s Equity/ Number of Common Shares Residual income per share = Residual income / No of equity shares,
Residual income = Net Income - (Equity *Cost of Equity%) No. of Equity Share = Equity Capital/Face Value per Share
Equity = Equity share capital + Reserves and surpluses – Miscellaneous expenses Return on Equity % = (Net income /Equity)*100
Cost of equity (CAPM is used) E(Ri) = Rf+ βim(E [Rm] –Rf) Formula for Relative Valuation model under equity approach: Where,
P/E is the ratio of the market price to the earnings per share (EPS) of a Bank. P/B is the ratio of market price to book value per share of Bank.
4.3 Research Design
4.4 Sample Data and its Sources
Secondary data has been used for this study. The macro economic data for India has been collected from Data book for planning commission .The bank wise data has been collected from RBI, CMIE – prowess and from the annual reports of each bank was considered. The present work has considered almost all the major banks in India which counted up to 40 banks and the time period is from 2001 to 2015.
The population of this study is the Indian commercial banks. Currently 48 listed Public and private banks are running their operations in the India. However, 40 banks are selected for this study. The data of other banks such as co-operative and foreign banks are not considered to avoid its possible impact on research findings and conclusions. The commercial banks are only considered to avoid the dissimilarity of the banking operations of the other banks, focusing on bank related micro economic variables and macroeconomic - related variables.
There are currently (27) Twenty Seven Public Sector Banks out of which (19) Nineteen is Nationalized Bank, (6) Six are SBI & its Associates and rest (2) two are other Public Sector Banks. There are currently (21) Twenty One Private Sector Banks are Operating in India.
We have covered (24) Twenty four Public Sector Banks and (16) sixteen Private Sector Banks for our empirical study for 15 years i.e. (2001- 2015).
4.5 Tools and Techniques for Analysis
The data collected for the present analysis is balance panel data. So, the relationship between the dependent and independent variables is obtained from a regression model called panel regression analysis. Panel (or longitudinal) data are cross-sectional and time-series. There are multiple entities, each of which has repeated measurements at different time periods. Panel data models examine group (individual-specific) effects, time effects, or both. These effects are either fixed effect or random effect. Panel data models examine fixed and/or random effects of entity (individual or subject) or time. The core difference between fixed and random effect models lies in the role of dummy variables .If dummies are considered as a part of the intercept; this is a fixed effect model. In a random effect model, the dummies act as an error term.
A fixed effect model examines if intercepts vary across groups or time periods, whereas a random effect model explores differences in error variances. A one-way model includes only one set of dummy variables (e.g., firm), while a two way model considers two sets of dummy variables (e.g., firm and year).A fixed group effect model examines group differences in intercepts, assuming the same slopes and constant variance across entities or subjects. Since a group (individual specific) effect is time invariant and considered a part of the intercept, u is allowed to be correlated to other regressor. Ordinary least squares (OLS) regressions with dummies, in fact, are fixed effect models. A random effect model, by contrast, estimates variance components for groups (or times) and error, assuming the same intercepts and slopes is a part of the errors and thus should not be correlated to any regressor; otherwise, a core OLS assumption is violated. The difference among groups (or time periods) lies in their variance of the error term, not in their intercepts. A random effect model is estimated by generalized least squares (GLS) when the matrix, a variance structure among groups, is known. The feasible generalized least squares (FGLS) method is used to estimate the variance structure when is not known.
Breusch and Pagan (Lagrange Multiplier (LM)) test: Radom effect model is first examined by pooled OLS regression model, if the p value is significant then random effect model is used.
The Hausman specification test (Hausman 1978) compares fixed effect and random effect models; if the p value is significant then fixed effect model has to be used for the study.
5. Empirical Results and Discussion
Empirical results and discussion are categorized into three categories to get accurate analysis and interpretation regarding valuation model to be preferred in Indian banking sector.
Comparison study of RIV Model and Relative Valuation Models for Indian Private Sector Banks.
Comparison study of RIV Model and Relative Valuation Models for Indian Public Sector Banks.
Comparison study of RIV Model and Relative Valuation Models for Indian Commercial Banks.
not significant so Radom effect model was selected to be suitable for all valuation model selected for the study of Indian private Sector Bank.
Table 3. Correlation Matrix of Valuation Models with Market Price of Share
Banks RIV P/B P/E
Private Limited Banks 0.73178175 0.60547223 0.500536 Public Limited Banks 0.91417264 0.450001157 0.3313507
Indian Banks 0.82344582 0.51075454 0.41466214
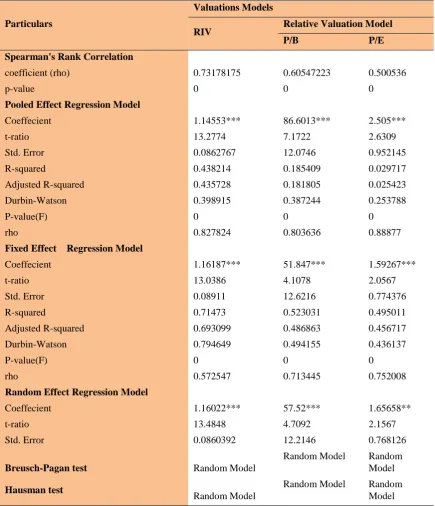
Table 4. Empirical Comparison of RIV Model and Relative Valuation Models for Indian Private Sector Banks (16 Banks):
Particulars
Valuations Models
RIV Relative Valuation Model
P/B P/E
Spearman's Rank Correlation
coefficient (rho) 0.73178175 0.60547223 0.500536
p-value 0 0 0
Pooled Effect Regression Model
Coeffecient 1.14553*** 86.6013*** 2.505***
t-ratio 13.2774 7.1722 2.6309
Std. Error 0.0862767 12.0746 0.952145
R-squared 0.438214 0.185409 0.029717
Adjusted R-squared 0.435728 0.181805 0.025423
Durbin-Watson 0.398915 0.387244 0.253788
P-value(F) 0 0 0
rho 0.827824 0.803636 0.88877
Fixed Effect Regression Model
Coeffecient 1.16187*** 51.847*** 1.59267***
t-ratio 13.0386 4.1078 2.0567
Std. Error 0.08911 12.6216 0.774376
R-squared 0.71473 0.523031 0.495011
Adjusted R-squared 0.693099 0.486863 0.456717
Durbin-Watson 0.794649 0.494155 0.436137
P-value(F) 0 0 0
rho 0.572547 0.713445 0.752008
Random Effect Regression Model
Coeffecient 1.16022*** 57.52*** 1.65658**
t-ratio 13.4848 4.7092 2.1567
Std. Error 0.0860392 12.2146 0.768126
Breusch-Pagan test Random Model
Random Model Random Model
Hausman test
Random Model
According to Spearman's Rank Correlation, there is high correlation of 73% by RIV model as compared to other relative valuation model that is P/B and P/E show relation of 60% and 50% with market price of share. As per result RIV model has highest R-squared 0 .71, Adjusted R-squared 0.69, Durbin –Watson 0.79 and very low standard error of 0.08 and low rho of 0.57 as compared to Relative valuation models. So as per the result RIV model is found most suitable and appropriate model for Indian Private Banks.
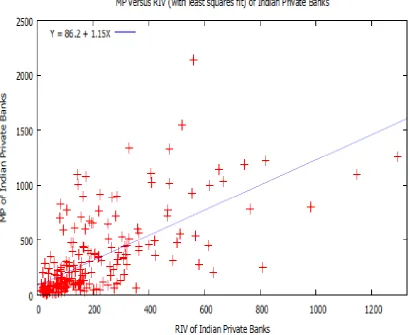
Figure 1. Panel Series of Market Price, RIV, PER and PBR of Indian Private Sector Bank for 15 Years Through Panel graph of Indian Private Banks it can be analysed that variation in market price and RIV model is almost similar whereas it is different in case of relative valuation models.
In case of RIV model, Radom effect model is selected by performing Breusch-Pagan test and Hausman test in this study for regression analyses. The coefficient of constant parameter of the banks shows a positive figure of82.8102, which implies that if all the explanatory variables held constant, the dependent variable market price Increase by 82.8102 units. In above model, intercept is showing the positive significant relationship. RIV direct proportionally related to dependent variable market price of bank share.
The value of R-Squared is 0.71 in this model which shows that 71 % variation in the dependant variable is described by the independent variables of the commercial banks and 29 % variation is not explained by the independent variables or internal factors. In this model the Adjusted R square is 0.69 which is almost same to the value of R-Squared 0.69 which indicates that samples are not over fitted and there is no problem generalizability. These values are very close, anticipating minimal shrinkage based on this indicator.
Figure 3. Panel Series of MP versus PER (with least squares fit) of Indian Private Banks
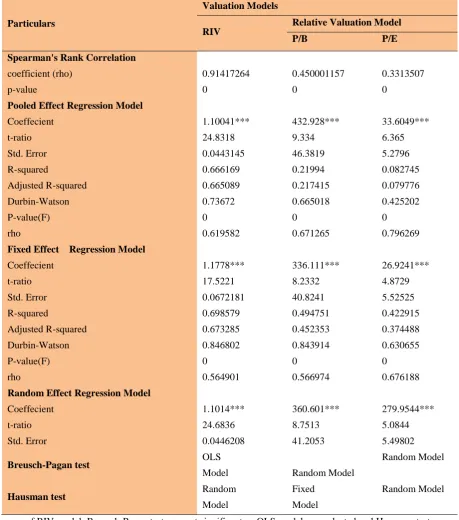
Table 5. Empirical Comparison of RIV Model and Relative Valuation Models for Public Sector Bank (24 Banks)
Particulars
Valuation Models
RIV
Relative Valuation Model
P/B P/E
Spearman's Rank Correlation
coefficient (rho) 0.91417264 0.450001157 0.3313507
p-value 0 0 0
Pooled Effect Regression Model
Coeffecient 1.10041*** 432.928*** 33.6049***
t-ratio 24.8318 9.334 6.365
Std. Error 0.0443145 46.3819 5.2796
R-squared 0.666169 0.21994 0.082745
Adjusted R-squared 0.665089 0.217415 0.079776
Durbin-Watson 0.73672 0.665018 0.425202
P-value(F) 0 0 0
rho 0.619582 0.671265 0.796269
Fixed Effect Regression Model
Coeffecient 1.1778*** 336.111*** 26.9241***
t-ratio 17.5221 8.2332 4.8729
Std. Error 0.0672181 40.8241 5.52525
R-squared 0.698579 0.494751 0.422915
Adjusted R-squared 0.673285 0.452353 0.374488
Durbin-Watson 0.846802 0.843914 0.630655
P-value(F) 0 0 0
rho 0.564901 0.566974 0.676188
Random Effect Regression Model
Coeffecient 1.1014*** 360.601*** 279.9544***
t-ratio 24.6836 8.7513 5.0844
Std. Error 0.0446208 41.2053 5.49802
Breusch-Pagan test OLS
Model Random Model
Random Model
Hausman test Random
Model
Fixed Model
Random Model
In case of RIV model, Breusch-Pagan test was not significant so OLS model was selected and Hausman test was not significant so Radom effect model was selected .In case of P/B model, Breusch-Pagan test was significant so RE model was selected and Hausman test was significant so FE model was selected. In case of P/E model, Breusch-Pagan test was significant so RE model was selected and Hausman test was not significant so RE model was selected.
Figure 5. Panel Series of Market price, RIV, PER and PBR of Public Sector Banks for 15 years
Through Panel graph of Indian Public Sector Bank it can be analysed that variation in market price and RIV model is almost similar whereas it is different in case of relative valuation models.
In case of RIV model, Radom effect model is selected by performing Breusch-Pagan test and Hausman test in this study for regression analyses. The coefficient of constant parameter of the banks shows a negative figure of -21.62, which implies that if all the explanatory variables held constant, the dependent variable market price decreases by-21.62 units .In above model, intercept is showing the negative relationship. RIV direct proportionally related to dependent variable market price of bank share. RIV coefficient is 1.1014 which indicates positive significant relationship with market price.
The value of R-Squared is 0.69 in this model which shows that 69 % variation in the dependant variable is described by the independent variables of the commercial banks and 31 % variation is not explained by the independent variables or internal factors. In this model the Adjusted R square is 0.67 which is almost same to the value of R-Squared 0.69 which indicates that samples are not over fitted and there is no problem generalizability. These values are very close, anticipating minimal shrinkage based on this indicator.
Figure 6. Panel Series of MP versus RIV (with least squares fit) of Indian Public Banks
Table 6. Empirical Comparison of RIV Model and Relative Valuation Models for Indian Bank (40 Banks)
Particulars RIV
Relative Valuation Model
P/B P/E
Spearman's Rank Correlation
coefficient (rho) 0.82344582 0.51075454 0.41466214
p-value 0 0 0
Pooled Effect Regression Model
Coeffecient 1.08311*** 1670.652*** 5.37759***
t-ratio 31 7.8237 2.897
Std. Error 0.0349409 21.4286 1.85624
R-squared 0.641495 0.102323 0.015389
Adjusted R-squared 0.640827 0.100652 0.013555
Durbin-Watson 0.669417 0.408534 0.343272
P-value(F) 0 0 0
rho 0.656789 0.791516 0.825665
Fixed Effect Regression Model
Coeffecient 1.1767 *** 172.476*** 5.15.97***
t-ratio 22.8675 7.8345 3.0583
Std. Error 0.0514574 22.0148 1.68426
R-squared 0.701871 0.455885 0.400089
Adjusted R-squared 0.677925 0.412181 0.351903
Durbin-Watson 0.842521 0.68117 0.560977
P-value(F) 0 0 0
rho 0.565301 0.640832 0.700175
Random Effect Regression Model
Coeffecient 1.11757*** 171.755*** 5.17612***
t-ratio 27.3827 8.094 3.1233
Std. Error 0.0408132 21.22 1.65723
Breusch-Pagan test Random
Model Random Model
Random Model
Hausman test Random
Model Random Model
Fixed Model
In case of RIV model, Breusch-Pagan test was significant so RE model was selected and Hausman test was not significant so RE was selected. In case of P/B model, Breusch-Pagan test was significant so RE model was selected and Hausman test was not significant so RE model was selected. In case of P/E model, Breusch-Pagan test was significant so RE model was selected and Hausman test was significant so FE model was selected.
Figure 9. Panel Series of Market price, RIV, PER and PBR of Indian Banks for 15 years
Through Panel graph of Indian Banks it can be analysed that variation in market price and RIV model is almost similar whereas it is different in case of relative valuation models.
In case of RIV model, Radom effect model is selected by performing Breusch-Pagan test and Hausman test in this study for regression analyses. The coefficient of constant parameter of the banks shows a positive figure of 20.7448, which implies that if all the explanatory variables held constant, the dependent variable market price increases by20.7448units .In above model, intercept is showing the negative relationship. RIV direct proportionally related to dependent variable market price of bank share. RIV coefficient is 1.1014 which indicates positive significant relationship with market price.
The value of R-Squared is 0.70 in this model which shows that 70 % variation inthe dependant variable is described by the independent variables of the commercial banks and 30 % variation is not explained by the independent variables or internal factors. In this model the Adjusted R square is 0.67 which is almost same to the value of R-Squared 0.70 which indicates that samples are not over fitted and there is no problem generalizability. These values are very close, anticipating minimal shrinkage based on this indicator.
Figure 10. Panel Series of Market Price versus RIV (with least squares fit) of Indian Banks
Figure 12. Panel Series of Market Price Versus PBR (with least squares fit) of Indian Banks:
From above all three cases it is analysed that Residual Income valuation (RIV) model highly correlated with Market price of banks share and also represent a high linear relationship with market price as compared to other models.
6. Finding and Conclusion
Empirical evidence suggests that the residual income model is superior to the relative valuation model when it comes to measuring bank shareholder value. The results of the comparison suggest that value estimates from the residual income model are even more reliable for banks. On this basis, we conclude that residual income is an appropriate value estimate for the shareholder value of banks. There was positive significant relationship identified between the intrinsic value of bank share determined by RIV model and Market price of share in all the cases by performing correlation and Regression study. This study will be useful for forecasting the possible changes in market price. It was identified that determinants vary as per the working and regulatory condition as determinants impacting private, public and Indian banks were not similar so panel regression model will vary for each cases.
It also identified that Public Sector Bank in India shows more positive progressive trend as compared to private Sector Bank even after the fact that public Sector Bank has higher regulatory restriction as compared to Private Sector banks.
This research will serve very useful for the banker to plan and take decision regarding shareholder value creation by implementing proper valuation model for getting appropriate value estimate and also adopting proper internal performance measure for having accurate and regular check on the process of value creation. RIV Model will help in predicting market price as it will reflect proper variation in market price in future. Since stock prices reflect investor expectations about future cash flows, predicting appropriate market price has become essential. This study will be also useful to Indian financial analyst as they will be able to apply proper valuation models to suit banking industry to get accurate value estimate for forecasting about the stocks instead of just traditionally following Relative valuation model that is P/E and P/B as it is done for non-financial firm.
References
Becher, David A. (1999). The Valuation Effects of Bank Mergers. Journal of Corporate Finance, 6(2), 189-214. https://doi.org/10.1016/S0929-1199(00)00013-4
Creswell, J.W. (2003). Research Design: Qualitative, Quantitative, and Mixed Methods Approaches. SAGE.
Damodaran, A. (2000). Investment Valuation: Tools and Techniques for Determining the Value of Any Asset. 2d ed. New York: John Wiley & Sons, Inc., pp. 182.
Damodaran, Aswath. (2002). Investment Valuation. New York: John Wiley & Sons Inc.
Damodaran, Aswath. (2009). Valuation Approaches and Metrics. Foundations and Trends in Finance, 1(8), 693-784. https://doi.org/10.1561/0500000013
Dayal, R., Luther, L., Neu, P. & Tang, T. (2010). After the storm - creating value in banking 2010. Boston Consulting Group.
Dechow, P.M. et al. (1999). An empirical assessment of the residual income valuation model. Journal of Accounting and Economics, 26. https://doi.org/10.1016/S0165-4101(98)00049-4
Dermine Jean. (2009). Bank Valuation with an Application to the Implicit Duration of non-Maturing Deposits. International Journal of Banking, Accounting and Finance, 1-37.
Fiordelisi Franco. (2010). Value Creation in Banking. http://ssrn.com/abstract=965441
Frankel, Richard & Lee, Charles M. C. (1998). Accounting Valuation, Market Expectation, and Cross-sectional Stock Returns. Journal of Accounting and Economics, 25(3), 283-319. https://doi.org/10.1016/S0165-4101(98)00026-3
Gross Stephanie. (2006). Banks and Shareholder Value. Gabler Edition Wissenschaft.
Harry Huizinga & Laeven Luc. (2010). Bank Valuation and Regulatory Forbearance During a Financial Crisis. http://ssrn.com/abstract = 1434359
Horvátová, E. (2010). Methods of Bank Valuation. journal of Economic Analysis, 43(1-2), 50-60.
Koller, T et al, Goedhart & Wessels. (2010). Valuation: Measuring and Managing the Value of Companies, Second Edition, John Wiley, 1996.
MSDW. (2001). Valuing Financial Stocks with Residual Income. Morgan Stanley Dean Witter, Equity Research North America.
Oleg Deev. (2011). Methods of Bank Valuation: A Critical Overview. Financial Assets and Investing, 3, 1-12. R..C. Merton. (1973). Anintertemporal Capital Assets Pricing Model. Econometrica, 41.
https://doi.org/10.2307/1913811