Doctoral School in Materials Science and Engineering
Color masterbatches for polyamide 6 fibers.
Optimization of compounding and spinning processes.
Physical-chemical characterization of industrial products.
Mauro Buccella
April 2014
X
X
V
I
c
y
c
Doctoral School in Materials Science and Engineering
Color masterbatches for polyamide 6 fibers.
Optimization of compounding and spinning processes.
Physical-chemical characterization of industrial products.
Mauro Buccella
Academic Tutors:
Prof. Luca Fambri
Ing. Andrea Dorigato, PhD
Industrial Tutor:
Dott. Mauro Caldara
April 2014
X
X
V
I
c
y
c
Abstract
A
BSTRACTIn the last years the coloration industry has become increasingly important because it strongly influences the market of the plastic materials.
The request of objects with new and particular colors, sometimes with imperceptible differences, combined with high physical and chemical performances, has made the coloration technology more sophisticated and complex. Moreover, the recent legislations (i.e. REACH standard) suggest the use of products with lower human health impact. Therefore, a continuous research and development of new colorants and technologies is needed, in order to obtain environmental friendly manufacturing processes and market products.
As concerns the carpet sector, the solution dyed process of the fibers is industrially preferable rather than the coloration through batch of raw yarns. This is because the first process involves the production of monoconcentrated color masterbatches, their mixing in order to obtain the final color masterbatch and its addition into the polymer matrix during fiber spinning. On the other hand, the production of carpet from raw fibers shows higher environmental impact because the dyeing baths contain colorants and additives environmentally harmful and difficult to remove with water treatments. The solution dyed process is more difficult from an industrial point of view, because during the melt spinning three problems can occurred: (i) clogging of filtration system during spinning due to agglomerates, deposits and degraded material, (ii) formation of polymer drops under the spinneret due to degradation phenomena that can cause premature fibers breakage and (iii) fibers breakage during drawing process.
Abstract
process optimization in order to increase the quality of the final product and to minimize their environmental impact.
The three steps of the solution dyed bulk continuous process were investigated: (i) production of monoconcentrated masterbatch, (ii) production of color masterbatch and (iii) mass pigmentation during melt spinning process.
In the first part of the work, a detailed microstructural characterization was performed to assess the different morphologies and surface properties of the most important color pigments used in the automotive sector. The most problematic monoconcentrated masterbatches were industrially produced using different processing set-up, related to different specific mechanical energy applied to the material during the production. Furthermore, a detailed analysis of the pigment dispersion state in the matrix was performed, through the evaluation of the filterability, the Relative Color Strength (RCS) and the rheological behavior of the monoconcentrated masterbatches. Moreover the thermal stability of the products was investigated by chemical characterization and rheological measurement. The industrial production process for each monoconcentrated masterbatch was optimized, obtaining a product quality improvement and a significant production cost reduction.
In the second part of the work, the blue color masterbatch was selected because it is a critical product for the melt spinning process. This color masterbatch has the peculiarity to clog the filtration system during spinning process, and a frequent change of filters is thus required. This monoconcentrated color masterbatch was produced in two different ways: standard and optimized processes.
Abstract
reduce the clogging power of the product of about 30%, and to increase its thermal stability. Furthermore even the monomer concentration, that is related to the drop formation under the spinneret and to the filament breakage, was reduced.
The third part was focused on the characterization of the industrial yarn colored with the standard and the optimized blue masterbatches, in order to evaluate the effect of the pigment dispersion on the final products. The optimized yarn showed an improvement of the mechanical properties, in particular of the elastic modulus, compared with the standard product. This is very important because, for the yarns used in the carpet industry, the higher elastic modulus, the higher carpet resistant to the compressive stresses during its service life. The pigment dispersion improvement enhanced the heterogeneous nucleation activity of polyamide 6 during the melt spinning, resulting in a higher content of the more stable α phase compared to the γ crystalline phase. The thermal and UV degradation resistance were also improved.
Table of Contents
T
ABLE OFC
ONTENTSINTRODUCTION ... 1
1. BACKGROUND... 3
1.1. PHYSICAL PROPERTIES OF COLOR... 3
1.1.1. ILLUMINANT ... 3
1.1.2. OBJECT ... 5
1.1.3. THE OBSERVER ... 7
1.2. COLOR MATCHING ... 8
1.3. COLOR MEASUREMENTS ... 12
1.4. COLORATION TECHNOLOGY ... 13
1.4.1. PIGMENT PROPERTIES ... 14
1.4.2. MASS PIGMENTATION OF SYNTHETIC FIBERS ... 16
1.5. EXTRUSION PROCESS ... 19
1.6. MELT SPINNING PROCESS ... 23
2. EXPERIMENTAL ... 29
2.1. MATERIALS ... 29
2.1.1. POLYAMIDE 6 ... 29
2.1.2. COLOR PIGMENTS ... 33
2.1.2.1. White Pigment (PW6) ... 34
Table of Contents
2.1.2.3. Brown Pigment (PBr24) ... 35
2.1.2.4. Red Pigment (PR101) ... 36
2.1.2.5. Blue Pigment (PB15:3) ... 37
2.1.2.6. Green Pigment (PG7) ... 38
2.1.2.7. Violet Pigment (PV23) ... 39
2.1.2.8. Red Pigment (PR149) ... 40
2.2. MATERIALS PROCESSING ... 41
2.2.1. MONOCONCENTRATED MASTERBATCH ... 41
2.2.2. COLOR MASTERBATCH ... 46
2.2.3. FIBER SPINNING ... 48
2.3. EXPERIMENTAL ACTIVITIES ... 52
2.3.1. MICROSTRUCTURAL CHARACTERIZATION ... 52
2.3.1.1. Density measurements ... 52
2.3.1.2. Evaluation of the pigment surface properties ... 52
2.3.1.3. Microscopy techniques ... 54
2.3.1.4. Light Scattering analysis ... 54
2.3.1.5. Differential Scanning Calorimetry (DSC) ... 55
2.3.1.6. Infrared (IR) Spectroscopy ... 56
2.3.2. FILTERABILITY DETERMINATION ... 57
2.3.3. COLOR MEASUREMENTS ... 58
2.3.3.1. Color Difference evaluation ... 58
2.3.3.2. Color Strength evaluation ... 58
2.3.4. PHYSICAL-CHEMICAL CHARACTERIZATION ... 59
2.3.4.1. Rheological measurements ... 59
2.3.4.2. Relative and Intrinsic viscosity of solubilized polymer ... 60
2.3.4.3. End-groups analysis ... 61
2.3.4.4. Gas chromatography for monomer concentration ... 61
Table of Contents
3. RESULTS AND DISCUSSION ... 63
3.1. MICROSTRUCTURAL PIGMENTS CHARACTERIZATION ... 63
3.1.1. SEM OBSERVATION ... 63
3.1.2. DENSITY MEASUREMENTS ... 65
3.1.3. EVALUATION OF THE PIGMENT SURFACE PROPERTIES ... 67
3.1.4. LIGHT SCATTERING MEASUREMENTS ... 71
3.2. MONOCONCENTRATED MASTERBATCH SELECTION ... 73
3.3. PRODUCTION PROCESS OPTIMIZATION OF MONOCONCENTRATED MASTERBATCHES ... 75
3.3.1. BLUE MONOCONCENTRATED MASTERBATCH ... 76
3.3.1.1. Filter-Test measurements ... 76
3.3.1.2. Color Strength measurements ... 78
3.3.1.3. Rheological measurements ... 79
3.3.1.4. Viscosity analysis ... 82
3.3.1.5. End groups determination ... 83
3.3.1.6. Monomer concentration analysis ... 84
3.3.1.7. DSC and Crystallization kinetics analysis ... 85
3.3.2. GREEN MONOCONCENTRATED MASTERBATCH ... 89
3.3.2.1. Filter-Test measurements ... 89
3.3.2.2. Color Strength measurements ... 91
3.3.2.3. Rheological measurements ... 92
3.3.2.4. Viscosity analysis ... 95
3.3.2.5. End groups determination ... 96
3.3.2.6. Monomer concentration analysis ... 97
3.3.2.7. DSC and Crystallization kinetics analysis ... 98
3.3.3. VIOLET MONOCONCENTRATED MASTERBATCH ... 101
Table of Contents
3.3.3.2. Color Strength measurements ... 103
3.3.3.3. Rheological measurements ... 104
3.3.3.4. Viscosity analysis ... 108
3.3.3.5. End groups determination ... 109
3.3.3.6. Monomer concentration analysis ... 110
3.3.3.7. DSC and Crystallization kinetics analysis ... 111
3.3.4. BLACK MONOCONCENTRATED MASTERBATCH ... 114
3.3.4.1. Filter-Test measurements ... 114
3.3.4.2. Color Strength measurements ... 116
3.3.4.3. Rheological measurements ... 117
3.3.4.4. End groups determination ... 118
3.3.4.5. DSC analysis... 119
3.3.5. CONCLUSIONS ON PRODUCTION PROCESS OPTIMIZATION ... 120
3.4. CHARACTERIZATION OF COLOR MASTERBATCHES ... 122
3.4.1. FILTER-TEST ANALYSIS ... 122
3.4.2. RHEOLOGICAL MEASUREMENTS ... 125
3.4.3. VISCOSITY ANALYSIS ... 126
3.4.4. END GROUPS DETERMINATION ... 127
3.4.5. MONOMER CONCENTRATION ANALYSIS ... 128
3.5. CHARACTERIZATION OF FIBERS ... 130
3.5.1. QUASI-STATIC TENSILE TESTS ON FIBERS ... 130
3.5.2. MICROSTRUCTURAL CHARACTERIZATION ... 132
3.5.3. THERMAL-AGING RESISTANCE ... 133
3.5.4. UV-AGING RESISTANCE ... 137
3.5.5. GENERAL COMPARISON ... 141
3.6. INDUSTRIAL TEST ... 143
3.6.1. CLOGGING PHENOMENON AT THE EXTRUDER FILTER ... 143
Table of Contents
4. CONCLUSIONS ... 147
5. REFERENCES ... 149
6. PUBLICATIONS ... 167
7. CONGRESS CONTRIBUTIONS... 169
List of Figures
L
IST OFF
IGURESFigure 1.1: Electromagnetic spectrum of light ... 4
Figure 1.2: Spectral distribution curves for different white light sources in the visible spectrum [15] ... 4
Figure 1.3: Schematic representation of light-matter interaction [8] ... 6
Figure 1.4: Representation of light reflection for colored materials ... 6
Figure 1.5: Scheme of human eye ... 7
Figure 1.6: Normalized absorbance of cones and rods photoreceptors ... 8
Figure 1.7: Color matching functions ... 9
Figure 1.8: (a) Tristimulus color space XYZ and (b) (x,y) chromaticity diagram [24] ... 9
Figure 1.9: Representation of Lab color space ... 11
Figure 1.10: Schematic diagram showing the principal component of spectrophotometer. S: light source; ... 13
Figure 1.11: Schematic representation of dyes solubilization... 13
Figure 1.12: Schematic representation of pigments dispersion ... 14
Figure 1.13: Representation of primary particle, aggregate and agglomerate [40] . 14 Figure 1.14: Primary particles and aggregates with different geometry [41] ... 15
Figure 1.15: Schematic diagram of mass pigmenting in melt spinning process. ... 16
Figure 1.16: The variation of scattering (A) and the color strength (B) with the particle size [8] ... 17
Figure 1.17: Scheme of extrusion line ... 19
Figure 1.18: Schematic representation of single screw extruder [64] ... 20
Figure 1.19: Sections of screw [71] ... 20
Figure 1.20: Schematic representation of vented screw [71] ... 22
Figure 1.21: Schematic representation of counter-rotating screws [73]... 22
List of Figures
Figure 1.23: Scheme of spinneret orifice and the relative fiber cross section ... 24
Figure 1.24: Schematic diagram of spinning line [76] ... 25
Figure 1.25: Representation of filament swelling [86, 87] ... 26
Figure 1.26: Fiber structure in high speed spinning [76] ... 26
Figure 1.27: Model of microfibrillar nylon 6 morphology [79, 90] ... 27
Figure 2.1: Chemical structure of caprolactam and polyamide 6 repeating unit ... 29
Figure 2.2:α crystalline cell of polyamide 6. β=67.5° ... 31
Figure 2.3:γ crystalline cell of polyamide 6. ... 32
Figure 2.4: PW6 pigment particle ... 34
Figure 2.5: Chemical structure of PB15:3 ... 37
Figure 2.6: Chemical structure of PG7 ... 38
Figure 2.7: Chemical structure of PV23 ... 39
Figure 2.8: Chemical structure of PR149 [122] ... 40
Figure 2.9: Distributive and dispersive mixing representation ... 42
Figure 2.10: Schematic representation of monoconcentrated masterbatch process 42 Figure 2.11: Yellow monoconcentrated masterbatch... 43
Figure 2.12: Melt spinning plant scheme ... 48
Figure 2.13: Representative scheme of drawing-texturizing unit. ... 50
Figure 3.1: SEM images of color pigments. (a) white pigment PW6; (b) black pigment PBk7; ... 64
Figure 3.2: Density measurements on the different color pigments considered in this work ... 66
Figure 3.3: Porosity measurements of color pigment powders. Representative curves of the surface properties of Pigment White PW7 (a, b, c) and Brown PBr24 (d, e, f). (a-d) specific gas volume adsorbed vs relative pressure, (b-e) linear plot for the evaluation of the BET surface area, (c-f) pore volume distribution ... 68
List of Figures
List of Figures
List of Figures
Figure 3.38: Intrinsic viscosity values of monoconcentrated violet masterbatch
chips prepared ... 109
Figure 3.39: End groups analysis on monoconcentrated violet masterbatches with different process conditions. (●) aminic end groups and (▲) carboxylic end groups ... 110
Figure 3.40: Monomer concentration of the monoconcentrated violet masterbatches ... 111
Figure 3.41: Cooling scan for monoconcentrated violet masterbatch at five different cooling rate ... 112
Figure 3.42: Arrhenius-type plot for PA6 and monoconcentrated violet masterbatches ... 113
Figure 3.43: Representative Filter-Test curves of monoconcentrated black masterbatches ... 115
Figure 3.44: FPV and FPVII values of monoconcentrated black masterbatches .. 116
Figure 3.45: Relative Color Strength (RCS) of monoconcentrated black ... 117
Figure 3.46: Rheological curves of neat PA6 matrix with a residence time of (●) 3 minutes ... 118
Figure 3.47: End groups analysis on neat PA6 and on monoconcentrated black masterbatches at a residence time of 3 and 23 minutes ... 119
Figure 3.48: FPV values of the monoconcentrated masterbatches ... 121
Figure 3.49: RCS values of the monoconcentrated masterbatches ... 121
Figure 3.50: Pressure curves of Standard Blue Masterbatch (BM-S) ... 123
Figure 3.51: FPV and FPVII values of Standard Blue Masterbatch (BM-S) ... 123
Figure 3.52: Rheological curves of Blue Masterbatch Standard (BM-S) with a ... 125
Figure 3.53: Rheological curves of Blue Masterbatch Optimized (BM-O) with a 126 Figure 3.54: Intrinsic viscosity values of BM-S and BM-O as produced and ... 127
Figure 3.55: End groups variation of BM-S and of BM-O blue color masterbatches ... 128
Figure 3.56: Monomer concentration of the BM-S and BM-O ... 129
List of Figures
List of Tables
L
IST OFT
ABLESTable 2.1: Technical datasheet of AQ24401 ... 32
Table 2.2: Inorganic color pigments ... 33
Table 2.3: Organic color pigments... 33
Table 2.4: Technical datasheet of PW6 ... 34
Table 2.5: Technical datasheet of PBk7... 35
Table 2.6: Technical datasheet of PBr24 ... 36
Table 2.7: Technical datasheet of PR101 ... 36
Table 2.8: Technical datasheet of PB15:3 ... 37
Table 2.9: Technical datasheet of PG7 ... 38
Table 2.10: Technical datasheet of PV23 ... 39
Table 2.11: Technical datasheet of PR149 ... 40
Table 2.12: Pigment concentration in the monoconcentrated masterbatches ... 43
Table 2.13: Technical specification of TM-M58 extruder ... 44
Table 2.14: Process parameters used for monoconcentrated masterbatches production ... 44
Table 2.15: Production processes set up for monoconcentrated masterbatches ... 45
Table 2.16: SME for all production processes of monoconcentrated masterbatches ... 46
Table 2.17: Technical specifications of EBC40HT extruder ... 46
Table 2.18: Blue Color masterbatch formulation ... 47
Table 2.19: Blue color masterbatch notation ... 47
Table 2.20: Blue Yarns notation ... 51
Table 3.1: Measured and Datasheet density ... 66
Table 3.2: Results of the surface properties of color pigments ... 70
Table 3.3: Primary particles diameters calculated through BET analysis ... 70
List of Tables
List of Tables
Introduction
I
NTRODUCTIONThis research project was developed from a collaboration between Aquafil S.p.A. (Arco, Italy) and the University of Trento. Aquafil is a multinational company specialized in Polyamide 6 polymerization, fiber spinning and compounding production [1].
The first polyamide, nylon 66 or polyamide 66, was synthesized by W.H. Carothers at Du Pont laboratory in 1934. Afterwards in 1938, at I.G. Farbenindutrie, Schlack developed nylon 6, or polyamide 6, obtained by ring opening polymerization of caprolactam. Polyamides or nylons were the first synthetic polymer used for fiber applications and their rapid market growth was determined by their similar appearance of silk. For this reason they were initially used in the textile and carpet sector and only later for engineering purposes, because of their excellent mechanical and chemical properties [2-5].
Introduction
Considering these two processes the production of carpet from raw fibers shows higher environmental and human health impact compared to those produced from solution dyed process. This because dyeing baths contain colorant and additives environmentally harmful and difficult to remove with water treatments.
Due to the recent legislation (i.e. REACH standard [7]) that suggest the use of product with lower human health impact, the solution dyed process is industrially preferable rather than the raw fibers production.
These two processes show an important difference in the production efficiency and this can be related to the color masterbatch addition. The major effects that characterized the solution dyed spinning process are: (i) clogging of filtration system during spinning due to agglomerates, deposits and degraded material, (ii) formation of polymer drops under the spinneret due to degradation phenomena that can cause premature fibers breakage and (iii) fibers breakage during drawing process. On the basis of these considerations, the aim of this work is the investigation and understanding the specific materials-process-property relationship in an industrial reality, in order to optimize the production processes and minimize the environmental impact. In particular, the project concerns the improvement and the production process optimization of the color masterbatches and their use in the so called solution dyed process of synthetic fibers.
Background
1.
B
ACKGROUND1.1. PHYSICAL PROPERTIES OF COLOR
Color is the visual perception generated by nerve signals that the photoreceptors in the retina send to the brain when they are hit by an electromagnetic radiation in the visible spectrum [8]. Different wavelengths are perceived to be different colors. Generally speaking, the presence of color requires three fundamental factors: (i) the light source, (ii) the object that interacts with the electromagnetic radiation emitted by the source, and (iii) the human eye that observes the phenomenon [9]. Color is a very complex phenomenon because it is influenced by physical, chemical, psychological and physiological processes [10, 11].
1.1.1. ILLUMINANT
An object is visible and colored only if an electromagnetic radiation interact with its surface and the reflected spectrum reach the retina of human eye [8].
The electromagnetic spectrum is divided in different frequency intervals, that denote different nature of radiant energy, as it is reported in Figure 1.1. The human eye is sensitive only to a small frequencies interval, called visible light, with wavelength between 380 to 760 nm [12]. The visible spectrum is reported in the Figure 1.1 and each frequency corresponds to a specific color perceived by the eye.
Background
Figure 1.1: Electromagnetic spectrum of light
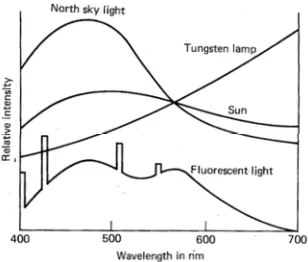
Even if the color of the object that they illuminate appears quite similar, there are slight differences between these sources, because of their different emission spectrum [13, 14], as reported in Figure 1.2.
Figure 1.2: Spectral distribution curves for different white light sources in the visible spectrum [15]
Background
sources. The electrons stream, produced by electrical power, collides with the atom gas in the lamp and excites them to an higher energy level. This higher state is unstable and so the excited electrons come back to a more stable lower energy level. This motion release a photon in the ultraviolet (UV) region of the spectrum at 253.7 and 185 nanometers (nm). This photon are absorbed by electrons in the atom of interior coating of lamp that, in the same way, emit photon in the visible spectrum [15, 16].
1.1.2. OBJECT
An object appears colored because it interacts with the light, absorbing some wavelength radiations and reflecting some others [17].
The interaction of light with bulk matter is a phenomenon related to the surface and physical properties of materials (see in Figure 1.3). When the electromagnetic radiation reaches the object, a part of the incoming beam is reflected in two ways. The specular reflection occurs when there is a smooth surface like mirror and the angle of incidence is equal to the angle of reflection and the color is the same of incoming light. Part of incoming light penetrates into the object near the surface and can be absorbed by the molecular chromophoric groups or reflected back toward the surface. This reflected light interacts with the particles and is scattered in all direction producing a diffuse reflection [18]. The diffuse radiation reveals the color of object strongly compare specular reflection because it is generated from a deep interaction with the matter. The other part of radiation penetrates deeply inside the material and can be absorbed or scattered [19].
Background
If the material is transparent the incoming beam is deflected when it enters into the materials due to different refractive index and when it reaches the opposite surface of the object it can be internally reflected or transmitted [8] .
Figure 1.3: Schematic representation of light-matter interaction [8]
An object appears in a particular color because it reflects the light with a specific wavelength and absorbs the other part of radiation. For example, a blue object reflects blue light radiation and absorbs all other wavelength of spectrum as it is represented in Figure 1.4.
Background
1.1.3. THE OBSERVER
The observer of the color is the human eye, in particular their photosensitive parts, able to collect the light radiation and to produce specific stimuli elaborated by the brain [17]. In Figure 1.5 the scheme of the human eye is reported.
Figure 1.5: Scheme of human eye
Background
color region of spectrum [11, 17, 21]. In Figure 1.6 the normalized absorbance of eye photoreceptors are reported.
Figure 1.6: Normalized absorbance of cones and rods photoreceptors
For these reasons the human color vision is trichromatic but it is strongly influenced by a lot of variables like age, memory, cultural background. Moreover important variation with the human population in the cone cells sensitivity are detected.
1.2. COLOR MATCHING
Because of numerous processes and variables that are involved in the color perception phenomenon, standard method was developed in order to measure color in an objective way. Light sources and observers have been standardized by the Commission Internationale de l’Eclairage (CIE).
The standard illuminant used in the color measurements are the incandescent light (A), the north sky daylight (D65) and the cool white fluorescent light (F2) [18]. They are described by spectral power distribution D(λ). The standard colorimetric
Background
three types of cones [18]. In Figure 1.7 the three color matching function are reported.
Figure 1.7: Color matching functions
The three color matching functions give the amount of the X, Y and Z primary imaginary colors required to define the spectral stimulus of unit radiance for the standard observer and the unit plane of the tristimulus color space XYZ (Figure 1.8a) is called CIE 1931 system or (x,y)-chromaticity diagram (Figure 1.8b) [23].
a) b)
Background
The chromaticity coordinates used to describe the pure color hue and saturation, are reported in the Equations (1), (2) and (3):
̃ (1)
̃ (2)
̃
̃ (3)
With the condition in Equation (4):
1 (4)
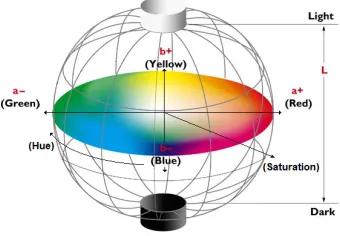
In 1976, CIE introduced a new color model, called CIELab in order to linearize the color representation with respect to the human color perception and to produce a more intuitive color system [23, 25] . Today the CIELab is the most used system to measure color in the industry by spectrophotometers. CIELab color space is a sphere and the new coordinates, derived from a transformation of tristimulus values, are reported in the Equations (5), (6) and (7):
∗ 116 ∙ 16 (5)
∗ 500 ∙ (6)
∗ 500 ∙ (7)
Background
represents the difference between yellow (+b*) and blue (-b*), as reported in Figure 1.9. Moreover the angle between a* and b* axes represents the color Hue and the radial distance from the center of the sphere is the color Saturation or the Chroma.
Figure 1.9: Representation of Lab color space
In order to evaluate the color differences between two samples (∆E*) CIE developed a formula using color coordinates in Lab space (Equation (8)) [23, 26, 27]:
∆!"#∗ $ %∗ ∗ % %∗ ∗ % %∗ ∗ % (8)
Where ∆!"#∗ & 2,3 corresponds to a just noticeable difference [28].
In 1984 a new color difference formula (Equation (9)), based on LCh model, was developed and recommended for industrial pass/fail evaluation by Color Measurement Committee (CMC):
∆!*+* ,:.∗ / %
∗ ∗
0 ∙ 12
% 3
%∗ 3∗
4 ∙ 1*
% ∆5
"#∗
16 %
Background
Where SL, SC and SH are the compensation of lightness, chroma and hue
respectively. The factors l (lightness) and c (chroma) allowing the users to weight the difference based on the ratio of l:c that is deemed appropriate for the application. Commonly used values are 2:1 for acceptability [29] and 1:1 for the detection limit. This formula is more reliable and in agreement with the observer vision and it includes the weighting functions in order to compensate the lightness, chroma and hue differences in relation to nature and use of the product evaluated [29].
1.3. COLOR MEASUREMENTS
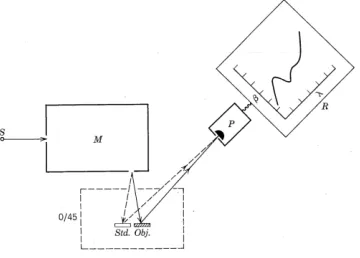
The most important technique to evaluate the color of products both in industrial and in research fields is the spectrophotometer [11]. Spectrophotometers are instruments for measuring reflectance, transmittance or absorbance of a sample as a function of wavelength [30]. Light reflected by a material is collected in an integration sphere, normalized to the source light of the reflectance, and calibrated with the measurement of a perfect diffuse white (pdw) standard (100% reflection) and a black box (zero reflection) over the entire wavelength spectrum of visible light. The result of this test is the reflection factor (RF) defined as the ratio between the reflectance of sample and of reference, reported in Equation (10) [31].
78 77 9 :;0<;=> (10)
Background
Figure 1.10: Schematic diagram showing the principal component of spectrophotometer. S: light source;
M: monochromator; Obj.: sample to be measured; Std.: standard of reflectance factor; P: photocell; R: read out unit [11]
1.4. COLORATION TECHNOLOGY
Since prehistory coloration technology has played an important role in our society from on anthropological, aesthetic, functional and economic point of view [33, 34]. Also the market of plastic materials is strongly influenced by the coloration industry, because of the growing demand of innovative color products with high physical, chemical and mechanical performances.
The coloration of plastic materials can be made basically in two ways: using soluble dyes or color pigments [35]. Soluble dyes are organic substances that can be solubilized with the plastic substrate. Their good chemical affinity with the polymer matrix results in the absence of visible particles and in the retention of the transparency of the compounded materials. In the Figure 1.11 the dyes solubilization phenomenon is represented.
Background
Color pigments are very fine and insoluble particles that maintain their original properties both during the manufacturing processes and during the whole life of the plastic product [10, 35]. Pigments impart color to the plastic medium by a selective light absorption in the visible spectrum [33]. In Figure 1.12 the dispersion process of pigments is reported.
Figure 1.12: Schematic representation of pigments dispersion
1.4.1. PIGMENT PROPERTIES
Color pigments show three structural levels (Figure 1.13). The primary particles are obtained during their synthesis and have small particle size and tend to aggregate. The aggregates are formed by primary particles that tend to collapse because of their high surface energy. This results in a reduction of specific surface area. Finally, agglomerates can be obtained by the physical bonding between aggregates [36-39].
Figure 1.13: Representation of primary particle, aggregate and agglomerate [40]
Background
The primary particles of the most used pigments are composed by tiny molecular crystals, and show dimensions ranging from 20 to 500 nm [41]. For this reason they are called nano colorants [36].
Figure 1.14: Primary particles and aggregates with different geometry [41]
In order to specifying the nature of a colorant, the Color Index (CI), defined by Society of Dyers and Colorists and the American Association of Textile Chemists, can be used.
Generally speaking, color pigments for plastic have to satisfy some requirements: (i) total insolubility in the polymer in which they are incorporated, (ii) easy dispersion within the matrix, (iii) chemical stability under severe thermo-mechanical processing conditions, (iv) compatibility with the other additives used, (v) non-toxicity and (vi) environmental friendliness [36, 41].
Except for titanium dioxide (TiO2), inorganic pigments are characterized by high
Background
Pigment Black 7 (Carbon Black) [44-46]. Organic pigments are polycyclic molecules containing chromophoric groups. Due to their insolubility in most polymeric matrices, they show a lower dispersability with respect to organic pigments, especially in polyolefins. Their heat resistance is often limited to 280 °C [36]. Unlike inorganic pigments, it has been also found that organic pigments play a marked nucleating activity in polymer matrices, increasing crystallization kinetics [47-53]. The most utilized organic pigments are blue and green copper phthalocyanine (CI Pigment Blue 15:3 and CI Pigment Green 7) and violet dioxazine (CI pigment violet 23) [36, 54, 55].
1.4.2. MASS PIGMENTATION OF SYNTHETIC FIBERS
Generally speaking, color pigments are not used in powder form, but they are compounded with polymer for the production of monoconcentrated masterbatches, with a filler concentration ranging from 5 to 40 wt%. These concentrates are added into to the polymer through an extrusion process in the so-called "mass coloration" or “solution dyed” process [36, 41], as reported in Figure 1.15.
Background
Compared to the use of color powders, monoconcentrated masterbatches present several advantages in term of safety (i.e. avoiding of dust in the working place) and in terms of product quality (i.e. better pigments dispersion, higher color strength, reduced cleaning time) [35, 56, 57].
Mass coloration process is composed by two steps: (i) preparation of the color masterbatch and (ii) its addition to the polymer matrix [36].
The extrusion process during monoconcentrated masterbatch production promotes pigments dispersion, and involves four steps: (i) aggregates and agglomerates of pigment primary particles breakdown thanks to elevated shear stress generated (ii) improves the particles wetting from melt polymer, (iii) produces a uniform particles distribution within matrices and (iv) stabilizes the dispersion in order to prevent flocculation phenomenon [36, 58-60].
The dispersion degree of the pigments in the polymer matrix and their tendency to agglomerate depend on the physical properties of pigment particles (i.e. size, shape, surface properties, crystalline structure, chemical composition of the primary crystals) [41, 61]. The smaller particles size of color pigment the higher color strength of masterbatches [38] (Figure 1.16).
Figure 1.16: The variation of scattering (A) and the color strength (B) with the particle size [8]
Background
spinning, difficulties in obtaining the desired color and economical disadvantages due to the increase of the production times and scraps [41, 61, 62].
Moreover, pigments constituted by smaller primary particles possess an higher surface energy and thus have a higher tendency to agglomerate or to absorb other chemical species (i.e. solvents or surfactants) [33, 63]. As demonstrated from the studies of Deshmukh et all. [35] and Ahmed et all. [41], the most critical pigments to disperse in a polymer matrix are CI Pigment Blue 15:3, CI Pigment Green 7 and CI Pigment Violet 23.
The evaluation of the pigments dispersion within the matrix is a key point for the color masterbatch quality. Direct investigation techniques are microscopical analysis and X-ray fluorescence (EDX), while indirect methods such as Filter-Test, Color Strength and Rheology [41], are more representative because they are related with the production process and with the optical properties of the yarns [36].
Background
1.5. EXTRUSION PROCESS
The extrusion is one of the most important processes for plastic materials, in order to produce semi-finished and finished products for industrial or consumer applications [64]. About 60% of polymer chips in the world market are produced through an extrusion process [65].
This process is used not only to produce continuous articles, such as sheets, tubes, profiles, fibers, films but also to mix together different polymers and to introduce additives in a polymer. In fact, during the extrusion process, high shear stresses are generated and these forces allow the additive to penetrate and disperse homogeneously in the molten polymer [66].
During this process the material, in granular or powder form, is introduced into the hopper and immediately reaches the screw, driven by a motor-reducer system with safety coupling. The screw, rotating within the cylinder, pulls the material towards the extrusion head. During the process the polymer is melted by friction forces along screw and by the heat produced by heating bands controlled by thermocouples. There is also a cooling circuit to prevent both the premature softening of the pellets in the hopper, which could lead the feeder clogging, and prevent the overheating of the polymer during the process [67]. The extrusion line is composed by polymer feeder, extruder, die, cooling system and cutter [68], as reported in the Figure 1.17.
Background
The two main types of extruder are single screw and twin screw [69]. The first one is represented in Figure 1.18.
Figure 1.18: Schematic representation of single screw extruder [64]
The diameter (D) and the length (L) of the screw are the key parameters of the extruder. The first one defines the maximum flow rate, while the length/diameter ratio (L/D) defines the mixing capability of the extruder. In the cylinder usually there are heating zones, consisting of electrical resistors, to favor the homogeneous melting of the polymer, while the cooling is produced by water or air. The screw is an Archimedean screw built in alloy steel with high toughness, one side is connected with the motor and the other one usually has a conical shape (tip) to link up with the head of the extruder [70].
The screws for polyamides are generally made up of three areas: feed, compression and metering zones, as represented in Figure 1.19 :
Background
Feed zone: polymer in granules or powder form inside the hopper falls by gravity into the heated cylinder where the screw rotation begins to transport and to melt the material. In this area the screw threads height is larger, in comparison with the other sections, and constant. The granules occupy a very high volume due to high voids. Compression zone: the molten polymer is compressed and transported by the screw threads. The melting is due to two contributions: the heat exchange and friction with the walls of the extruder. In this area the height of the threads decreases and then increases the diameter of the core of the screw, resulting in an increase of the pressure and compression of the polymer. The compression in this area eliminates the cavities and gas incorporated into the molten polymer.
Metering zone: in this area pressure required to push the molten polymer through the die is generated. The height of the thread is defined as a function of the mixing and processing requirements [71]. Usually, for Polyamide 6 the metering zone is 30% of total length, in order to optimize the polymer performances [70].
Background
Figure 1.20: Schematic representation of vented screw [71]
There are screws equipped with special devices to improve the mixing of the material, particularly useful for fibers and reinforcing fillers addition, ensuring their optimal dispersion. The screws barrier are characterized by the presence of additional threads to the top of the transition zone, which allow to operate the separation of the solid and the melt.
The twin screw extruder is used essentially for materials sensitive to thermal degradation or for particular operations, such as venting and the compounding production. The twin screw extruder shows some advantages compare to single screw extruder: higher capacity, narrow range of the residence time, auto cleaning of screws and possibility to work with thermally sensible materials [72].
The screws can be rotating and co-rotating. The solution with counter-rotating screws, visible in Figure 1.21, is the most favorable for the polymer flow and it is generated by the interpenetration of the screws surfaces.
Figure 1.21: Schematic representation of counter-rotating screws [73]
Background
opposite directions while the compartments between the two threads in the same area are considerably larger.
Figure 1.22: Schematic representation of co-rotating screws [73]
Both types of extruder are manufactured in low rotation speed (some tens of revolutions per minute) and high speed version (some hundreds of revolutions per minute). The first are suitable for the profiles extrusion, while the second is widely used in the mixing operation, such as color masterbatch production.
In the interaction area between the screws the pressure increases, because of the reduction of the channel section and of the variation of flow direction. Moreover significant shear stresses are generated. The pressure increase in the interaction zone determines the greater mixing degree of the material [74].
1.6. MELT SPINNING PROCESS
The melt spinning is a process based on continuous steady state elongation of flow used to produce fiber [75]. Polyamides (PA) were the first polymer used for fiber production due to their similarity with silk fibers and nowadays they are widely used in different sector, from textiles and carpet to reinforcements of tires [2, 3].
Background
impurities, gels and large additive agglomerates that could cause fibers breakage in the next operation steps [76, 77]. After filtration, the molten polymer passes through a spinneret with a large number of holes, usually from 50 to 200, to extrude filaments [70, 78]. The cross section of these holes can be circular or with different geometry (trilobal, pentalobal, etc.) (Figure1.23), in order to achieve special effects such as luster, opacity, air permeability, insulation, reduce weight, and so on [76, 79, 80].
Figure 1.23: Scheme of spinneret orifice and the relative fiber cross section
The extruded filament are cooled in quench ducts by a cross current of air and collected in a single fiber by a so called convergence guide [70]. After conditioning a spin finish, composed by aqueous emulsion of lubricant and bactericides, is applied to fiber in order to reduce friction and abrasion between polymer and metal [70, 76, 79]. The spun yarn are therefore drawn by a so called high rotational speed godet (4000 m/min) to obtain a draw ratio from 2 to 5, depending to the fibers application, increasing the mechanical performance of material. The draw ratio (DR) is defined as the take up velocity of godet (vf) and extrusion velocity (vi) ratio,
as reported in Equation (11):
?7 @@A
B (11)
Background
resistance, this means extreme durability; high elasticity and excellent volume; great covering power; excellent thermal insulation; excellent moisture absorption and high evaporation rate; excellent tactile sensation. The last operation, before the fibers are wound on bobbins, is the entangling process obtained by a jet air that produce a physical cohesion between filament [76]. The schematic diagram of melt spinning line is reported in Figure 1.24.
Figure 1.24: Schematic diagram of spinning line [76]
In the melt spinning process the extrusion, the quenching and the drawing conditions strongly influence the structure of fibers, which is directly linked to the final properties [81]. Generally speaking the spinning process transforms semicrystalline polymers into high oriented fibers with high modulus, because of the velocity gradient along the spinning axes [82-84].
Background
Figure 1.25: Representation of filament swelling [86, 87]
After swelling, in the first zone, the macromolecules do not show orientation due to relaxation phenomenon and the filament diameter starts to decrease under natural flow [85]. In the second zone, because of the maximum high elongational flow gradient achieved, the polymer chains orientation begins and the crystallization is accelerated. After the necklike deformation, represented in Figure 1.26, high molecular orientation occurs due to high drawing and the crystallization proceeds until the freeze point [85, 87-89].
Background
Polyamide 6 can crystallize in α and γ form depending on the spinning conditions, but the more stable structure is the α form. During melt spinning process of nylon 6 the extensional flow and the plastic deformation produce a microfibrillar morphology in which crystalline and amorphous regions are alternated [90-92]. In Figure 1.27 the model of microfibrillar morphology of nylon 6 is reported.
Figure 1.27: Model of microfibrillar nylon 6 morphology [79, 90]
(1) Fibrils, (2) crystallites, (3) partially extended molecules,
Experimental
2.
E
XPERIMENTAL2.1. MATERIALS
2.1.1. POLYAMIDE 6
Polyamides (PAs), also known as Nylon, are one of the most important commercial engineering plastics [93].
PA66 was the first polyamide synthesized by W.H. Carothers at the laboratories of Du Pont in the USA and it was introduced on the market by the same company, under the trade name of Nylon® 66 in 1939. Schlach, following the work of Carothers, at the laboratories of IG Farbenindustrie, synthesized PA6 in 1939 and produced the first monofilament. It began to be produced industrially in 1940 and marketed under the trade name of Perluran® [70]. Today PA66 and PA6 represent 97÷98% of the polyamides produced and world the production volume exceeds 5 million tons per year.
From a chemical point of view, Polyamide 6 is a linear polymer constituted by amide (-CONH-) repeating units, polymerized by the ring opening polymerization (ROP) of Caprolactam (CPL) [94-96]. In Figure 2.1 the chemical formula of caprolactam and the polyamide 6 repeating unit are reported.
a) b)
Experimental
Every year, about 4.3 million tons of CPL are produced worldwide to synthesize Nylon 6. Because of their good drawability and their fibers similar to silk, polyamides were initially used in the production of socks, carpets, rugs [97, 98]. Only subsequently, because of their excellent mechanical and chemical properties, they were applied for engineering purposes, and nowadays PAs are widely used in fiber, film, packaging and molding applications [70]. In Europe, about 1.3 million tons of PA are utilized for textile yarns, industrial yarns and flooring. Polyamide fibers dominate the scenario of recycled carpet materials, and it is therefore evident the strategic interest in polyamide carpet recycling [94, 99-102].
Generally speaking, PA6 shows excellent resistance to fatigue, impact, good toughness and low friction coefficient. Moreover PA6 has good chemical resistance against many fuels, oils and it is inert to biological attack [5]. For these good properties PA6 is widely applied in many industrial sectors, such as automotive, chemical and textiles. Concerning the automotive field, it is used for the production of gear wheels, cooling fans, filters petrol, connectors of electric wires, tanks for fluid and thanks to the low friction coefficient, for bearings and supports [103]. In the chemical field polyamide is used for the production of pipes, hoses, hydraulic systems. Generally speaking, PA6 is characterized by a high degree of crystallinity, and melting temperature above 200 °C. The main limitation is the sensitivity to water, which may cause hydrolytic degradation at high temperatures and in the presence of acids and poor dimensional stability for unreinforced polyamides. The polyamides are semicrystalline polymer and the crystal surfaces are formed by lamellae, consisted of folded chains, which are linked together to form aggregates called spherulites.
Experimental
α and β phases [104, 105]. In α phase macromolecules are arranged in a zig-zag conformation, with opposite direction and form a planar structure of hydrogen bonds. The resulting crystalline structure of PA6 is monoclinic and each cell contains four repeating units, as shown in Figure 2.2.
Figure 2.2:α crystalline cell of polyamide 6. β=67.5°
The second the stable crystalline phase of polyamide 6 is the γ form [106]. This is characterized by chains with the same direction and the structure is monoclinic, as represented in Figure 2.3.
Experimental
Higher molecular weight produces a reduction of crystallization rate due to the lower mobility of the macromolecular chains.
Figure 2.3:γ crystalline cell of polyamide 6.
A=0.933nm; b=1.688nm; c=0.478nm; β=67.5°
The Polyamide 6 used in this work was supplied in chips by Aquafil S.p.A. It was prepared in a continuum process through a VK reactor. The trade name of the product is AQ24401® and it is characterized by a relative viscosity of 2.4, a density of 1.14 g/cm3 and a melting temperature of 222 °C, as reported in Table 2.1.
Properties Test method Typical value
ηrel ISO 307 2,4
Density ρ [g/cm3] ISO 1183/A 1,14
Melting Temperature [°C] ISO 11357-3 222±2
Table 2.1: Technical datasheet of AQ24401
Experimental
2.1.2. COLOR PIGMENTS
Color pigments are fine colored particles used in plastic industry to impart color to a specific substrate. In Aquafil S.p.A. Polyamide 6 and color pigments are mixed together by an extrusion process in order to obtain the monoconcentrated masterbatches, containing only one type of pigment. Different monoconcentrated masterbatches are mixed through another extrusion process for the production of color masterbatch, with the specific color, hue and saturation to satisfy the costumer request. In this work the most important color pigments, used in the automotive industry to produce carpets for car, were analyzed.
The color pigments can be divided in two main groups: inorganic and organic pigments. Organic pigments are mainly used for applications needing high tinting strength and brilliant shades while inorganic pigments are mainly useful where high opacity is needed. Table 2.2 shows the inorganic pigments considered in this research.
Pigment
(CI) Color Trade name Supplier Molecule CAS number
PW6 White Hombitan LO-CR-S-M W/O SI
Sachtleben Chemie
GmbH TiO2 13463-67-7
PBk7 Black Black Pearls
4560 Cabot Corporation Carbon black
PBr24 Yellow Sicotan Yellow
K 2001 FG BASF
Chrome antimony
titanium buff rutile 68186-90-3
PR101 Brown Bayferrox 110M Bayer Chemicals Iron oxide α₋Fe2O3 1309-37-1
Table 2.2: Inorganic color pigments
In Table 2.3 the inorganic pigments analyzed in this work are reported.
Pigment
(CI) Color Trade name Supplier Molecule CAS number
PB15:3 Blue Heliogen Blue
K 7090 BASF
Cu-phthalocyanine
beta 147-14-8
PG7 Green Heliogen Green
K 8730 BASF
Cu-phthalocyanine
halogenated 1328-53-6
PR149 Red Paliogen Red
K 3580 BASF Perylene 4948-15-6
PV23 Violet CROMOPHTAL
Violet GT BASF Dioxazine 6358-30-1
Experimental
2.1.2.1. White Pigment (PW6)
The most important white pigment used in plastic industry is titanium dioxide (TiO2)
in its anatase crystal form. The general properties of this pigment, reported in the datasheet, are shown in the Table 2.4.
Pigment
(CI) Color
Chemical formula MW
Density [g/cm3]
Particle size
(Photocentrifuge)
[nm]
SSA [m2/g] PW6 White TiO2 79,90 3,8 300 12-17
Table 2.4: Technical datasheet of PW6
For its high refractive index, PW6 is primarily used as a white pigment in paint and plastic industry to make dull the appearance of color products. The primary particles have very small dimensions and it is easy to disperse in polymeric matrices because of its low flocculation tendency.
PW6 shows high color clarity, high chemical resistance to organic solvents and high thermal stability. Titanium dioxide shows high photoreactivity because it absorbs the ultraviolet radiation that can degrades the polymer matrix and the organic pigments. The UV radiation is converted into heat and can create radical sites on the pigment surface that can lead to the breakdown and degradation of the macromolecules [56]. For this reason, the TiO2 used as pigment in plastic matrix undergoes to surface
treatment. The PW6 used in this work, Hombitan LO-CR-S-M W/O SI, was covered by a first inorganic coating and a second organic coating in order to reduce its photoreactivity, as represented in Figure 2.4. Despite of its good feature, TiO2 is
relatively cheap [56, 107-109].
Experimental
2.1.2.2. Black Pigment (PBk7)
Carbon black is widely used in many industrial sectors for many purposes such as rubber reinforcement, plastic pigmentation, paints and coatings [110]. It is an amorphous form of carbon obtained by an oxidative decomposition of hydrocarbons under controlled conditions [108, 111]. The carbon atoms are arranged in blocks of graphene layers with reduced dimensions and these units are organized in a turbostratic structure to form spherical particles with a range of diameter from 10 to 100 nm [111]. Table 2.5 shows the technical datasheet of PBk7.
Pigment
(CI) Color
Chemical formula
Density [g/cm3]
SSA [m2/g] PBk7 Black C (Carbon) ~ 2 80-110
Table 2.5: Technical datasheet of PBk7
The primary particles of PBk7 are very small with a corresponding high specific surface area and surface energy. For this reason, in order to minimize the free energy of the system, the primary particles tends to flocculate and to form aggregates. The color strength of carbon black is high and is proportional to its specific absorbance, that depends on the refractive index and the size of the independent structural units [112, 113].
2.1.2.3. Brown Pigment (PBr24)
Experimental
Pigment
(CI) Color
Chemical formula
Density [g/cm3]
Particle size
(Disc Centrifuge)
[nm]
SSA [m2/g] PBr24 Yellow (Ti,Cr,Sb)O2 4.5 688 4
Table 2.6: Technical datasheet of PBr24
This pigment is used for coloring plastics, ceramics, building materials and coatings. The estimated world production amounts to 10,000 – 15,000 tons. It is practically inert and has a melting point above 1000°C. The primary particles are larger compare to the organic pigment and thus they are easy to be dispersed into a polymeric matrix because they do not tend to flocculate. It shows low color strength.
2.1.2.4. Red Pigment (PR101)
Pigment Red 101 is iron oxide (Fe2O3) and shows a brown color. It can be natural,
called hematite, or synthetic produced from calcination of iron hydroxide with hydration water elimination. Depending on calcination degree its crystals can have different shapes. The properties of PR101 are reported in Table 2.7.
Pigment
(CI) Color
Chemical formula
Density [g/cm3]
Particle sizea
[nm]
PR101 Brown Fe2O3 5 90
Table 2.7: Technical datasheet of PR101
a: measured by Electron microscope
PR101 particles are really small and they show low tendency to flocculate. This pigment can be dispersed easily in a polymer medium. The color depends by the particles dimensions: the bigger the particles, the brighter the color.
Experimental
2.1.2.5. Blue Pigment (PB15:3)
Copper Phthalocyanines (CuPc) are the most important and the most widely used blue pigments in the market [35]. They are primarily applied to color inks, paints and plastic and they are also used to synthetic fibers and paper coatings [62, 114-116]. Copper Phthalocyanine shows two crystal structure available on the market. The alpha form is the CI PB15:1 and the beta form is the CI PB15:3. The beta crystal is more stable and it was taken into account in this work [117]. The properties of PB15:3 are reported in Table 2.8.
Pigment
(CI) Color
Chemical formula
Density [g/cm3]
Particle size
(Disc Centrifuge)
[nm]
SSA [m2/g] PB15:3 blue C32H16CuN8 1,6 220,8 65
Table 2.8: Technical datasheet of PB15:3
Copper Phthalocyanine pigments are manufactured from phthalic anhydride, urea, cupric chloride and ammonium molybdate or from ammonoxidation of oxylene and a cupric salt. The chemical structure of this pigment is shown in the Figure 2.5.
Figure 2.5: Chemical structure of PB15:3
Experimental
of this CuPc shows a significant tendency to flocculate. In plastic coloring the effectiveness of PB15:3 strongly depends on the level and on the stability of the dispersion. Copper Phthalocyanine pigments show high color strength, high solvent resistant and heat stability compared to the other blue dyes.
2.1.2.6. Green Pigment (PG7)
The PG7 is a Copper Phthalocyanine molecule polychlorinated by 14-16 atoms of chlorine. CuPc green dominates the market of green pigment and, like PB15:3, it is primarily applied to color inks, paints and plastic and they are also used to synthetic fibers and paper coatings [62, 114-116]. The properties of PG7 are summarized in Table 2.9.
Pigment
(CI) Color
Chemical formula
Density [g/cm3]
Particle size
(Disc Centrifuge)
[nm]
SSA [m2/g]
PG7 green C32H3N8Cl15Cu 2,1 201 61
Table 2.9: Technical datasheet of PG7
PG7 pigment is produced from copper Phthalocyanine by a multiple substitution of hydrogen atoms of the benzo rings by chlorines [119, 120], and the resulting chemical structure is shown in Figure 2.6.
Experimental
Phthalocyanine green pigments are composed by a very tiny molecular crystal primary particles that are difficult to disperse into the polymeric matrix. For this reason, they have a tendency to flocculate. PG7 pigments are characterized by high tinctorial strength, good solvent resistance, high chemical and heat stability.
2.1.2.7. Violet Pigment (PV23)
The dioxazine violet is the most used violet pigment in paint industry and coloration of plastic [54]. The pigment is usually used at low concentration because of its high tinting strength to impart bluer hue to the undertone of the white. The properties are reported in Table 2.10.
Pigment
(CI) Color
Chemical formula
Density [g/cm3]
SSA [m2/g]
PV23 violet C34P22Cl2N4O2 1,46 57,8
Table 2.10: Technical datasheet of PV23
The dioxazine violet is obtained by the reaction of chloranil with aminoethyl carbazole [33, 35]. The Figure 2.7 shows the chemical structure of this pigment.
Figure 2.7: Chemical structure of PV23
Experimental
shows a good resistance to solvent and light, and an excellence thermal stability [107, 121].
2.1.2.8. Red Pigment (PR149)
PR149 is a perylene diimide pigment primarily used in the coloration of plastics [54]. The limitation is that this pigment affects the shrinkage of injection molded articles and high concentration must be avoided because it can interact with hindered amine light stabilizers (HALS), reducing the thermal and UV stability of the product. In the Table 2.11 the main properties of PR149 are summarized.
Pigment
(CI) Color
Chemical formula
Density [g/cm
3
]
Particle sizea
(Disc Centrifuge)
[nm]
SSA [m2/g] PR149 red C40H26N2O4 1,4 125 76
Table 2.11: Technical datasheet of PR149
The chemical structure of PR149 is reported in Figure 2.8.
Figure 2.8: Chemical structure of PR149 [122]
As for the other organic pigments, the properties of perylene pigments are strongly dependent on particles size and their dispersion in the medium, crystal morphology and surface properties of particles [122]. The morphology of the PR149 primary particles is acicular and shows a small dimensions.
Experimental
2.2. MATERIALS PROCESSING
In this work the effects of color pigments addition into the industrial products were analyzed at three different levels: (i) the production of monoconcentrated masterbatch, (ii) the production of color masterbatch and finally (iii) on the fibers produced by solution dyed process.
2.2.1. MONOCONCENTRATED MASTERBATCH
Monoconcentrated masterbatches are composite materials, also called concentrates, obtained by a melt compounding process, with a high amount of additives (5-50% wt.), higher than in the final products [123, 124]. Polymer matrix and one type of color pigment are mixed by an extrusion process, in order to obtain a fine dispersion of particles into the polymer [35]. Monoconcentrated masterbatches are marketed in chips form and they are used in later production step for coloring plastic materials and, as mentioned before, their use is recommended in comparison to the use of powder pigment or soluble dyes [125].
For masterbatch production a co-rotating twin screw machines are commonly used in the industry because they have modular configurations and are thus quite flexible for adapting to changing tasks and material properties [126].
Experimental
Figure 2.9: Distributive and dispersive mixing representation
The eight monoconcentrated masterbatches, obtained starting from the eight color pigments taken into account, were produced in Aquafil S.p.A. through its industrial process. The schematic layout of the monoconcentrated masterbatch process is represented in Figure 2.10.
Figure 2.10: Schematic representation of monoconcentrated masterbatch process
Experimental
feeding as much uniform as possible. Through a volumetric dosing unit the compound is fed into extruder in which the real mixing occur. At the end of extrusion, the polymer mixed with the pigments is forced to pass through a spinneret and the filaments produced are cooled down by water and by air before going into pelletizer, that produces the chips of monoconcentrated color masterbatch (~3 mm). The Figure 2.11 shows a picture of a yellow monoconcentrated masterbatch.
Figure 2.11: Yellow monoconcentrated masterbatch
In Table 2.12 the monoconcentrated masterbatches studied in this work with their pigment concentration are reported.
Monoconcentrated
Masterbatch Notation
Pigment Concentration
[%] Monoconcentrated white masterbatch PW6 Mono PW6 20 Monoconcentrated black masterbatch PBk7 Mono PBk7 30 Monoconcentrated brown masterbatch PBr24 Mono PBr24 40 Monoconcentrated red masterbatch PR101 Mono PR101 50 Monoconcentrated blue masterbatch PB15:3 Mono PB15:3 25 Monoconcentrated green masterbatch PG7 Mono PG7 25 Monoconcentrated violet masterbatch PV23 Mono PV23 25 Monoconcentrated red masterbatch PR149 Mono PR149 25
Experimental
The industrial extruder used in this work was a TM-M58 model produced by F.lli Maris S.p.A. and its technical characteristics are shown in Table 2.13.
Parameter Value
Nominal diameter 58 mm
Number of lobes screw 2
Max screw speed 602 rpm
Max screw torque 860 Nm
L/D ratio 44
Throughput 300 Kg/h
Number of thermal zones 12
Engine power 110 kW
Table 2.13: Technical specification of TM-M58 extruder
Each monoconcentrated masterbatch was extruded using different process parameters because of the different physical-chemical nature of the color pigments. These parameters allow to obtain a continuous production process, with the production of filaments with constant cross section, avoiding also pressure fluctuations and filament breakage.
In Table 2.14 the extrusion parameters used for each monoconcentrated masterbatch are reported.
Screw rotation speed [rpm]
Throughput rate [Kg/h]
Energy consumption [%]
Mono PW6 450 290 80%
Mono PBk7 400 240 80%
Mono PBr24 400 240 80%
Mono PR101 400 240 80%
Mono PB15:3 350 210 75%
Mono PG7 350 210 75%
Mono PV23 350 210 75%
Mono PR149 400 240 80%
![Figure 1.3: Schematic representation of light-matter interaction [8]](https://thumb-us.123doks.com/thumbv2/123dok_us/540075.2053508/30.421.122.299.385.449/figure-schematic-representation-of-light-matter-interaction.webp)

![Figure 1.8: (a) Tristimulus color space XYZ and (b) (x,y) chromaticity diagram [24]](https://thumb-us.123doks.com/thumbv2/123dok_us/540075.2053508/33.421.125.289.106.243/figure-tristimulus-color-space-xyz-b-chromaticity-diagram.webp)

![Figure 1.14: Primary particles and aggregates with different geometry [41]](https://thumb-us.123doks.com/thumbv2/123dok_us/540075.2053508/39.421.137.285.125.270/figure-primary-particles-aggregates-different-geometry.webp)
![Figure 1.15: Schematic diagram of mass pigmenting in melt spinning process. (a) Injection method and (b) metering of concentrate chips before melting [36]](https://thumb-us.123doks.com/thumbv2/123dok_us/540075.2053508/40.421.127.294.344.514/figure-schematic-diagram-pigmenting-spinning-injection-metering-concentrate.webp)
![Figure 1.20: Schematic representation of vented screw [71]](https://thumb-us.123doks.com/thumbv2/123dok_us/540075.2053508/46.421.114.305.399.477/figure-schematic-representation-vented-screw.webp)