O R I G I N A L A R T I C L E
Open Access
Feasibility of simultaneous PET-MR
perfusion using a novel cardiac perfusion
phantom
Jim O
’
Doherty
1*, Eva Sammut
2,3, Paul Schleyer
4, James Stirling
1, Muhummad Sohaib Nazir
2,5, Paul K. Marsden
1and Amedeo Chiribiri
2,5* Correspondence: [email protected]
1Division of Imaging Sciences and
Biomedical Engineering, PET Imaging Centre, King’s College London, St. Thomas’Hospital, 1st Floor Lambeth Wing, St Thomas’ Hospital, London SE1 7EH, UK Full list of author information is available at the end of the article
Abstract
Background:PET-MR scanners are beginning to be employed for quantitative myocardial perfusion imaging. In order to examine simultaneous perfusion calculations, this work describes a feasibility study of simultaneous PET-MR of gadolinium-based contrast agent (GBCA) and PET radiotracer in a novel cardiac perfusion phantom.
Results:[18F]F−and GBCA were injected simultaneously into a cardiac phantom using a range of ground-truth myocardial perfusion rates of 1 to 5 ml/g/min. PET quantification ofK1(ml/g/min) was performed using a single tissue compartment model. MR perfusion was calculated using a model-independent signal
deconvolution technique. PET and MR signal traces from the phantom aorta and myocardial sections show true simultaneous PET and MR arterial input functions (AIF) and myocardial uptake respectively at each perfusion rate. Calculation of perfusion parameters showed bothK1andh(t = 0)(PET and MR perfusion parameters
respectively) to be linearly related with the ground truth perfusion rate (PT), and also linearly related to each other (R2= 0.99). The highest difference in perfusion values betweenK1andPTwas 16% at 1 ml/g/min, and the mean difference for all other perfusion rates was <3%.
Conclusions:The perfusion phantom allows accurate and reproducible simulation of the myocardial kinetics for simultaneous PET-MR imaging, and may find use in protocol design and development of PET-MR based quantification techniques and direct comparison of quantification of the two modalities.
Keywords:PET-MR, Cardiology, Perfusion, Flow
Background
Cardiac magnetic resonance (CMR) plays an increasing role in the diagnosis and strati-fication of patients with suspected coronary artery disease (CAD) justified by its high spatial resolution, tissue contrast and the ability to provide reproducible quantitative data on parameters such as left ventricular volumes and mass. CMR is also increas-ingly used to assess inducible ischaemia (Fihn et al., 2012; Task Force et al., 2013). In carefully controlled situations, CMR techniques have been shown to also provide absolute quantitative measurements of myocardial blood flow (MBF) and myocardial flow reserve (MFR) (Jerosch-Herold, 2010).
Positron emission tomography-computed tomography (PET) imaging is a highly accurate method for assessment of obstructive coronary artery disease (CAD), with a sensitivity and specificity of approximately 90% (Di Carli et al., 2007) and is consid-ered the reference method for non-invasive quantification of myocardial perfusion (Bengel et al., 2009). Dynamic PET imaging can be performed using short-lived me-tabolized tracers (e.g. [82Rb]Cl, [13N]NH3) or freely-diffusible tracers (e.g. 15O–H2O) for quantification of absolute MBF and MFR.
The recent introduction of simultaneous hybrid PET-MR systems for combined mo-lecular and functional imaging could be of great use in terms of understanding under-lying cardiac pathophysiology and improving cross-modality validation. Multiple images comprising structural and functional information of the same tissue in the same physiological state can be acquired simultaneously. The combination of PET and MR acquisitions can provide further benefits in cardiac imaging such as real-time motion correction (Petibon et al., 2013), reduced patient scan time compared to independent CMR and PET-CT scans (Ratib & Nkoulou, 2014), and a reduction in exposure to ionizing radiation (Ratib et al., 2013).
Due to the demanding technical requirements of first-pass perfusion imaging, the use of simultaneous PET-MR systems for quantitative cardiac imaging is only just emerging. Sequential CMR and PET perfusion measurements in a on the same day have shown that physiological variations in the time between studies (i.e. hemodynamic conditions) are a major factor (Morton et al., 2012). Recent work has performed simultaneous PET-MR in [18F]FDG cases to examine cardiac viability (Nensa & Schlosser, 2014), cardiac sarcoma (Nensa et al., 2015) and active inflammation imaging of cardiac sarcoidosis (Schneider et al., 2014). MFR determined from [15O]H20 PET from both PET-MR and PET-CT systems has been compared from 10 patients, detailing a high intra-class correlation coef-ficient of 0.98 (Kero et al., 2017). Another group studied the feasibility of acquiring MR and PET perfusion profiles simultaneously using dynamic contrast enhancement MR (DCE-MR) and [13N]NH3PET for 10 patients, showing a correlation of R2= 0.67 for rest and stress MBF and R2= 0.48 for MFR (Zhang et al., 2013). A major confounding factor in the correlation between PET and MR perfusion comparison involves the difference in the tracer mechanism. Gadolinium based contrast agents (GBCA) do not undergo any intracellular processes, remaining distributed only within the extracellular space, whereas PET radiotracers typically enter and exit the myocyte. Thus there is also a lack of similarities between approaches to quantify perfusion on CMR and PET tech-niques such as modeling assumptions, fitting methods and parameter constraints (Gerber, 2012). Also of note in simultaneous imaging is the potential effects of contrast agent on the MR-based map for attenuation correction of PET sinograms (Rischpler et al., 2013; Rischpler et al., 2015).
aimed to investigate if perfusion estimates calculated independently via PET and MR techniques are related.
Material and Methods
Phantom
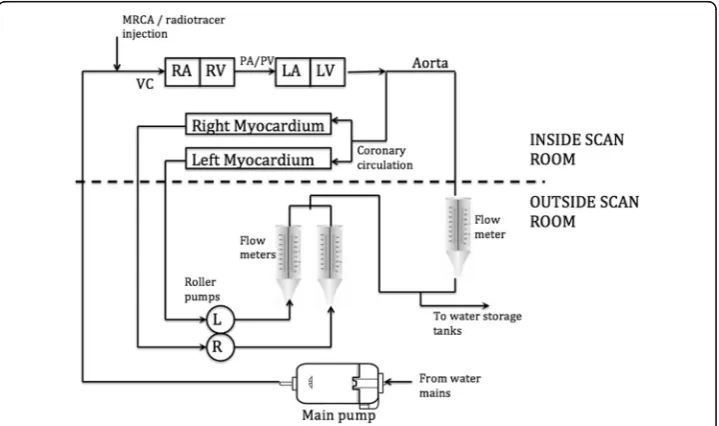
We used an in-house designed and built myocardial perfusion phantom, which has previously been described in detail (Chiribiri et al., 2013). Briefly, water is pumped through an MR-safe myocardial perfusion phantom placed in the scanner. The phantom is representative of the large thoracic vessels and of the heart of a 60 kg subject. It is composed of four cardiac chambers (120 ml each) and associated thoracic vessels (aorta, pulmonary artery, pulmonary vein, vena cava). A schematic representation detailing the phantom itself and supporting precision pumping and monitoring mechanisms is shown in Fig. 1. Myocardial perfusion is controlled in real time by flow meters continuously sampling the flow rate by means of high-precision digital flow meters (Atrato, Titan, Sherborne, United Kingdom) and pro-viding re-adjustment of the speed of rotation of roller pumps through a feedback mechanism. Perfusion values were obtained by means of measurements of the distribution volume for the radioactive tracer and for the GBCA, and dividing the flow rate by this value. All pump controls and flow/perfusion rates are handled remotely from a custom-written LabVIEW application (LabVIEW Professional Development System 2014, National Instruments, Austin TX, USA) running on dedicated workstation and remotely controlled using an iPad application (Dashboard for LabVIEW, National Instruments, Austin TX, USA). As no radiotracer or GBCA re-entered the system after injection, we utilized a non-recirculating model in order to study first-pass myocardial perfusion measurements.
Scanning parameters
We performed PET-MR imaging on a 3 T Siemens Biograph mMR scanner (Siemens Healthcare GmbH, Erlangen, Germany). The MR sequence consisted of a clinically utilized imaging protocol, namely a 2D TurboFLASH saturation recovery gradient echo sequence (TE = 1 ms, TR = 164 ms, Flip angle = 10o, slice thickness = 6 mm, pixel spa-cing = 1.875 mm, matrix size 144 × 192 voxels, with temporal resolution of 1 image per cardiac beat). MR data were acquired in a single transverse plane identified by markings on the phantom, the locations of which correspond to a known dispersion volume for the GBCA and radiotracer. Cardiac output flow rate was set to 3 l/min, with true myocardial perfusion rates (hereon denotedPT) set to 1, 2, 3, 4 and 5 ml/g/min. A
previously validated dual-bolus protocol was used for GBCA injection, with a pre-bolus of 0.001 mmol/kg of GBCA injected before a main bolus of 0.01 mmol/kg (Ishida et al., 2011). A minimum pause of 30 s was allowed between the pre-bolus and the main bolus of GBCA to ensure return of signal in the vascular and myocardial compartments to baseline values.
3D PET data were acquired in a single list-mode file and re-binned into short frames during the peak influx and washout phases (60 × 3 s) and longer frames towards the end of the washout phase (12 × 15 s). PET image frames were reconstructed using the standard manufacturer-issued filtered back-projection (FBP) algorithm available on the scanner (344 × 344 matrix, Gaussian smoothing filter of 4 mm. Resulting PET voxel sizes were 2.086 mm × 2.086 mm × 2.031 mm. Attenuation correction of PET data was provided by the standard dual-point VIBE T1-weighted Dixon sequence available on the mMR scanner front end (Martinez-Moller et al., 2009). Total attenuation of the phantom is low as there is no attenuating material surrounding the phantom.
A mean injected activity of 207.8 ± 9 MBq was injected in order to exclude potential confounding dead-time effects in the PET detectors which has been shown to occur in clinical situations (O'Doherty et al., 2014; Renaud et al., 2016). After preloading of [18F]F− into the tubing, the main bolus of GBCA (Gadovist®, Bayer HealthCare, Berlin, Germany) and [18F]F− were injected simultaneously via a contrast injection system (Spectris Solaris, Bayer AG, Leverkusen, Germany) through the vena cava tubing of the phantom (Fig. 1). Simultaneous dynamic PET-MR imaging was performed for a total of 300 s. A single simultaneous PET-MR acquisition was performed at each PTstep, and
each step was repeated for an estimate of repeatability of the phantom. After each scan, water was pumped through the myocardial compartments of the phantom for a minimum of 60 s between experiments to ensure a complete washout of GBCA and radiotracer before the next scan.
Image analysis
image plane corresponding to the MR image plane was determined from fusion of the dynamic 3D PET and 2D summed dynamic MR images using PMOD. ROIs were placed on PET images over the same spatial extent as the MR ROIs. The PET volumes of interest (VOIs) were 6.093 mm thick (3 PET slices) in the axial-dimension in order to match the slice thickness of the MR data (6 mm). All PET data were decay-corrected to the scan start time. We thus produced a set of TACs and TICs for the aorta and myocardial compartments over the range ofPT.
MR perfusion calculation
In-house software was used for perfusion quantification (Labview 2014 for Mac, National Instruments, Austin, USA). A model-independent deconvolution approach was used to calculate the tissue impulse response function, providing results in units of 1/s (Patel et al., 2010) and was not scaled to be in units of ml/g/min. Briefly, relative perfusion can be calculated based on the central volume principle using a signal deconvolution method (Jerosch-Herold et al., 1998). The TIC for the myocardial uptake function, M(t), can be calculated from the TIC for the arterial input function, Cin(t), convolved with the tissue impulse response function h(t):
M tð Þ ¼
Z t
0 Cin t
‐τ
ð Þ⋅h tð Þdt¼
Z t
0 Cin τ
ð Þ‐Coutð Þτ
½ dτ ð1Þ
in which Cout(t) denotes the contrast concentrations in the venous out-perfusion. We
performed this calculation using the pre-bolus curve, Cin(t), as an input function, in
order to minimize the effect of signal saturation by the main bolus of higher GBCA concentration, an effect which has been noted in previous work in patients and with this phantom at high GBCA dosages (Chiribiri et al., 2013; Ishida et al.,2011). In the range of physiological concentration used in the pre-bolus injection, MR signal inten-sity is proportional to GBCA concentration. The tissue impulse response function h(t) has the shape of an exponential decay, and MR relative perfusion measurements were calculated from the h(t)) whenh(t = 0), i.e. at the peak value of the exponential decay. The delay between the arterial input TIC and the myocardial TIC was accounted for in the model (Zarinabad et al.,2013).
PET perfusion calculation
PET data was modeled using a one-tissue compartment model characterized by a one blood compartment, one tissue compartment and two rate constants K1 (uptake rate
constant in units of ml/g/min) and k2(clearance rate from tissue to blood constant in
units of min−1). For this phantom study, using [18F]F−we assume an extraction fraction of 1.0 due to the lack of any metabolic processes, and thus theK1constant is entirely
representative of perfusion. In order to eliminate any prospective bias, PET and MR data were analyzed independently by two different authors blinded to the true myocardial perfusion rates,PT(PET analysis by JOD, MR analysis by AC).
The terms‘flow’and‘perfusion’have been used interchangeably in both PET and MR literature. Owing to the fact that rates of liquid through our phantom were calibrated in terms of ml/g/min (i.e. units of perfusion) andK1values from PET kinetic modeling
were in the same units, we opt to keep consistency with terminology and use the term
Results
Simultaneous imaging
As the PET acquisition is fully 3D (25.8 cm field of view), all myocardial chambers can be visualized simultaneously. Figure 2 illustrates the rapid passage of radiotracer from the right atrium to ventricle, through the pulmonary circulation and into the left atrium and ventricle and exiting through the aorta. Figure 3 displays a fused transaxial image of the single MR slice with the corresponding merged 3 PET slices covering the same axial extent. The expected GBCA and PET radiotracer distribution through the phan-tom can be seen at increasing time points of the 2D MR imaging sequence and fused PET-MR images detailing the first pass dynamics of the phantom. The inset image of Fig. 3 shows the passage of MR contrast only, which temporally matches the distribution of PET radiotracer.
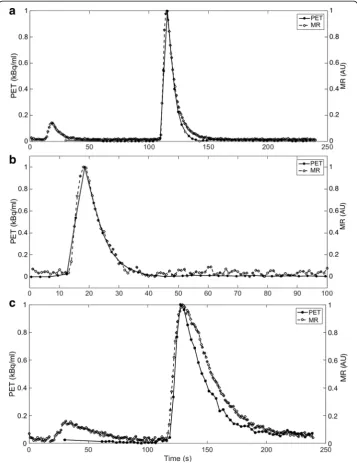
Image processing of the ROI/VOIs to produce TACs and TICs allows comparison of resulting mean PET kBq/ml to MR signal intensity during transit of the GBCA and radio-tracer, as shown in Fig. 4. As the repeat injection of [18F]F− and GBCA was performed using the same timings and methodology as the first test, the time traces produced by both PET and MR data were similar. Although not shown in Fig. 4 for clarity, for a single
PTof 4 ml/g/min, one standard deviation of the mean PET activity concentration from
the VOI varied over time from ±2 to ±24%, while that of the MR mean ROI signal inten-sity varied over time from ±13% to ±29%. Standard deviations were similar for other values of PT. Figure 5 shows a comparison of the input functions from both imaging
methodologies normalised by their respective maximum signal intensities, firstly between the main MR bolus peak of GBCA and the radiotracer (A), secondly between the MR pre-bolus peak (which was used for the MR perfusion analysis) and a time-shifted PET TAC overlaid to provide comparison (B), and finally a normalized comparison of the functions obtained from the myocardial chamber (C). From these traces, it can be observed that the input functions for both PET and MR models show similar characteristics.
Perfusion calculations
PET datasets were used to calculate perfusion (ml/g/min) via K1, and MR datasets to
calculate relative perfusion values via h(t = 0) as described above. Resulting K1 and
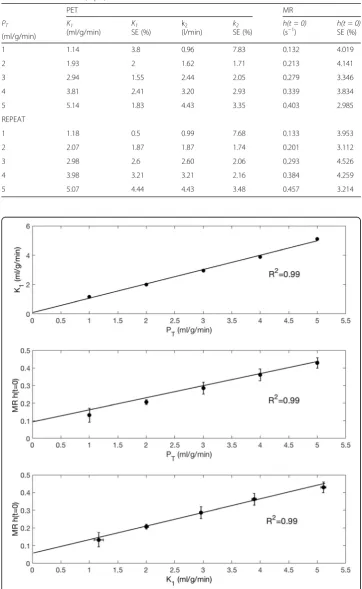
h(t = 0) and are shown in Table 1. Figure 6 shows three plots detailing the relationship
betweenK1and PT,h(t = 0)andPTand also h(t = 0)and K1. The results show thatK1
is linearly related toPT(R2= 0.99), and thath(t = 0)is also linearly related to bothPT
andK1(R2values of 0.99 in both cases).
Discussion
We performed PET-MR tests using a specialized cardiac phantom allowing assessment of myocardial perfusion measurements with both imaging methodologies from simultaneously acquired data. Both PET and MR are accurate tools for the assessment of myocardial
Fig. 3Example fused PET-MR images showing dynamics of GBCA and radiotracer transfer through the phantom.a–bolus in the VC (t= 0 s).b–outperfusion from the RV through the PA (t= 3 s),c–coronary circulation to the PV (t= 5 s) and the aorta (AO). Inset images show the time distribution of GBCA only
ischaemia, however there are drawbacks to each technique. For example in MR, derivation of fully quantitative perfusion units remain a complex process due to the relationship between signal intensity and gadolinium contrast and dependence on acquisition sequence (Jerosch-Herold, 2010), Also 2D imaging is favoured due to dynamic imaging meaning that perfusion calculations cannot be representative of the entire volume. In PET, the cost of the perfusion exam can be prohibitive and the procedure is based on access to short-lived radio-tracers thus requiring access to a cyclotron. There is also a not insignificant radiation dose
Table 1Results of employing a one compartment kinetic model to the PET and deconvolution model to the MR data (Eq. 1)
PET MR
PT K1
(ml/g/min)
K1 SE (%)
k2 (l/min)
k2 SE (%)
h(t = 0)
(s−1)
h(t = 0)
SE (%) (ml/g/min)
1 1.14 3.8 0.96 7.83 0.132 4.019
2 1.93 2 1.62 1.71 0.213 4.141
3 2.94 1.55 2.44 2.05 0.279 3.346
4 3.81 2.41 3.20 2.93 0.339 3.834
5 5.14 1.83 4.43 3.35 0.403 2.985
REPEAT
1 1.18 0.5 0.99 7.68 0.133 3.953
2 2.07 1.87 1.87 1.74 0.201 3.112
3 2.98 2.6 2.60 2.06 0.293 4.526
4 3.98 3.21 3.21 2.16 0.384 4.259
5 5.07 4.44 4.43 3.48 0.457 3.214
Fig. 6Top - ResultingK1values from a single compartment model for PET data plotted againstPT. Middle– MR values ofh(t = 0)from model-independent deconvolution for MR images plotted against the range of
associated with the radiotracer. Recent work has investigated the complimentary in-formation generated by simultaneous late gadolinium enhancement and 18F–FDG imaging (Rischpler et al., 2015). Although the principles of image formation between MR and PET are based entirely on different physical principles, we have shown that similar TACs and TICs from the arterial and myocardial compartments can be ob-tained from a single short acquisition. Furthermore, it has been possible to show that the results obtained with the employed MR and PET models are linearly related to the true myocardial perfusion rate,PT.
The phantom is physiologically relevant and as such is able to explore some relevant aspects of perfusion dynamics of the human heart. Figures 2 and 3 demonstrate the dis-tribution of both GBCA and radiotracer through the right side of the cardiac chambers followed by the left, with perfusion through the myocardial compartments following shortly after. Simultaneous traces of PET activity concentration and MR signal intensity in Fig. 4 demonstrate the transit of radiotracer and GBCA through the phantom, show-ing that true simultaneity of PET and MR signals can be achieved in this phantom. Our data also indicate that when a dual bolus approach is used in MR, linear perfusion estimates to those obtained in PET can be achieved.
In this study, we adopted a dual-bolus injection scheme previously described and val-idated by our group (Ishida et al., 2011; Schuster et al., 2013). The results of this study demonstrate that this approach results in MR input functions which are very similar in shape and transit time to the reference standard PET input functions (Fig. 5). The myo-cardial compartment TAC and TIC closely match in terms of wash-in, however the MR TIC can be observed to have a longer transit time than the radiotracer (Fig. 5, part C). We propose that this may be due to the higher particle mass and viscosity of the GBCA than the radiotracer.
One of the main benefits of the phantom model is its reproducibility. Figure 4 demonstrates that repeat acquisitions at the same PTgive similar TAC and TIC. Upon
calculation of perfusion via PET (Table 1),K1values when performed with independent
repeat acquisitions produce values in the range of 1.2% to 7.5% of each other. A similar repeatability is shown in MR data with a repeatability of 0.6%–13% for h(t = 0). PET measurements at PT = 1 ml/g/min showed an overestimation of PT by 16%, however
thePTrates of 2, 3, 4 and 5 ml/g/min were accurate toK1values to within a maximum
of 2.65%, indicating good precision for repeated measurements and also a good accur-acy toPTvalues above 1 ml/g/min. Inaccuracies in the true measurement ofPT= 1 ml/
g/min due to physical accuracy of the roller pumps may account for the larger differ-ences at this value ofPT, and will be investigated in the next generation of the phantom
currently under development. Although h(t = 0) values represent relative perfusion measurement and were not scaled to represent absolute perfusion units, their relation-ship to PTandK1can be clearly observed in Fig. 6, whereby a linear relationship was
found betweenh(t = 0)and K1, as well ash(t = 0)and PT. Another potential advantage
of the approach is the possibility to address differences in the way images are acquired and modality-specific artifacts, such as saturation effects in MR or attenu-ation correction in PET.
Furthermore, PET images were rebinned into short frames of 3 s because of the rapid transit of the radiotracer in water. In clinical image we expect a lower amount of data and frames to analyse.
Attenuation correction is a major issue in clinical PET-MR imaging and the focus of much research (Mehranian & Zaidi, 2015). In this work, we utilised GBCA for the bolus injection, and in clinical studies the concentration used would be far higher. Previous work by our group has shown that despite large concentrations of GBCA up to 65 mM (presenting the scenario of GBCA bolus in the left ventricle simultaneously with the PET radiotracer), the effect of attenuation of gamma photons by GBCA on quantified activity concentration (kBq/ml) in the final reconstructed images is less than 5% when compared to no GBCA present (O'Doherty & Schleyer, 2017).
We believe that by providing a standardized setup and known perfusion rates, results, claims and hypotheses from clinical studies can be further investigated. For example, in a recent study by our group, MFR of 41 patients calculated from independent CMR and PET scans have been shown to correlate well, however absolute CMR perfusion at stress and rest correlated weakly and were positively biased compared to their PET counterparts (Morton et al., 2012). This may indicate that errors in quantification have a similar effect on stress and rest perfusion MBF values but are cancelled by calculation of the MFR. Future experiments could verify this finding by the exclusion of physio-logical variation. The phantom also allows comparison of kinetic models given the known ground truth of perfusion rates, and the potential for development of new hybrid kinetic models employing both PET and MR data.
Knowledge of the relationship betweenPT, K1andh(t = 0)may allow the creation of
a modality-specific calibration curves. Particularly in the case of perfusion MR, this could allow converting the results of the deconvolution operation from seconds−1 to ml/g/min of perfusion. This approach could prove of value as a substitute for current approaches based on constraining the deconvolution operation (Zarinabad et al., 2013; Hautvast et al., 2012). This may lead to an improvement in the correlation between absolute MBF values measured with MR and PET, which was shown to be suboptimal in comparison with MPR values in previous studies (Morton et al., 2012).
Limitations
and perfusion as calculated from a single compartment PET model. As is the mechanism with PET radiotracers, no separate tissue compartment exists, for example one with well-defined mechanical properties such as a membrane. Therefore true intracellular uptake cannot be simulated, only allowing non-circulating extravascular transfer of tracer. Strat-egies would be required in order to simulate the kinetics of perfusion tracers that undergo metabolic processes such as [13N]NH3or [18F]flurpiridaz. Efforts should be made to create myocardial compartments within the phantom, which would allow a more accurate approach to kinetic modeling. Furthermore, we performed only 1 repeat acquisition of eachPTin this feasibility study, further repeat measurements would allow the calculation
of a repeatability coefficient for both the PET and MR datasets.
The current phantom model setup is unable to reproduce the multiple sources of image artifacts in PET-MR such as the effects of motion due to respiratory or cardiac contraction. Thus the phantom allows an environment free from these potentially con-founding effects focusing only on the assessment of the perfusion dynamics within the cardiac compartments. However, translation of calibrations from the phantom to the clinical setting should be treated with caution. Confounding factors from clinical data may include the use of respiratory correction via importing an average cine CT or using MR-based navigators (Ouyang et al., 2013) or employing MR motion-field based cardiac motion correction employed in PET reconstruction (Huang et al., 2015). Efforts to apply these techniques specifically to quantitative dynamic PET-MR cardiology are in their infancy, although some techniques are currently under development for static imaging (Nensa et al., 2013; Vontobel et al., 2015).
Conclusion
We have performed a feasibility study of the first simultaneous PET-MR acquisitions from a dynamic cardiac perfusion phantom, showing similar first-pass dynamics of both the PET and MR contrast agents. We have described the resulting simultaneous traces, showed ini-tial repeatability of the phantom studies and also demonstrated a correlation between perfu-sion quantification of the PET time-activity traces using a kinetic model, relative MR perfusion using a deconvolution model and the true manually set myocardial perfusion rate. The phantom shows potential for improving standardisation of perfusion measurements, analysis routines, development of imaging protocols and potential calibration of MR perfu-sion values. We have also described the major limitations of the system, detailing how these phantom studies are an important stepping stone allowing investigation of sequence devel-opment/comparison and kinetic model development in both PET and MR modalities.
Abbreviations
CAD:Coronary artery disease; CMR: Cardiac magnetic resonance; GBCA: Gadolinium based contrast agent;
MFR: Myocardial flow reserve; MPI: Myocardial perfusion imaging; PET-MR: Positron emission tomography & magnetic resonance
Funding
Funded by the National Institute for Health Research (NIHR) Biomedical Research Centre award to Guy’s & St Thomas’NHS Foundation Trust in partnership with King’s College London and by the NIHR Healthcare Technology Co-operative for Cardiovascular Disease at Guy’s and St Thomas’Foundation Trust. Funded by the Wellcome Trust and EPSRC under grant number WT 088641/Z/09/Z.
Funded by King’s College London and UCL Comprehensive Cancer Imaging Centre and by the CRUK and EPSRC in association with the MRC and DoH (England).
Funded by the British Heart Foundation award RE/08/003.
Availability of data and materials
Data is available from the corresponding authors on a reasonable request.
Authors’contributions
JOD, ES, MSN, PKM and AC designed the study. JOD, AC and ES carried out phantom preparations, acquisitions and reconstructions. JOD, AC and PS analyzed and interpreted the resulting data. JOD, MSN and AC drafted the manuscript, which was revised by all authors. All authors approved the final manuscript.
Ethics approval and consent to participate
Not applicable.
Consent for publication
Not applicable.
Competing interests
The authors declare that they have no competing interests.
Publisher’s Note
Springer Nature remains neutral with regard to jurisdictional claims in published maps and institutional affiliations.
Author details
1Division of Imaging Sciences and Biomedical Engineering, PET Imaging Centre, King’s College London, St. Thomas’
Hospital, 1st Floor Lambeth Wing, St Thomas’Hospital, London SE1 7EH, UK.2Division of Imaging Sciences, King’s College London, Wellcome Trust/EPSRC Medical Engineering Centre, St. Thomas’Hospital, London, UK.3Bristol Heart Institute, Bristol, UK.4Siemens Healthcare Limited, Frimley, Camberley, UK.5Department of Cardiology, Guy’s and St Thomas’NHS Foundation Trust, London, UK.
Received: 12 April 2017 Accepted: 1 September 2017
References
Bengel FM, Higuchi T, Javadi MS, Lautamaki R (2009) Cardiac positron emission tomography. J Am Coll Cardiol 54(1):1–15 Chiribiri A, Schuster A, Ishida M, Hautvast G, Zarinabad N, Morton G et al (2013) Perfusion phantom: An efficient and
reproducible method to simulate myocardial first-pass perfusion measurements with cardiovascular magnetic resonance. Magn Reson Med 69(3):698–707
Di Carli MF, Dorbala S, Meserve J, El Fakhri G, Sitek A, Moore SC (2007) Clinical myocardial perfusion PET/CT. J Nucl Med 48(5):783–793
Fihn SD, Gardin JM, Abrams J, Berra K, Blankenship JC, Dallas AP et al (2012) 2012 ACCF/AHA/ACP/AATS/PCNA/SCAI/ STS Guideline for the diagnosis and management of patients with stable ischemic heart disease: a report of the American College of Cardiology Foundation/American Heart Association Task Force on Practice Guidelines, and the American College of Physicians, American Association for Thoracic Surgery, Preventive Cardiovascular Nurses Association, Society for Cardiovascular Angiography and Interventions, and Society of Thoracic Surgeons. J Am Coll Cardiol 60(24):e44–e164
Gerber BL (2012) Quantification of myocardial perfusion and myocardial perfusion reserve by positron emission tomography and cardiovascular magnetic resonance imaging. J Am Coll Cardiol 60(16):1556–1557
Hautvast G, Chiribiri A, Zarinabad N, Schuster A, Breeuwer M, Nagel E (2012) Myocardial blood flow quantification from MRI by deconvolution using an exponential approximation basis. IEEE Trans Biomed Eng 59(7):2060–2067 Huang C, Petibon Y, Ouyang J, Reese TG, Ahlman MA, Bluemke DA et al (2015) Accelerated acquisition of tagged MRI
for cardiac motion correction in simultaneous PET-MR: phantom and patient studies. Med Phys 42(2):1087–1097 Ishida M, Schuster A, Morton G, Chiribiri A, Hussain S, Paul M et al (2011) Development of a universal dual-bolus
injection scheme for the quantitative assessment of myocardial perfusion cardiovascular magnetic resonance. J Cardiovasc Magn Reson 13:28
Jerosch-Herold M (2010) Quantification of myocardial perfusion by cardiovascular magnetic resonance. J Cardiovasc Magn Reson 12:57
Jerosch-Herold M, Wilke N, Stillman AE, Wilson RF (1998) Magnetic resonance quantification of the myocardial perfusion reserve with a Fermi function model for constrained deconvolution. Med Phys 25(1):73 Kero T, Nordstrom J, Harms HJ, Sorensen J, Ahlstrom H, Lubberink M (2017) Quantitative myocardial blood flow
imaging with integrated time-of-flight PET-MR. EJNMMI Phys 4(1):1
Martinez-Moller A, Souvatzoglou M, Delso G, Bundschuh RA, Chefd'hotel C, Ziegler SI et al (2009) Tissue classification as a potential approach for attenuation correction in whole-body PET/MRI: evaluation with PET/CT data. J Nucl Med 50(4):520–526
Mehranian A, Zaidi H (2015) Impact of Time-of-Flight PET on Quantification Errors in MR Imaging-Based Attenuation Correction. J Nucl Med 56(4):635–641
Morton G, Chiribiri A, Ishida M, Hussain ST, Schuster A, Indermuehle A et al (2012) Quantification of absolute myocardial perfusion in patients with coronary artery disease: comparison between cardiovascular magnetic resonance and positron emission tomography. J Am Coll Cardiol 60(16):1546–1555
Nensa F, Poeppel TD, Beiderwellen K, Schelhorn J, Mahabadi AA, Erbel R et al (2013) Hybrid PET/MR imaging of the heart: Feasibility and Initial Results. Radiology 268(2):366–373
Nensa F, Tezgah E, Poeppel TD, Jensen CJ, Schelhorn J, Kohler J et al (2015) Integrated 18F-FDG PET/MR imaging in the assessment of cardiac masses: a pilot study. J Nucl Med 56(2):255–260
O'Doherty J, Sammut E, Schleyer P, Stirling J, Nazir S, Marsden PK, et al. Simultaneous PET-MR first-pass perfusion imaging using a novel cardiac perfusion phantom. European Association of Nuclear Medicine Annual Meeting; Barcelona, Spain 2016
O'Doherty J, Schleyer P (2017) The effect of gadolinium-based MR contrast agents on PET attenuation coefficients and quantification during simultaneous dynamic PET-MR for cardiac studies. EJNMMI Phys. 4(4):1–10
O'Doherty J, Schleyer P, Pike L, Marsden P (2014) Effect of scanner dead time on kinetic parameters determined from image derived input functions in 13N cardiac PET. J Nucl Med 55(supplement 1):605
Otton J, Morton G, Schuster A, Bigalke B, Marano R, Olivotti L et al (2013) A direct comparison of the sensitivity of CT and MR cardiac perfusion using a myocardial perfusion phantom. J Cardiovasc Comput Tomogr 7(2):117–124 Ouyang J, Li Q, El Fakhri G (2013) Magnetic resonance-based motion correction for positron emission tomography
imaging. Semin Nucl Med 43(1):60–67
Patel AR, Antkowiak PF, Nandalur KR, West AM, Salerno M, Arora V et al (2010) Assessment of advanced coronary artery disease: advantages of quantitative cardiac magnetic resonance perfusion analysis. J Am Coll Cardiol 56(7):561–569 Petibon Y, Ouyang J, Zhu X, Huang C, Reese TG, Chun SY et al (2013) Cardiac motion compensation and resolution
modeling in simultaneous PET-MR: a cardiac lesion detection study. Phys Med Biol 58(7):2085–2102
Ratib O, Nkoulou R (2014) Potential Applications of PET/MR Imaging in Cardiology. J Nucl Med 55(Supplement 2):40S–46S Ratib O, Nkoulou R, Schwaiger M (2013) Cardiovascular clinical applications of PET/MRI. Clin Transl Imaging 1(1):65–71 Renaud JM, Yip K, Guimond J, Trottier M, Pibarot P, Turcotte E, et al (2017). Characterization of 3D PET systems for
accurate quantification of myocardial blood flow. J Nucl Med 58(1):103-109
Rischpler C, Langwieser N, Souvatzoglou M, Batrice A, van Marwick S, Snajberk J et al (2015) PET/MRI early after myocardial infarction: evaluation of viability with late gadolinium enhancement transmurality vs. 18F-FDG uptake. Eur Heart J Cardiovasc Imaging 16(6):661–669
Rischpler C, Nekolla SG, Dregely I, Schwaiger M (2013) Hybrid PET/MR imaging of the heart: potential, initial experiences, and future prospects. J Nucl Med 54(3):402–415
Rischpler C, Nekolla SG, Kunze KP, Schwaiger M (2015) PET/MRI of the heart. Semin Nucl Med 45(3):234–247 Schneider S, Batrice A, Rischpler C, Eiber M, Ibrahim T, Nekolla SG (2014) Utility of multimodal cardiac imaging with
PET/MRI in cardiac sarcoidosis: implications for diagnosis, monitoring and treatment. Eur Heart J 35(5):312 Schuster A, Sinclair M, Zarinabad N, Ishida M, van den Wijngaard JP, Paul M et al (2013) A quantitative high resolution
assessment of myocardial blood flow from contrast-enhanced first-pass magnetic resonance perfusion imaging: microsphere validation in a magnetic resonance compatible free beating explanted pig heart model. J Cardiovasc Magn Reson 15(Suppl 1):E19
Task Force M, Montalescot G, Sechtem U, Achenbach S, Andreotti F, Arden C et al (2013) 2013 ESC guidelines on the management of stable coronary artery disease: the Task Force on the management of stable coronary artery disease of the European Society of Cardiology. Eur Heart J 34(38):2949–3003
Vontobel J, Liga R, Possner M, Clerc OF, Mikulicic F, Veit-Haibach P et al (2015) MR-based attenuation correction for cardiac FDG PET on a hybrid PET/MRI scanner: comparison with standard CT attenuation correction. Eur J Nucl Med Mol Imaging 42(10):1574–1580
Zarinabad N, Chiribiri A, Hautvast G, Shuster A, Sinclair M, van den Wijngaard JP et al (2013) Modelling Parameter Role on Accuracy of Cardiac Perfusion Quantification. In: Ourselin S, Rueckert D, Smith N (eds) Functional Imaging and Modeling of the Heart. Springer-Verlag, Heidelberg
Zarinabad N, Chiribiri A, Hautvast GL, Ishida M, Schuster A, Cvetkovic Z et al (2012) Voxel-wise quantification of myocardial perfusion by cardiac magnetic resonance. Feasibility and methods comparison. Magn Reson Med 68(6): 1994–2004