R E S E A R C H
Open Access
Power and loyalty defined by proximity to
influential relations
Dror Fidler
Correspondence: [email protected] The Bartlett, University College London, Tottenham Court Road, London, UK
Abstract
This paper examines a simple definition of power as a composite centrality being the composition of eigenvector centrality and edge betweeness. Various centralities related to the composition are compared on social and collaboration networks. A derived defection score for social fission scenarios is introduced and is demonstrated in Zachary’s Karate club to predict the sole defection in terms of network measures rather than psychological factors. In a network of political power in Mexico across various periods, the two definitions of power serve to shed light on a political power transition between two groups.
Keywords: Composite centrality; Power; Loyalty; Eigenvector; Betweeness; Fission
Introduction
Networks are often modeled as agraph, which consists of set of nodes (V) and edges (E), such thatE ⊆ V ×V. IfE is a symmetric relation, thenGis called anundirected graph. Anetwork centralityis a function defined onVwhich assigns importance to nodes according to certain criteria.
Various feedback centralities have been introduced (Seeley [1], Hubbell [2], Katz [3], Bonacich [4]), which share the common objective of measuring a node’s importance while taking into account the importance of its neighbors. The simplified form of a feedback centrality termed eigenvector centrality is based on the Perron-Frobenius theorem which ensures that for a strongly connected graph, the leading eigenvector of the adjacency matrix contains only real positive values ([5]). Let X = (x1. . .xn) be the eigenvector of the largest eigenvalue of the adjacency matrix AG ofG, andλ1 is the largest
eigen-value. Then, the eigenvector centrality of node i is CEV(i) = λ11xi. Informally, CEV will find a set of nodes which are more densely connected (clique-like) than other sub-sets of V. A node with a highCEV score would have relatively more edges between its neighbors.
Betweeness centrality, which was introduced by Freeman in [6] and Anthonisse in [7], measures the proportion of shortest paths passing by a given node. Formally, letσs,tbe the number of shortest paths between nodess,t,andσs,t(v) be the number of shortest paths between s,tthat pass throughv; then, the betweeness ofvis defined asCB(v) =
s=vt=vσsσ,ts(,tv). In [7], betweeness is also defined for edges, for an edgee∈E,CEB(e)=
relation between the represented actors is important in the sense that it is expected to be used more by other actors in the network. Edge betweeness has also been used to detect community structure ([8]).
Definitions and properties
Composite centralities have been suggested based on statistical measures ([9]); here, the natural composition is taken. Let C1 be a node centrality, and C2 be an edge
central-ity whose values are non negative. The fact thatC1is node based andC2is edge based
suggests a natural function composition, define:
AC2
i,j=
⎧ ⎨ ⎩
C2((i,j)) (i,j)∈E
0 (i,j)∈E
(1)
And notateC1(C2)(v)as the value forvwhenC1is computed onAC2. A matrix is said
to beirreducibleif its interpretation as a graph adjacency matrix produces a strongly connected graph. IfGis an edge weighted graph, it may be thatCEB(e)=0 fore∈E, while for non-weighted graphs, this is not the case; since every edge would be on the shortest path between its endpoints. Thus, for a weighted graph, using Equation 1 may produce a reducible matrix, since some edges may have zero betweeness.
Proposition 0.1.Let G be an positive edge weighted undirected connected graph, then ACEB is irreducible.
Proof. Letu,v ∈ V, since Gis connected, there exists at least one shortest pathPuv connectinguandv. From the definition ofCEB, for any edgee∈Puv,CEB(e) >0. There-fore, in the graph defined byACEB, there exists a positively weighted path connecting uandv.
NotateCEVB(v)=CEV(CEB)(v). From 0.1,CEVBis well defined, as the Perron-Frobenius theorem holds the same way as forCEV. In this case, it is assumed that high edge betwee-ness indicates a potentially important relation, and that an actor is more powerful if it participates in important relations, either directly, or its neighbors have important relations between themselves.
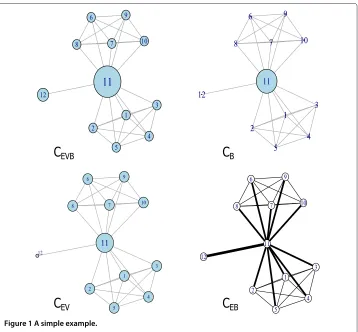
An artificial example
Figure 1 A simple example.
Eigenvectors in a weighted graph and scaling behaviour
The justification of usingCEV on an edge weighted network is, as explained by Newman in [10] , ifX=(x1. . .xn)is the leading eigenvector, then
CEV(i)=xi= 1
λ1
j
Aijxj (2)
hence multiplying the weight of an edge by a positive factor will adjust the contribution of the neighbour incident on that edge to the eigenvector centralities of its incident nodes by the same factor, i.e. if the weight of (v,u) is 3 then the contribution ofutoCEV(v)is multiplied by a factor of 3. Thus, calculating the eigenvector centrality of an edge weighted network would score nodes according to the weighted density of their neighborhood.
An informal scaling argument regardingCEVBis shown as follows. It is proven in [11] that for a graphG=(V,E)and any nodev∈V,
CB(v)=
(u,v)∈E
CEB((u,v))−(n−1) (3)
in relation toCB, as the row sums in the edge betweeness weighted adjacency matrix are proportional toCB. Indeed, visually inspecting the scatterplots of log-transformedCBand CEVB(Figure 2) demonstrates that for nodes that do have zeroCBmay still have significant values ofCEVBin a similar way as in the artificial example; as for nodes that do not have zeroCB, there is a linear or ‘cone’-shaped relation , which provides some evidence of a power scaling relation betweenCBandCEVB.
Predicting loyalty in a fission scenario
LetV =S1∪S2be a disjoint partition ofV. Assume w.l.o.g thatv∈S1. LetX=(x1, ...,xn) be the leading eigenvector, then the contribution ofS2toCEVB(v)is:
CS2
EVB(v)=
(v,vi)∈E,vi∈S2
CEB((v,vi))xi (4)
By the definition ofCEVBas power, Equation 4 describes the proportion of power ofv that comes from direct links to the opposing group members. In a social fission situation, it may be the case that members of one group defect to the other as in [13]. Motivated by defection prediction, define thedefection scoreas:
DEVB(v)=CSEVB2 (v)−CEVBS1 (v) (5)
For a nodev,DEVB(v)is simply the difference between the power ofvthat comes from links to the opposing group and the power that comes from links to its own group. It is hypothesized that a high positiveDEVBwould mean a higher temptation to defect, while a more negativeDEVBwould mean a greater tendency to stay put.
Figure 2 The Log/log relation ofCBandCEVB.Clockwise from top left : Zachary’s Karate club, Mexican
Computational complexity
The complexity of computing a composite function as defined here is simply the sum of the complexities of the underlying functions. An algorithm ofO(|V||E|)for betweeness is described in [14]. Eigenvector centrality requires only the largest eigenvalue and the corresponding eigenvector. In practice, this is solvable inO(|V| + |E|)using an ARPACK eigenvector solver. Thus, the expected overall time is the same as for edge betweeness. The computational complexity forDEVB(v)isO(|V|)ifCEVB(v)is already computed.
Case studies
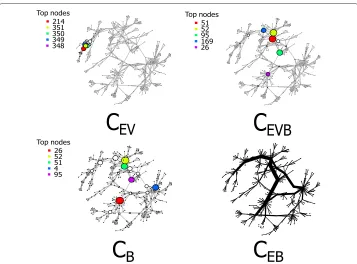
Several social networks are examined, two ‘friendship’ networks: Zachary’s Karate club ([13]) and a network of the Mexican political elite in the twentieth century. In addition, two larger collaboration networks are studied, a collaboration network of researchers in Network Science (NS) taken from [15] and the collaboration network of preprints on the astrophysics archive at www.arxiv.org, 1995-1999, as compiled by Newman [16]. As can be seen in Table 1,CEVBandCBare more correlated in the friendship networks than the collaboration networks.
A network describing social fission
Zachary’s Karate club is one of the earliest social networks studied as a graph ([13]). The network consists of 34 actors whose common activity is a Karate club, edges are weighted by the level of acquaintance shared by actors beyond the club. The club underwent fission during the period of observation due to a long conflict between the club administrator and the Karate instructor. Zachary’s original analysis was based on network flow and min-imal cuts, where the edge weights represented capacity. In this case, the reciprocal of the weights are taken, as the edge weights represent distance and not flow capacity. As seen in Figure 3,CEVBdiffers fromCEVandCBwith regard to key players; for instance, actor 34 is reduced inCEVBin comparison to other actors, while actors 3 and 9 have a relative increase inCEVB. By inspectingCEBvisually in Figure 3, it indeed seems that actors 3 and 9 are better located within the network regarding proximity to edges with high betwee-ness. Zachary’s flow analysis managed to model and predict the group affiliation before and after the fissure with near perfection save one case.
Zachary’s original explanation [13] was psychological, based on the temporal circum-stance of individual 9:
‘This can be explained by noting that he was only three weeks away from a test for black belt (master status) when the split in the club occurred. Had he joined the officers’ club he would have had to give up his rank and begin again in a new style of karate with a white (beginner’s) belt, since the officers had decided to change the style of karate practiced in their new club’.
Table 1 Spearman rank correlation scores compared for various networks
Network |V| |E| CEVB|CB CEVB|CEV CB|CEV
Karate club 34 78 0.762 0.479 0.398
Mexican politicians 35 117 0.703 0.607 0.739
NS collaboration 374 914 0.427 0.504 0.049
Figure 3 The Karate club.Four centralities in Zachary’s network. Colors of nodes (blue or red) designate faction membership, while the larger the node is, the higher the centrality score. For edge betweeness (lower left), thicker edges have higher scores.
Here, an additional factor may be observed based onDEVBscores.DEV is defined in a similar way toDEVB, using the adjacency matrix of G without computing edge betweeness, and as visible in Figure 4,DEVpredicts that actor 10 would have the highest incentive to defect whileDEVBpredicts actor 9 for defection (as indeed took place). In addition,DEVB predicts that actors 1 and 34, which are the leaders of the factions, would have the greatest tendency to stay put whileDEV makes no such prediction. Unfortunately, no data exists as to the possible dilemmas of other actors such as nodes 10 and 33.
Collaboration networks
Figure 4 Loyalty or defection.Predicting the incentive to defect. Larger squares mean a higher positive defection score, while larger circles mean a more negative score, which represents the tendency to stay within the original group.
As with the Karate club, the reason why actor 4 loses power according toCEVBis clearer by looking at Figure 5, the edges with higher betweeness form a path through the ‘middle’ while actor 4 is located on a lower scored subsidiary of the sub-network of edges with high betweeness. So, although actor 4 has high betweeness as a node centrality,CEVBis reduced due to a lower scoring edge betweeness neighborhood.
A transition of political power
A network of the Mexican political elite was described in [17] and compiled in [18]. The network consists of the core of the political elite and their collaborators across a time period stretching from the early to late twentieth century. The edges of the network are unweighted and represent close ties. During the time period examined, the PRI (Partido Revolucionario Institucional) was continuously in power, however there was an internal struggle between two main groups within the party, politicians associated with the mili-tary against ‘civilian’ politicians. During the period, there was a transition of power from the former to the latter. In this context, since the network spans most of the twentieth century,CEV would represent the amount of connections surrounding a politician dur-ing the height of his political activity but as already demonstrated in the NS network (Figure 5) that is not necessarily the same as a highCEVBscore. On the other hand,CEVB would indicate the proximity of a politician to the relations that are expected to be signif-icant throughout the era; therefore,CEVBis interpreted as political power. The defection scores, in this context, are interpreted as the level of political collaboration with mem-bers of the other side. In Figure 6,CEV andCEVBare examined in order to understand if both perspectives can illuminate the power transition purely by examining the network. In Figure 6, it can be seen that node 12 has the highestCEVBandCEV score. Node 12 represents Miguel Alemán Valdés, the 46th Mexican president whose reign marked the transition from military associated power to more ‘civilian’ rule. Interestingly, he also has the highestDEVBandDEVscores, meaning that the most powerful politician in the net-work (highestCEVBscore) collaborated closely with ‘civilian’ politicians, both from a ‘local’ viewpoint (highDEV) and from a ‘global power’ viewpoint (highDEVB). Indeed, in 1952, he was succeeded by node 18, Adolfo Ruiz Cortines, a ‘civilian’ politician, which signified the beginning of the new era. A different observation from theDEVBchart is that a high level of collaboration with the opposing side is more expressed than inDEVwhen family ties are present. For instance, node 34 is Miguel Alemán Velasco who is the son of Miguel Alemán Valdés, and node 14 is Ramón Beteta who was the brother of node 13, major general Ignacio Beteta, a close associate of node 10, the powerful Lázaro Cárdenas, and both 34 and 14 score high onDEVB. To conclude, the point of political power transition is visible in Figure 6, and the idea that family ties may precede group affiliation in political power sharing is visible inDEVB.
Conclusions
Figure 6 An analysis of a network of the Mexican elite in the twentieth century.Viewing the different measures side by side enables to pinpoint the individual whose reign marked the power transition from ‘militarists’ to ‘civilians’.
thatCEVBbalances the local properties of eigenvector centrality with the global properties of betweeness, giving a different perspective on power distribution.CEVBin combination withCEV and the defection scores were demonstrated to be useful tools in the analysis of the transition and sharing of power in twentieth century Mexican politics. Finally, the possibility of modelingk-fission scenarios (using a more general defection score) is a nat-ural expansion but would need considerable supporting empirical data as to the behaviour of individuals in such situations.
Data accessibility
Newman’s NS network is available at [19], and Zachary’s Karate club data was accessed through [20].
Competing interests
The author declares that he has no competing interests.
Acknowledgments
This paper was produced from research funded from the EPSRC Platform grant awarded to the Space Group at the Bartlett, Faculty of the Built Environment, University College London (grant reference EP/G02619X/1).
Received: 10 July 2014 Accepted: 30 December 2014
References
1. Seeley, JR: The net of reciprocal influence. Can. J. Psychol. III.4, 234–240 (1949)
2. Hubbell, CH: In input-output approach to clique identification. Sociometry.28, 377–399 (1965) 3. Katz, L: A new status index derived from sociometric analysis. Psychometrika.18(1), 39–43 (1953) 4. Bonacich, P: Power and centrality: a family of measures. Am. J. Sociol.92(5), 1170–1182 (1987) 5. Brualdi, RA, Ryser, HJ: Combinatorial Matrix Theory. Cambridge University Press, Cambridge (1991). ISBN
6. Freeman, L: A set of measures of centrality based on betweenness. Sociometry.40, 35–41 (1977) 7. Anthonisse, JM: The rush in a directed graph. Technical, Report BN 9/71. Stichting Mathematisch Centrum,
Amsterdam (1971)
8. Girvan, M, Newman, MEJ: Community structure in social and biological networks. PNAS.99(12), 7821–7826 (2002) 9. Joseph, AC, Chen, G: Composite centrality: a natural scale for complex evolving networks. Phys. D: Nonlinear
Phenomena.267, 58–67 (2014)
10. Newman, MEJ: Analysis of weighted networks. Phys. Rev. E.70, 056131 (2004)
11. Brandes, U, Erlebach, T: Network Analysis: Methodological Foundations. Lecture Notes in Computer Science. Springer-Verlag New York, Inc., New York (2005)
12. Goh, K-I, Kahng, B, Kim, D: Universal behavior of load distribution in scale-free networks. Phys. Rev. Lett.87, 278701 (2001)
13. Zachary, WW: An information flow model for conflict and fission in small groups. J. Anthropol. Res.33, 452–473 (1977) 14. Brandes, U: A faster algorithm for betweenness centrality. J. Math. Sociol.25(2), 163–177 (2001)
15. Newman, MEJ: Finding community structure in networks using the eigenvectors of matrices. Phys. Rev. E.74, 036104 (2006)
16. Newman, MEJ: Scientific collaboration networks. II. Shortest paths, weighted networks, and centrality. Phys. Rev. E. 64, 016132 (20016)
17. Mendieta, JG, Schmidt, S: The political network in Mexico. Soc. Netw.18(4), 355–381 (1996)
18. Nooy, W, Mrvar, A, Batagelj, V: Exploratory social network analysis with, Pajek, Chapter 12, Cambridge (2004) 19. Batagelj, V, Mrvar, A: Pajek datasets (2006). http://vlado.fmf.uni-lj.si/pub/networks/data/
20. Csardi, G: igraphdata: a collection of network data sets for the igraph package. R package version 0.1-1 (2013)
Submit your manuscript to a
journal and benefi t from:
7Convenient online submission 7Rigorous peer review
7Immediate publication on acceptance 7Open access: articles freely available online 7High visibility within the fi eld
7Retaining the copyright to your article