MURDOCH RESEARCH REPOSITORY
This is the author’s final version of the work, as accepted for publication
following peer review but without the publisher’s layout or pagination.
The definitive version is available at
http://dx.doi.org/10.1017/S1751731114002900
Anderson, F.L., Pannier, L., Pethick, D.W. and Gardner, G.E.
(2015) Intramuscular fat in lamb muscle and the impact of
selection for improved carcass lean meat yield. Animal,
9 (6). pp. 1081-1090.
http://researchrepository.murdoch.edu.au/24949/
Copyright: © The Animal Consortium 2014.
Intramuscular fat in lamb muscle and the impact of selection for
improved carcass lean meat yield
F. Anderson
1,2†, L. Pannier
1,2, D. W. Pethick
1,2and G. E. Gardner
1,21Australian Cooperative Research Centre for Sheep Industry Innovation, University of New England, Armidale, NSW 2351, Australia;2School of Veterinary and Life
Sciences, Murdoch University, Murdoch, WA 6150, Australia
(Received 23 July 2014; Accepted 30 September 2014)
Intramuscular fat percentage (IMF%) has been shown to have a positive influence on the eating quality of red meat. Selection of Australian lambs for increased lean tissue and reduced carcass fatness using Australian Sheep Breeding Values has been shown to decrease IMF% of theMuscularis longissimus lumborum. The impact this selection has on the IMF% of other muscle depots is unknown. This study examined IMF% infive different muscles from 400 lambs (M. longissimus lumborum,Muscularis
semimembranosus,Muscularis semitendinosus,Muscularis supraspinatus,Muscularis infraspinatus). The sires of these lambs had a broad range in carcass breeding values for post-weaning weight, eye muscle depth and fat depth over the 12thrib (c-site fat depth). Results showed IMF% to be highest in theM. supraspinatus(4.87 ± 0.1,P<0.01) and lowest in theM. semimembranosus (3.58 ± 0.1,P<0.01). Hot carcass weight was positively associated with IMF% of all muscles. Selection for decreasing c-site fat depth reduced IMF% in theM. longissimus lumborum,M. semimembranosusandM. semitendinosus. Higher breeding values for post-weaning weight and eye muscle depth increased and decreased IMF%, respectively, but only in the lambs born as multiples and raised as singles. For each per cent increase in lean meat yield percentage (LMY%), there was a reduction in IMF% of 0.16 in allfive muscles examined. Given the drive within the lamb industry to improve LMY%, our results indicate the importance of continued monitoring of IMF% throughout the different carcass regions, given its importance for eating quality.
Keywords:lamb, intramuscular fat, breeding value, lean meat yield
Implications
Previous studies have demonstrated that selection for lean meat yield using breeding values for post-weaning growth, eye muscle depth and back fat depth is reducing intramus-cular fat percentage (IMF%) in the loin. This study has demonstrated that this impact extends beyond the loin, to muscles of the fore and hind sections of the carcass. This work provides essential information regarding the impact of carcass breeding values on IMF% and eating quality, facil-itating the management of these detrimental effects.
Introduction
Consumers in both domestic and international markets have an increasing desire for lamb which produces retail cuts of meat that are well muscled and low in salvage fat, repre-senting value for money and healthy meal options (Pethick
et al., 2006). The Australian lamb industry has responded to these market drivers to select for larger, leaner lambs
(Hallet al., 2000; Banks, 2002; Lavilleet al., 2004). Health characteristics such as low levels of fat and the nutritional content will remain important (Harper and Pethick, 2004; Pannieret al., 2014b); however, eating quality has also been shown to be important to consumers (Harper and Pethick, 2004). Intramuscular fat percentage (IMF%) is a key deter-minant of eating quality in red meat and it is well accepted that IMF% has a positive impact on flavour, juiciness and tenderness (Thompson, 2004; Hopkinset al., 2006; Pannier
et al., 2014c). In lamb, it has been suggested that a minimum of four to five IMF% is required for Australian consumer satisfaction with regard to palatability (Hopkinset al., 2006).
Accordingly, the IMF% of the Muscularis longissimus
lumborum(short loin) has been identified as a key factor for maintaining premium eating quality of lamb (Pannieret al., 2014a and 2014c).
Given that the loin musculature contains the most valuable cuts in the carcass, previous research has focused on the eating quality and IMF% of this muscle (McPheeet al., 2008; Pannier
et al., 2014a and 2014c). The IMF% of muscles other than the
M. longissimus lumborumhas not been well described in lamb. These levels are likely to vary between muscles, in part as a
†E-mail: [email protected]
Animal, page 1 of 10 © The Animal Consortium 2014
consequence of functional variation owing to musclefibre type (Hocquetteet al., 2010). Muscles composed of more oxidative
fibres contain more triglycerides and so IMF (Hocquetteet al., 2010). Muscles responsible for maintenance of posture tend to be more oxidative and are predominantly comprised of Type 1
fibres with a propensity for higher IMF% (Picardet al., 2002). A key factor driving reduced IMF% in theM. longissimus lumborumis selection for lean growth. Pannieret al. (2014a) demonstrated an association between various carcass indi-cators of fatness and IMF% in theM. longissimus lumborum, whilst Gardneret al. (2010) reported a negative phenotypic (−0.24) and genetic correlation (−0.46) between IMF% and lean meat yield percentage (LMY%). Selection for improved LMY% in Australian sheep is performed indirectly through the use of Australian Sheep Breeding Values (ASBVs) to increase post-weaning weight (PWWT) and c-site eye muscle depth (PEMD), and reduced c-site fat depth (PFAT; c-site defined as a measure 45 mm from the midline over the 12thrib). Pannieret al. (2014a) demonstrated that decreas-ing PFAT and increasdecreas-ing PEMD, both reduced IMF% in the
M. longissimus lumborum. A decreased PFAT breeding value reduces total carcass fatness, which would include IMF. Moreover, sires with high PEMD and/or low PFAT breeding values had increased weight of theM. longissimus lumborum, located in the saddle section (Gardneret al., 2010; Anderson
et al., 2013) and had proportionately more lean weight in the saddle (loin) section than in other regions of the carcass. Therefore, it seems likely that the impact of these breeding values on IMF%, delivered through their effects on muscle hypertrophy and so dilution of IMF%, will be greater in the saddle musculature.
Lambs from sires selected for high PWWT may also have reduced IMF%. These lambs are faster growing due to their larger mature size (Huisman and Brown, 2008), thus when compared at the same carcass weight, they will be leaner and less mature and subsequently have reduced IMF%. However, in the study by Pannieret al. (2014a), there was no
association of PWWT with IMF% in the M. longissimus
lumborum, suggesting that any maturity-linked effect may be too subtle to impact. This is likely to extend to other muscles of the carcass.
Therefore, given the negative phenotypic correlation of LMY% and IMF%, we hypothesised that as LMY% increases, measured in this study by computed tomography (CT) lean percentage (CT lean%) the IMF% will decrease. Based on the impact of ASBVs used to improve LMY% on carcass com-position, we hypothesised that lambs from high PEMD sires
or from low PFAT sires will have reduced IMF% in the short loin, but to a lesser extent in the hind and fore sections, and that increasing sire PWWT will have no impact on IMF% in the carcass. Finally, we hypothesised that the IMF% of muscles in postural regions of the carcass will have greater IMF% than muscles in locomotive regions.
Material and methods
Experimental design and slaughter details
The Australian Cooperative Research Centre for Sheep Industry Innovation established an Information Nucleus Flock commencing in 2007 (Fogarty et al., 2007). This paper examines data from 400 lambs born at Katanning, Western Australia in 2011.
The lambs (Merino, Maternal×Merino, Terminal×Merino and Terminal×Border Leicester–Merino) were the progeny of 97 industry sires, representing the major sheep breeds used in the Australian industry. The sires types included 46 Terminal sires (Hampshire Down, Poll Dorset, Suffolk, Texel, White Suffolk), 16 Maternal sires (Border Leicester, Coop-worth, Corriedale, Dohne Merino, Prime South African Meat Merino) and 35 Merino sires (Merino, Poll Merino). These sires had ASBVs for PWWT, PEMD and PFAT, which were all sourced from Sheep Genetics, which is Australia’s national genetic evaluation database for sheep (Brownet al., 2007). The sire breeding values were generated within three sepa-rate databases for Terminal, Maternal and Merino sired progeny. This was from an analysis completed in August 2013, and excluded progeny from the Information Nucleus Flock. Some of the youngest sires used in this experiment lacked industry records and therefore did not have ASBVs available. The ranges for these ASBVs varied within sire types as shown in Table 1.
Pregnant ewes were maintained on grass and
supplementary-fed grain only if pasture was limited. Ewes were scanned for multiple pregnancies and managed in groups with stocking density appropriate for paddock size, with no difference in the pasture available between different sire groups or birthing and rearing types.
Lambs were yarded the day before slaughter and trans-ported to a commercial abattoir in Katanning, held in lairage overnight and slaughtered the following day at a target aver-age carcass weight of 21.4 kg. Carcasses were subjected to medium voltage electrical stimulation (Pearceet al., 2010), and then sampled the day after slaughter for a wide range of car-cass and meat quality traits after being chilled overnight (4°C).
Table 1Number of lamb sires and mean (minimum, maximum) of Australian Sheep Breeding Values for each sire type
Sire type Number of sires PWWT (kg) PFAT (mm) PEMD (mm)
Maternal 16 5.9 (−3.1, 12.4) −0.8 (−2.1, 0.6) −0.1 (−1.6, 1.8) Merino 35 2.7 (−3.6, 10.8) −0.1 (−1.4, 1.9) 0.1 (−2.6, 2.0) Terminal 46 13.3 (7.3, 18.6) −0.44 (−1.7, 1.3) 1.5 (−0.7, 3.8)
Sample collection and measurements
Hot carcass weight (HCWT) was measured immediately after dressing and carcasses were transported to Murdoch University to undergo CT scanning within 72 h of slaughter. (For details of CT scanning, see Andersonet al., submitted.) CT scanning of the carcasses enabled the lean% to be determined, which was used as a covariate in some of the statistical models.
Following CT scanning, the individual muscles were dissected from each carcass, weighed and samples collected for IMF% measurement from the fore section, theMuscularis supraspinatusandMuscularis infraspinatus; from the saddle
section, the M. longissimus lumborum; and from the
hind section, Musculus semimembranosus and Muscularis semitendinosus. Owing to carcass imperfections, all five muscle could not always be obtained from each carcass. IMF was determined on all of these muscles using the method described by Andersonet al. (submitted).
Statistical analyses
The data analysed in the base model has been summarised in Table 2. The IMF% were analysed using linear mixed effect models (SAS version 9.1; SAS Institute, Cary, NC, USA). The base model included fixed effects for muscle (M. semimembranosus,M. semitendinosus,M. longissimus lumborum, M. supraspinatus,M. infraspinatus), sex within sire type (Merino wether, Maternal wether, Terminal female and Terminal wether), birthing and rearing type (term representing if lamb was born and reared as a single, born as multiple and raised as single or born and raised as a multi-ple), sire type (Merino, Maternal, Terminal), kill group and dam breed within sire type (Merino×Merino, Maternal× Merino, Terminal×Merino and Terminal×Border Leicester– Merino). Sire identification, dam identification and animal identification were included as random terms. All relevant
first-order interactions between fixed effects were tested and non-significant (P>0.1) terms were removed in a stepwise manner.
The association between IMF% and sire ASBVs for PWWT, PEMD and PFAT were tested in the base model. These ASBVs were initially included concurrently as covariates along with linear and quadratic interactions with thefixed effects. Non-significant (P>0.1) terms were removed in a stepwise manner. Correlations exist between the three ASBVs, therefore this process was repeated with ASBVs included one at a time to determine the independence of their effects.
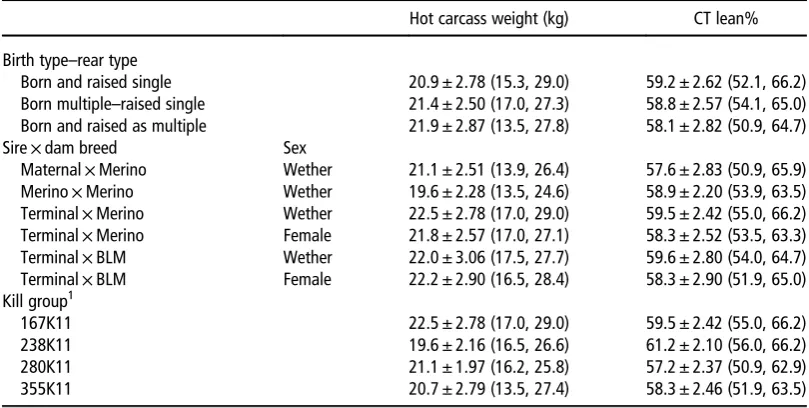
The base and ASBV models described above were additionally tested with HCWT included in the model as a covariate to determine the effect of HCWT on IMF%, and whether thefixed and ASBV effects were associated with HCWT. Similarly, this process was repeated using CT lean% and carcass weight at the time of CT scanning to determine the impact of carcass composition on IMF%. The relevant linear and quadratic interactions with these covariates were also included. The mean and distribution of the HCWT and CT
lean% data are shown in Table 3. Table
2 Number of lambs analysed in the base model according to sire type, sex, birthing and rearing type, dam breed and kill group Sex Birth-rearing type Dam breed Kill group 1 Female Male Single born and raised Born as multiple – raised as single Born and raised as multiple Merino BLM 167K11 238K11 280K11 355K11 Maternal 0 92 34 6 52 92 0 6 16 32 38 Merino 0 70 32 10 28 70 0 0 1 13 56 Terminal 111 127 96 24 117 140 95 95 83 55 5 Total 111 289 162 40 197 302 95 101 100 100 99 BLM = Border Leice ster – Meri no. 1Kill grou p = averag e age of lambs at slaughter follow ed by location and birth year (201 1); K = Ka tanning.
Results
Effect of non-genetic factors
The base model used 1900 of the 1908 observations available, after excluding animals with missing data and described 52% of the total variance in IMF%. The IMF% varied between all muscles examined (P<0.01, Table 4). The mean for IMF% from highest to lowest wasM. supraspinatus
(4.87 ± 0.1),M. semitendinosus(4.54 ± 0.1),M. longissimus lumborum (4.21 ± 0.1), M. infraspinatus (3.86 ± 0.1) and
M. semimembranosus(3.58 ± 0.1). Within the Terminal sired lambs, females (4.59 ± 0.08) had on average 0.2 IMF% more (P<0.01, Table 4) than wether lambs (4.38 ± 0.08). Birth type–rear type impacted on IMF% (P<0.05, Table 4). However, this was only evident in the Merino sired lambs, with the multiple born and raised lambs (4.23 ± 0.14) being 0.5 IMF% higher than that of the single born and raised or multiple born and single raised lambs. The IMF% increased with each successive kill group (P<0.01, Table 4), and on average there was an increase of 1.3 IMF% between thefirst and last kill group (Table 5). This increase varied between muscles (P<0.01, Table 4), with the greatest increase of 1.8 IMF% seen in theM. supraspinatusand the smallest increase of 0.9 IMF% seen in theM. semimembranosus(Table 5).
When the model was corrected for HCWT, the impact of kill group was reduced with IMF% differing by 1% on aver-age across the four kill groups. When both CT lean% and carcass weight at scanning were included in the model sex (sire type) was no longer significant.
Effect of sire type and dam breed
In the base model, sire was significant atP=0.08 with sire estimates varying between 3.66 and 4.81 IMF% within
Maternal, 3.34 and 4.49 IMF% within Merino and 3.91 and 5.06 IMF% within Terminal sired lambs.
Comparison of IMF% between sire types was possible only in the male progeny of Merino dams. The Merino sired lambs had on average 0.15 and 0.32 less IMF% than the Maternal and Terminal sired lambs (P<0.01, Tables 4 and 5). The greatest difference in IMF% was seen in the
M. semitendinosus, where the Merino sired lambs (3.95 ± 0.15) had 0.71 and 0.65 IMF% less than both the Terminal and Maternal sired animals. In theM. longissimus lumborum, the Merino sired lambs had 0.44 IMF% less than the Maternal sired lambs, but were not different compared with Terminal sired lambs. There were no differences between sire types in the other muscles.
The impact of dam breed on IMF% was assessed in the Terminal sired lambs. Differences were evident (P<0.01, Table 4) within theM. infraspinatus,M. supraspinatusand
M. semitendinosus, where the lambs from Border Leicester– Merino dams had IMF% of 4.21 ± 0.11, 5.29 ± 0.11 and 5.34 ± 0.11, compared with lambs from Merino dams with IMF% of 3.96 ± 0.11, 4.92 ± 0.11 and 4.81 ± 0.11 (values represent mean of male and female progeny in Table 5). A similar trend (P<0.1) was seen in the M. longissimus lumborum, where lambs from Border Leicester–Merino dams had IMF% of 4.50 ± 0.10 compared with 4.30 ± 0.10 for lambs from Merino dams.
Correcting the model for HCWT accounted for the
difference between sire types in the M. longissimus
lumborum, and partly accounted for the difference in the
M. semitendinosus, with the Merino sired lambs having only 0.5 IMF% less in theM. semitendinosusthan the Maternal and Terminal sired lambs. The difference between dam breeds was relatively unchanged. Including CT lean% and Table 3Lamb hot carcass weight (kg) and carcass lean percentage as measured by computed tomography displaying
raw mean ± s.d. (minimum, maximum)
Hot carcass weight (kg) CT lean%
Birth type–rear type
Born and raised single 20.9 ± 2.78 (15.3, 29.0) 59.2 ± 2.62 (52.1, 66.2) Born multiple–raised single 21.4 ± 2.50 (17.0, 27.3) 58.8 ± 2.57 (54.1, 65.0) Born and raised as multiple 21.9 ± 2.87 (13.5, 27.8) 58.1 ± 2.82 (50.9, 64.7) Sire×dam breed Sex
Maternal×Merino Wether 21.1 ± 2.51 (13.9, 26.4) 57.6 ± 2.83 (50.9, 65.9) Merino×Merino Wether 19.6 ± 2.28 (13.5, 24.6) 58.9 ± 2.20 (53.9, 63.5) Terminal×Merino Wether 22.5 ± 2.78 (17.0, 29.0) 59.5 ± 2.42 (55.0, 66.2) Terminal×Merino Female 21.8 ± 2.57 (17.0, 27.1) 58.3 ± 2.52 (53.5, 63.3) Terminal×BLM Wether 22.0 ± 3.06 (17.5, 27.7) 59.6 ± 2.80 (54.0, 64.7) Terminal×BLM Female 22.2 ± 2.90 (16.5, 28.4) 58.3 ± 2.90 (51.9, 65.0) Kill group1
167K11 22.5 ± 2.78 (17.0, 29.0) 59.5 ± 2.42 (55.0, 66.2) 238K11 19.6 ± 2.16 (16.5, 26.6) 61.2 ± 2.10 (56.0, 66.2) 280K11 21.1 ± 1.97 (16.2, 25.8) 57.2 ± 2.37 (50.9, 62.9) 355K11 20.7 ± 2.79 (13.5, 27.4) 58.3 ± 2.46 (51.9, 63.5)
CT lean%=percentage of lean in the carcass as measured by computed tomography; BLM=Border Leicester–Merino; K=Katanning.
1
Table 4Fvalues, and numerator and denominator d.f., for the effects of the base linear mixed effects model, corrected for hot carcass weight (HCWT), computed tomography lean% and Australian Sheep Breeding Values on intramuscular fat% of lamb muscles (Muscularis semimembranosus, Muscularis semitendinosus, Muscularis supraspinatus, Muscularis infraspinatus and Muscularis longissimus lumborum)
Model not corrected for hot carcass
weight (kg)
Model corrected for hot carcass
weight (kg)
Model corrected for computed tomography
lean%
Model corrected for Australian Sheep
Breeding Values
Effect NDF, DDF F-value NDF, DDF F-value NDF, DDF F-value NDF, DDF F-value
Muscle 4, 1476 153.31*** 4, 1423 0.47 4, 1446 150.98*** 4, 1407 104.14*** Sex (sire type) 1, 1476 7.58*** 1, 1423 5.8** ns ns 1, 1407 7.43*** Birth type–rear type 2, 1476 3.45** 2, 1423 3.93** 2, 1446 5.83*** 2, 1407 5.12*** Sire type 2, 1476 7.8*** 2, 1423 3.07** 2, 1446 3.24** 2, 1407 3.12** Kill group 3, 1476 29.77*** 3, 1423 23.85*** 3, 1446 25.06*** 3, 1407 25.87*** Dam breed (sire type) 1, 1476 7.46*** 1, 1423 4.51** 1, 1446 2.37 1, 1407 6.06** Muscle×sire type 8, 1476 3.52*** 8, 1423 1.88* 8, 1446 3.68*** 8, 1407 4.1*** Muscle×kill group 12, 1476 5.69*** 12, 1423 4.43*** 12, 1446 5.35*** 12, 1407 5.19*** Muscle×dam breed (sire type) 4, 1476 6.54*** 4, 1423 5.39*** 4, 1446 7.11*** 4, 1407 6.72*** Birth type–rear type×sire type 4, 1476 3.21** 4, 1423 3.01** 4, 1446 2.92** 4, 1407 2.69**
HCWT − − 1, 1423 13.25*** − − − −
HCWT×muscle − − 4, 1423 2.57** − − − −
HCWT×sire type − − 2, 1423 2.22 − − − −
HCWT×muscle×sire type − − 8, 1423 2.14** − − − −
CT weight (kg) − − − − 1, 1446 7.55*** − −
CT weight (kg)×CT weight (kg) − − − − 1, 1446 6.73*** − −
CT lean% − − − − 1, 1446 44.77*** − −
PWWT − − − − − − 1, 1407 0.64
PWWT×birth type–rear type − − − − − − 2, 1407 4.63***
PFAT − − − − − − 1, 1407 0.65
PFAT×muscle − − − − − − 4, 1407 2.31*
PFAT×PFAT − − − − − − 1, 1407 0.06
PFAT×PFAT×muscle − − − − − − 4, 1407 2.13*
PEMD − − − − − − 1, 1407 2.5
PEMD×birth type–rear type − − − − − − 2, 1407 3.05**
PEMD×PEMD − − − − − − 1, 1407 0.38
PEMD×PEMD×birth type–rear type − − − − − − 2, 1407 3.42**
NDF, DDF=numerator and denominator d.f.; HCWT=hot carcass weight; CT=computed tomography; PWWT=post-weaning weight; PFAT=post-weaning c-site fat depth; PEMD=post-weaning c-site eye muscle depth.
*P<0.1, **P<0.05, ***P<0.01.
Table 5Lamb intramuscular fat percentage for sex, dam breed, sire type and kill groups within the Muscularis semimembranosus, Muscularis semitendinosus, Muscularis supraspinatus, Muscularis infraspinatus and Muscularis longissimus lumborum (not corrected for hot carcass weight)
M. infraspinatus M. longissimus lumborum M. semimembranosus M. supraspinatus M. semitendinosus
Sex Dam breed Sire type Least squared means ± s.e.
Wether Merino Maternal 3.78 ± 0.13ab 4.33 ± 0.13ab 3.63 ± 0.13a 4.83 ± 0.13ab 4.60 ± 0.13b Wether Merino Merino 3.71 ± 0.15a 3.89 ± 0.15c 3.36 ± 0.15a 4.66 ± 0.15a 3.95 ± 0.15a Female BLM Terminal 4.24 ± 0.23b 4.54 ± 0.23b 3.74 ± 0.23a 5.29 ± 0.23bc 5.54 ± 0.23d Female Merino Terminal 4.02 ± 0.15ab 4.45 ± 0.15b 4.00 ± 0.15b 5.05 ± 0.15abc 4.98 ± 0.15bc
Wether BLM Terminal 4.18 ± 0.16ab 4.45 ± 0.15b 3.62 ± 0.15a 5.31 ± 0.16c 5.12 ± 0.15cd Wether Merino Terminal 3.88 ± 0.14ab 4.15 ± 0.13abc 3.69 ± 0.13a 4.80 ± 0.14a 4.66 ± 0.14bc
Kill group1
167K11 3.18 ± 0.15w 3.59 ± 0.14w 3.39 ± 0.14wx 4.04 ± 0.14w 3.97 ± 0.14w 238K11 3.51 ± 0.12x 4.09 ± 0.12x 3.30 ± 0.12w 4.60 ± 0.12x 4.41 ± 0.12wx 280K11 4.08 ± 0.10y 4.39 ± 0.10x 3.37 ± 0.10w 4.98 ± 0.10y 4.62 ± 0.10x 355K11 4.67 ± 0.11z 4.75 ± 0.11z 4.28 ± 0.11x 5.86 ± 0.11z 5.17 ± 0.11y
BLM=Border Leicester–Merino; K=Katanning.
a,b,c
Values within a column with different superscripts differ significantly atP<0.05.
w,x,y,zValues within a column with different superscripts differ significantly atP<0.05. 1Kill group: average age of lambs at slaughter followed by location and birth year (2011).
carcass weight at scanning accounted for the differences between dam breeds.
Effect of ASBVs
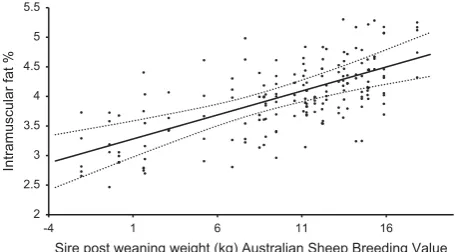
When the sire ASBVs for PWWT, PFAT and PEMD were included at the same time in the base linear mixed effects model, all three demonstrated a significant effect (P<0.1, Table 4). The impact of sire PWWT on IMF% only impacted in lambs born as multiples and raised as a singles (P<0.01, Table 4). In this group of lambs a 1 unit increase in sire PWWT was associated with a 0.08 IMF% increase (Figure 1). The PWWT effect was independent of its impact on HCWT.
The impact of sire PFAT ASBV differed between muscles (P<0.05, Table 4). This effect was non-linear and across a 2.75 unit range (1.0 to −1.75 mm) of decreasing PFAT values, IMF% in theM. semitendinosus and M. semimem-branosus decreased by 0.4 IMF% (Figure 2) and the
M. longissimus lumborum decreased by 0.3 IMF%. There was only one lamb with a sire PFAT value >1.5 mm;
however, when this animal was removed from the analysis, there was no change to the magnitude of the responses. The fore section muscles showed no change in IMF% in response to decreasing sire PFAT.
An impact of increased sire PEMD was observed only in the lambs born as multiples and raised as singles (P<0.05, Table 4). This effect was non-linear and across a 3 unit range of sire PEMD (−1.1 to 2.25 mm), IMF% decreased in single raised lambs by 0.9 IMF% (Figure 3).
The association of the ASBVs with IMF% did not alter when the ASBVs were included individually in the base model. When HCWT was included in the ASBV model, the effects did not change except for the magnitude of the PWWT effect, which was reduced by a quarter.
Including CT lean% and carcass weight in the ASBV sta-tistical model reduced the magnitude of the PEMD and PWWT effects in the lambs born as multiples and raised as singles by 0.2 IMF%. Within the same model, the impact of PFAT was altered, with a decrease in IMF% observed only in theM. semimembranosus(0.1 IMF% across the decreasing 2.75 unit PFAT range). In this model, theM. supraspinatus
and M. infraspinatusincreased in IMF% by 0.4 and 0.2 as PFAT reduced from 1 to−1.75.
Effect of HCWT and LMY%
When HCWT was included in the model as a covariate, heavier carcasses had more IMF%, although this varied between the different muscles and sire types (P<0.01, Table 4). On average, IMF% increased by 0.82 units over a 13 kg HCWT range (15 to 28 kg) across all muscles and sire types, which is equivalent to 0.06 IMF%/kg of HCWT. Most muscles followed this trend, with the outlier to this being the
M. supraspinatusin the Merino sired lambs where IMF went up by 0.27 IMF%/kg of HCWT (Table 6). Excluding the
M. supraspinatus, the Merinos increased at 0.07 IMF%/kg HCWT compared with the Maternal and Terminal sired lambs, which increased on average by 0.04 IMF%/kg HCWT. 2
2.5 3 3.5 4 4.5 5 5.5
-4 1 6 11 16
Intramuscular fat %
Sire post weaning weight (kg) Australian Sheep Breeding Value
Figure 1 The relationship between intramuscular fat percentage in lamb
and sire post-weaning weight (PWWT) Australian Sheep Breeding Value,
for lambs born as multiples and raised as singles.●represents residuals
for each lamb as deviations from the predicted means for intramuscular fat percentage. Line represents least square means (±s.e. as dashed lines) across the PWWT range.
2 2.5 3 3.5 4 4.5 5 5.5
-2 -1.5 -1 -0.5 0 0.5 1 1.5 2
Intramuscular fat %
Sire post weaning c-site fat depth (mm) Australian Sheep Breeding Value
Figure 2 The relationship between intramuscular fat percentage in lamb and sire post-weaning c-site fat depth (PFAT) Australian Sheep Breeding Value,
for theMuscularis semimembranosus.●represents residuals as deviations from the predicted means for intramuscular fat percentage. Line represents least
When comparing muscles, theM. semitendinosusincreased at the greatest rate per unit HCWT (0.07 IMF%/kg HCWT), followed by the M. infraspinatus (0.05 IMF%/kg HCWT),
M. longissimus lumborum (0.04 IMF%/kg HCWT) and
M. semimembranosus(0.04 IMF%/kg HCWT).
When CT lean% was included in the base model along with carcass weight at scanning, it was associated with a decrease in IMF% (P<0.01, Figure 4). On average IMF% decreased by 1.3 units as whole carcass CT lean% increased from 52% to 66% (Figure 4).
Discussion
Recent work by Pannieret al. (2014a) shows IMF% of the
M. longissimus lumborumin Australian lamb to be 4.2 IMF%, aligning well with the results in this study (4.2 ± 0.1). Other Australian work by Warneret al. (2010), showed a mean IMF % of theM. semitendinosusof 3.11 ± 0.3, which is slightly lower than the IMF% in this study (3.6 ± 0.1) but similarly to our study shows IMF% to be lower than theM. longissimus lumborum. Comparisons of IMF% in studies from other
countries are difficult, as lambs are from vastly different genot-ypes, environments and are slaughtered at greatly varying ages, all of which have been shown to impact IMF% (Pannier
et al., 2014a). The variation in the IMF% of thefive muscles examined was not as large as had been observed in other species such as beef (Brackebrush et al., 1991), with the ranking of muscles also being vastly different. Brackebrush
et al. (1991) found the highest IMF% in theM. infraspinatus, followed by theM. longissimus lumborum,M. supraspinatus,
M. semimembranosusandM. semitendinosus.The reasons for the differences in the Brackebrushet al. (1991) study compared with ours is difficult to explain, although the comparison is imperfect, given that the animals were older in the study by Brackebrush et al. (1991), and this may be influenced by variation in the maturation patterns of the individual muscles and therefore IMF%.
In contrast to our hypothesis, the variation in IMF% between muscles was not strictly related to postural v. locomotive muscle function. Variation in IMF% has been shown to relate to species, breed type, gender and muscle
fibre type (Hocquette et al., 2010; Pannier et al., 2014a). Fibre type is related to the function of the muscle, therefore muscle location and function is likely to impact on IMF%. Muscles responsible for maintenance of posture are more oxidative and are predominantly comprised of Type 1fibres with a propensity for higher IMF% (Picard et al., 2002). Within a muscle, more oxidative fibres contain more phos-pholipids and triglycerides, and conversely muscles with high glycolytic activity have lower IMF% (Hocquetteet al., 2010).
On this basis, we expected that the M. longissimus
lumborumwould have the highest IMF% of thefive muscles examined, being a stabiliser muscle, however, this was not observed in our results. Alternatively, theM. supraspinatus
could be considered a postural muscle as it helps to bear body weight and therefore would be expected to have high IMF%. It had greater IMF% than theM. infraspinatus, which can be considered a locomotive muscle as it is used for 2
2.5 3 3.5 4 4.5 5 5.5 6 6.5
-1.25 -0.75 -0.25 0.25 0.75 1.25 1.75 2.25 2.75 3.25
Intramuscular fat %
Sire post weaning eye muscle depth (mm) Australian Sheep Breeding Value
Figure 3 The relationship between intramuscular fat percentage in lamb and sire post-weaning eye muscle depth (PEMD) Australian Sheep Breeding
Value, for lambs born as multiples and raised as singles.●represents residuals as deviations from the predicted means for intramuscular fat percentage.
Line represents least square means (±s.e. as dashed lines) across the PEMD range.
Table 6Coefficients ± s.e. for the Muscularis semimembranosus, Muscularis semitendinosus, Muscularis supraspinatus, Muscularis infraspinatus and Muscularis longissimus lumborum in the model corrected for hot carcass weight
Coefficient ± s.e.
Muscle Maternal Merino Terminal
M. infraspinatus 0.03 ± 0.04 0.10 ± 0.05 0.01 ± 0.03 M. longissimus lumborum 0.03 ± 0.04 0.06 ± 0.05 0.04 ± 0.03 M. semimembranosus 0.04 ± 0.04 0.04 ± 0.05 0.04 ± 0.03 M. supraspinatus 0.06 ± 0.04 0.27 ± 0.05 0.03 ± 0.03 M. semitendinosus 0.07 ± 0.04 0.09 ± 0.05 0.04 ± 0.03
extension andflexion of the shoulder joint in sheep (Suzuki, 1995).
A study examining the metabolic characteristics in sheep classified both the M. supraspinatus and M. infraspinatus
muscles as being more oxidative relative to theM. semimem-branosus,M. semitendinosus and M. longissimus lumborum
(Briand et al., 1981). Based on fibre type and metabolic activity, it is unclear why theM. infraspinatushas less IMF% than the M. semitendinosusand M. longissimus lumborum. TheM. semitendinosusis considered a fast glycolytic muscle (Briandet al., 1981; Gardner et al., 2007; Hocquette et al., 2012), especially in comparison with theM. semimembranosus
andM. longissimus lumborum.Therefore, it would be expected for theM. semitendinosusto have less IMF% than the latter two muscles, which was contrary to ourfindings. Ourfindings indicate that muscle function/fibre type alone cannot be used to predict IMF% of a muscle.
Genetic influence on IMF
In support of our hypothesis, decreasing sire PFAT ASBV decreased IMF%, with the magnitude of this effect varying between muscles. As expected, there was a marked impact in theM. longissimus lumborum, with a 0.3 unit decrease in IMF% over a 2.75 unit range of PFAT. However, there was a marginally greater effect in the M. semimembranosusand
M. semitendinosus, and no effect in the muscles of the fore section. Assuming that this impact is associated with increased muscle hypertrophy (Hocquetteet al., 2010), this aligns well with the hypertrophy effects induced by PFAT, which Andersonet al. (2013) demonstrated were focused on the saddle section of the carcass, with least impact in the fore section. The reduced IMF% in theM. longissimus lumborum
was slightly less than that observed by Pannieret al. (2014a) where IMF% decreased by 0.17%/mm reduction in PFAT; however, the results of Pannieret al. (2014a), in a larger data set, were only evident for the Terminal sired animals.
Contrary to our hypothesis, increasing sire PEMD ASBV had no effect on the IMF% of muscle tissue in the majority of lambs studied in this experiment. The only effect was seen in multiple born lambs raised as singles, where IMF% was
reduced in all of thefive muscles examined. The basis for our PEMD hypothesis was associated with muscle hypertrophy in the saddle section, with previous studies demonstrating that PEMD increased the weight of the loin muscle (Gardneret al., 2010) and increased the proportion of lean in the saddle section (Andersonet al., 2013). However, a recent analysis of the composition data derived from CT scanning of the 400 animals in this study showed that PEMD did not increase lean saddle weight, so the lack of PEMD impact is not unexpected. These results contrast with work by Pannier
et al. (2014a), who demonstrated that increasing PEMD reduced IMF% in theM. longissimus lumborum. However, this effect was only evident in the Terminal sired lambs, and appeared to be driven by a small number of sires that were extremes for this ASBV. Indeed, the lack of impact of PEMD in this analysis may be due to the absence of these extreme sires, which had PEMD values between 4 and 5 mm in the study by Pannieret al. (2014a), contrasting with a maximum of only 3.8 in this study. The marked effect of PEMD on IMF% in the multiple born and single raised lambs is difficult to explain, and has not been previously documented.
As expected, increasing sire PWWT ASBV did not impact on IMF% in the majority of lambs used in this experiment. Previous analyses of this trait have shown no PWWT maturity-linked impact on IMF% (Pannier et al., 2014a). Alternatively, there was a substantial effect of PWWT on IMF % in the multiple born and single raised lambs, increasing it across all muscles. This is the same sub-group of lambs where the PEMD effect was identified, representing only 10% (40 lambs) of the population used in this study, and like the PEMD effect has not been documented previously. Furthermore, in an analysis of a much larger data (n=5642) set, Pannier et al. (2014a) found no such interaction of PWWT with birth or rear type, and therefore more work is required before attributing confidence to this effect.
The results of this study demonstrate the need to carefully manage the potentially negative impact that selecting for reduced sire PFAT has IMF% of the lamb carcass. Alternatively, they also highlight that some monitoring of the hind section muscles may be required, given that the impact 1.5
2.5 3.5 4.5 5.5 6.5 7.5
50 52 54 56 58 60 62 64 66
Intramuscular fat %
Carcass % of lean tissue
Figure 4 The relationship between intramuscular fat percentage in lamb and the percentage of lean in the carcass, as measured by computed
tomography (CT).
°
represents residuals as deviations from the predicted means for intramuscular fat percentage. Line represents least square meansof PFAT was greater in this region of the carcass. PEMD and PWWT largely had no effect, although the unusual result found in the multiple born and single raised lambs may require future investigation.
IMF% differences between sire types and dam breeds
In contrast to our hypothesis, the Maternal sired lambs did not have more IMF% than the Terminal sired lambs. The only differences were for the Merino sired lambs, which had less IMF% than both the Maternal and Terminal sired lambs in theM. semitendinosus, and less IMF% compared with the Terminal sired lambs in theM. longissimus lumborum. These differences in the M. semitendinosus were still present (although slightly diminished) after correcting the model for HCWT, inferring that size/maturity only partly accounts for the sire type differences. These results are in contrast to those of Pannieret al. (2014a) who found no differences in IMF% between sire types in theM. longissimus lumborum, although when compared at the same HCWT, the Merinos had the highest IMF%.
The Border Leicester–Merino dams produced lambs with more IMF% in four muscles, although the effect was not as large as had been previously reported in theM. longissimus lumborum (Hopkins et al., 2007; McPhee et al., 2008; Pannier et al., 2014a). This affect is likely to align with greater whole body adiposity in the Border Leicester–Merino dams, an assertion supported by the inclusion of CT lean%, which accounted for the difference between dam breeds.
In conclusion, the generally lower IMF% levels of Merino sired lambs can only partly be attributed to differences in weight. More importantly, this highlights that IMF% is unlikely to account for the superior eating quality of Merino lambs as demonstrated by Pannieret al. (2014c).
The impact of LMY% and HCWT on IMF
In support of our hypothesis, increasing CT lean% led to a decrease in IMF%, with this effect being consistent across all sire types and muscles. Increasing muscularity is thought to dilute thefinal fat content in muscle (Hocquetteet al., 2010) and therefore reduce IMF%. When CT lean% was included in the ASBV model, the impact of the breeding values on IMF% was reduced, however, still significant, which indicates that CT lean% does not account for all the variation in IMF%. As with previous studies, increasing HCWT was associated with
an increase in IMF% of the M. longissimus lumborum
(McPheeet al., 2008; Pannieret al., 2014a); however, the variation in the association across muscles has not been previously reported in Australian sheep. In particular, the large increase in IMF% in theM. supraspinatusof the Merino sired lambs is a uniquefinding, the reason for which is not currently known. These results, particularly those in response to phenotypic increase in CT lean%, highlight the importance of maintaining IMF% as the lamb industry continues to select for lean growth. Furthermore, this demonstrates that this impact is not restricted to the loin, affecting muscles in both the fore section and hind section of the carcass.
Production and management effects on IMF
The increase in IMF% with each successive kill group is likely to be a reflection of age and weight. The average age in days of these kill groups was 167, 238, 280 and 355, therefore the linear increase in IMF% with age aligns well with the impact of maturity on adiposity as has previously been observed in theM. longissimus lumborum(McPheeet al., 2008; Pannier
et al., 2014a). Nonetheless, other factors that may also have impacted, such as changing nutrition/pasture quality across this period cannot be completely discounted. When corrected for HCWT, the magnitude of the kill group effect was reduced, though still significant, indicating that increasing animal size contributes to IMF%, but that there are likely to be effects of age or maturity that impact beyond their simple correlation with weight. The increase in IMF% present across all muscle types varied in magnitude between muscles, with theM. supraspinatusshowing the greatest increase in IMF% and theM. semimembranosusshowing the least. These dif-ferences are likely to reflect development towards differing IMF% at maturity (i.e. higher in theM. supraspinatus, and lower in theM. semimembranosus), although the possibility of differential maturation rates to the same IMF% at maturity cannot be ignored.
The impact of birthing and rearing types was only evident within the Merino sired lambs. The IMF% of the multiple born and raised lambs was higher than that of the multiple born–single raised and singleton born and raised lambs. This does not appear to be the result of an impact of HCWT as its inclusion in the base model did not alter the magnitude of this effect. One explanation may be associated with maternal nutritional restriction. During the early gestation period in sheep, restriction has been shown to increase the IMF% of theM. longissimus lumborumof offspring at 8 months of age (Zhu et al., 2006). If the IMF% is related to gestational nutritional restriction, it is unclear why the lambs born as multiples and then raised as singletons have low IMF%, though it is possible that the postnatal growth of muscu-lature in the single raised lambs results in a dilution effect on IMF%. Another explanation may be associated with fibre type, as the muscle of multiple raised lambs has been shown to be metabolically more oxidative and less glycolytic than those reared as singletons (Greenwood et al., 2007). Given that oxidative muscle types have been shown to associate positively with IMF% (Hocquette, 2010), this may account for the higher IMF% in this group. It is unclear why the birth–rear type effect was only observed in the Merino sired lambs.
Female lambs had higher IMF% than the wethers, which was consistent across all muscle types. This effect aligns well with the greater whole body fatness of females (Butterfield, 1988) and is further supported in this study through the correction of the model for body composition (CT lean% corrected for carcass weight), which accounted for the difference between sexes. The sex differences in IMF% between females and wethers has previously been demon-strated, however, only in the M. longissimus lumborum
(Craigieet al., 2012; Pannieret al., 2014a).
Conclusion
There are no previously published comparisons of IMF% over a range of carcass regions in Australian lamb, making this study unique. The use of sires with reduced PFAT breeding values results in a decrease in IMF%; however, this effect was greater in the muscles of the hind section, indicating that additional monitoring may be required in these muscles for managing the broader impact of PFAT. The PEMD and PWWT breeding values largely had no impact on IMF%, although their effect identified in the multiple born–single raised lambs may require further investigation. Finally, the marked effect of phenotypic CT lean% across all muscles of the carcass further emphasises the need to manage the potential impact of this selection goal in Australia to main-tain optimum eating quality.
Acknowledgements
The authors would like to thank the Sheep CRC, Meat and Livestock Australia and associated organisations for funding, and data collection support.
References
Anderson F, Williams A, Pethick DW and Gardner G (submitted). The correlation of intramuscular fat content between muscles of the lamb carcass and the use of computed tomography to predict intramuscular fat percentage in lambs. Animal (submitted).
Anderson F, Williams A, Pannier L, Pethick DW and Gardner GE 2013. Australian sheep breeding values increase % carcass lean and redistribute lean tissue to the saddle region. In 59th International Congress of Meat Science and Technology (ed. M Serdaroglu, B Ozturk and T Akcan), pp. 1–4. Ege University, Food Engineering Development, Izmir, Turkey.
Banks RG 2002. Enhancing the value of meat from wool sheep: is there a need for specialisation? International Journal of Wool Technology 50, 584–595. Brackebrush SA, McKeith FK, Carr TR and McLaren DG 1991. Relationship between longissimus composition and the composition of other major muscles of the beef carcass. Journal of Animal Science 69, 631–640.
Briand M, Talmant A, Briand Y, Monin G and Durand R 1981. Metabolic types of muscle in the sheep: I. Myosin ATPase, glycolytic, and mitochondrial enzyme activities. European Journal of Applied Physiology and Occupational Physiology 46, 347–358.
Brown D, Huisman A, Swan A, Graser H, Woolaston R, Ball A, Atkins K and Banks R 2007. Genetic evaluation for the Australian sheep industry. In Proceedings of the Seventeenth Association for Advancement of Animal Breeding and Genetics, 23rd–26th September, 2007, Armidale, NSW, Australia, pp. 187–194.
Butterfield R 1988. New concepts of sheep growth. Griffin Press Ltd, Netley, South Australia, Australia.
Craigie CR, Lambe NR, Richardson RI, Haresign W, Maltin CA, Rehfeldt C, Roehe R, Morris ST and Bunger L 2012. The effect of sex on some carcass and meat quality traits in Texel ewe and ram lambs. Animal Production Science 52, 601–607. Fogarty NM, Banks RG, van de Werf JHJ, Ball AJ and Gibson JP 2007. The information nucleus – a new concept to enhance sheep industry genetic improvement. In Proceedings of the Seventeenth Association for Advancement of Animal Breeding and Genetics, 23–26 September, Armidale, NSW, Australia, pp. 29–32.
Gardner GE, Hopkins DL, Greenwood PL, Cake MA, Boyce MD and Pethick DW 2007. Sheep genotype, age and muscle type affect the expression of metabolic enzyme markers. Australian Journal of Experimental Agriculture 47, 1180–1189.
Gardner GE, Williams A, Siddell J, Ball AJ, Mortimer S, Jacob RH, Pearce KL, Hocking Edwards JE, Rowe JB and Pethick DW 2010. Using Australian Sheep Breeding Values to increase lean meat yield percentage. Animal Production Science 50, 1098–1106.
Greenwood PL, Harden S and Hopkins DL 2007. Myofibre characteristics of ovine longissimus and semitendinosus muscles are influenced by sire breed, gender, rearing type, age and carcass weight. Australian Journal of Experimental Agriculture 47, 1137–1146.
Hall D, Kelf T, Fogarty N and Murray P 2000. Opportunities for meat from lambs and goats in Australia. Asian-Australasian Journal of Animal Sciences 13, 91–92. Harper G and Pethick D 2004. Obesity: does it matter? Asia Pacific Journal of Clinical Nutrition 13, S37.
Hocquette J, Gondret F, Baéza E, Médale F, Jurie C and Pethick D 2010. Intra-muscular fat content in meat-producing animals: development, genetic and nutritional control, and identification of putative markers. Animal 4, 303–319. Hocquette JF 2010. Endocrine and metabolic regulation of muscle growth and body composition in cattle. Animal 4, 1797–1809.
Hocquette J-F, Cassar-Malek I, Jurie C, Bauchart D, Picard B and Renand G 2012. Relationships between muscle growth potential, intramuscular fat content and different indicators of musclefibre types in young Charolais bulls. Animal Science Journal 83, 750–758.
Hopkins D, Hegarty R, Walker P and Pethick D 2006. Relationship between animal age, intramuscular fat, cooking loss, pH, shear force and eating quality of aged meat from sheep. Australian Journal of Experimental Agriculture 46, 879–884. Hopkins DL, Stanley DF, Martin LC, Toohey ES and Gilmour AR 2007. Genotype and age effects on sheep meat production 3. Meat quality. Australian Journal of Experimental Agriculture 47, 1155–1164.
Huisman AE and Brown DJ 2008. Genetic parameters for bodyweight, wool, and disease resistance and reproduction traits in Merino sheep. 2. Genetic rela-tionships between bodyweight traits and other traits. Australian Journal of Experimental Agriculture 48, 1186–1193.
Laville E, Bouix J, Sayd T and Bibé B 2004. Effects of a quantitative trait locus for muscle hypertrophy from Belgian Texel sheep on carcass conformation and muscularity. Journal of Animal Science 82, 3128–3137.
McPhee MJ, Hopkins DL and Pethick DW 2008. Intramuscular fat levels in sheep muscle during growth. Australian Journal of Experimental Agriculture 48, 904–909.
Pannier L, Pethick DW, Geesink GH and Ball AJ 2014a. Intramuscular fat in the longissimus muscle is reduced in lambs from sires selected for leanness. Meat Science 96, 1068–1075.
Pannier L, Pethick DW, Boyce MD, Ball AJ, Jacob RH and Gardner GE 2014b. Associations of genetic and non-genetic factors with concentrations of iron and zinc in the longissimus muscle of lamb. Meat Science 96, 1111–1119. Pannier L, Gardner GE, Pearce KL, McDonagh M, Ball AJ, Jacob RH and Pethick DW 2014c. Associations of sire estimated breeding values and objective meat quality measurements with sensory scores in Australian lamb. Meat Science 96, 1076–1087. Pearce K, van de Ven R, Mudford C, Warner R, Hocking-Edwards J, Jacob R, Pethick D, Hopkins D 2010. Case studies demonstrating the benefits on pH and temperature decline of optimising medium-voltage electrical stimulation of lamb carcasses. Animal Production Science 50, 1107–1114.
Pethick D, Banks R, Hales J and Ross I 2006. Australian prime lamb–a vision for 2020. International Journal of Sheep and Wool Science 54, 194–201. Picard B, Lefaucheur L, Berri C and Duclos MJ 2002. Musclefibre ontogenesis in farm animal species. Reproduction Nutrition Development 42, 415–431. Suzuki A 1995. Differences in distribution of myofiber types between the supras-pinatus and infrassupras-pinatus muscles of sheep. Anatomical Record 242, 483–490. Thompson JM 2004. The effects of marbling onflavour and juiciness scores of cooked beef, after adjusting to a constant tenderness. Australian Journal of Experimental Agriculture 44, 645–652.
Warner RD, Jacob RH, Edwards JEH, McDonagh M, Pearce K, Geesink G, Kearney G, Allingham P, Hopkins DL and Pethick DW 2010. Quality of lamb meat from the Information Nucleus Flock. Animal Production Science 50, 1123–1134.