O R I G I N A L R E S E A R C H
Open Access
Impact of penalizing factor in a
block-sequential regularized expectation
maximization reconstruction algorithm for
18
F-fluorocholine PET-CT regarding image
quality and interpretation
Mimmi Bjöersdorff
1*, Jenny Oddstig
2, Nina Karindotter-Borgendahl
1, Helén Almquist
1, Sophia Zackrisson
3,
David Minarik
2and Elin Trägårdh
1,4* Correspondence:
[email protected] 1Clinical Physiology and Nuclear
Medicine, Skåne University Hospital and Lund University, Malmö, Sweden
Full list of author information is available at the end of the article
Abstract
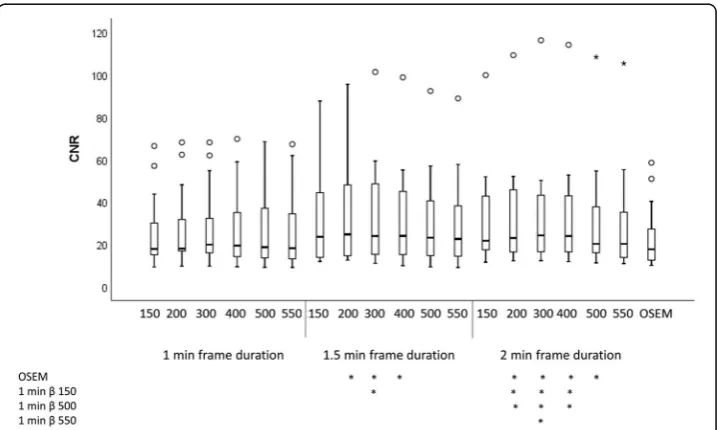
Background:Recently, the block-sequential regularized expectation maximization (BSREM) reconstruction algorithm was commercially introduced (Q.Clear, GE Healthcare, Milwaukee, WI, USA). However, the combination of noise-penalizing factor (β), acquisition time, and administered activity for optimal image quality has not been established for 18F-fluorocholine (FCH). The aim was to compare image quality and diagnostic performance of different reconstruction protocols for patients with prostate cancer being examined with 18F-FCH on a silicon photomultiplier-based PET-CT. Thirteen patients were included, injected with 4 MBq/kg, and images were acquired after 1 h. Images were reconstructed with frame durations of 1.0, 1.5, and 2.0 min using β of 150, 200, 300, 400, 500, and 550. An ordered subset expectation maximization (OSEM) reconstruction with a frame duration of 2.0 min was used for comparison. Images were quantitatively analyzed regarding standardized uptake values (SUV) in metastatic lymph nodes, local background, and muscle to obtain contrast-to-noise ratios (CNR) as well as the noise level in muscle. Images were analyzed regarding image quality and number of metastatic lymph nodes by two nuclear medicine physicians.
Results:The highest median CNR was found for BSREM with aβof 300 and a frame duration of 2.0 min. The OSEM reconstruction had the lowest median CNR. Both the noise level and lesion SUVmax decreased with increasing β. For a frame duration of 1.5 min, the median quality score was highest for β 400-500, and for a frame duration of 2.0 min the score was highest forβ300-500. There was no statistically significant difference in the number of suspected lymph node metastases between the different image series for one of the physicians, and for the other physician the number of lymph nodes differed only for one combination of image series.
Conclusions:To achieve acceptable image quality at 4 MBq/kg18F-FCH, we propose using aβof 400-550 with a frame duration of 1.5 min. The lowerβshould be used if a high CNR is desired and the higher if a low noise level is important.
Keywords:Image quality, Oncology,18F-FCH, Protocol optimization, Q.Clear
Background
Positron emission tomography with computed tomography (PET-CT) is a powerful and widely spread medical imagining technique primarily used in oncology [1,2]. Previous PET-CT scanners were built with scintillation crystals coupled to photomultiplier tubes. Recently, a novel generation of PET-scans, with a silicon photomultiplier-based tech-nology, was introduced, which has the potential to increase detection of pathology, pri-marily through higher sensitivity [3–5]. Concurrently, improved reconstruction methods have been described and one such method is the block-sequential regularization expectation maximization algorithm (BSREM) [6], with the commercial name Q.Clear (GE Healthcare, Milwaukee, WI, USA) [4, 7]. This method was devel-oped to improve the quantitative accuracy [8]. When using conventional iterative re-construction algorithms such as ordered subset expectation maximization (OSEM), the accuracy of the measured standardized uptake values (SUV) of lesions improves when the number of iterations is increased. However, this also increases noise and can limit the detection of small lesions. Stopping the iterative process after a limited number of iterations, in order to reduce noise, leads to an underestimation of SUV in smaller le-sions [7]. The BSREM algorithm allows full convergence while suppressing noise, via a penalty term. This increases the SUV, particularly in small lesions versus conventional reconstruction methods [8], while still maintaining relatively low noise levels. The algo-rithm is based on the following objective function:
Φð Þ ¼x Xiyi∙log P½ xiþbi−½ Pxiþbi−β∙R xð Þ ð1Þ
whereyiis the measured data,Pis the system matrix containing the detection
probabil-ities, bindicates the estimated background events of randoms and scatter, andx is the image estimate.βindicates the global smoothing parameter controlling the overall im-pact of the relative difference penalty term R(x). The BSREM algorithm is used to maximize the objective functionΦ.
The influence of theβfactor has been investigated for18F-fluorodeoxyglucose [9–11] and 18F-fluciclovinell [12], but not for18F-fluorocholine (FCH).18F-FCH has been used for the last 20 years to stage patients with high-risk prostate cancer [13]. The new hardware and software technologies in PET-CT can potentially increase the accuracy and early detection of small lesions such as lymph node metastasis, which is vital in the management of pros-tate cancer [14]. Due to the different uptake mechanisms and pathological conditions, it cannot be expected that the same reconstruction parameters as for18F-fluorodeoxyglucose can be used for18F-FCH. Also, to our knowledge, no study with blinded interpretation of images with different reconstruction parameters for BSREM has been done before.
The aim of this study was to evaluate 18F-FCH images from a novel silicon photomultiplier-based PET-CT (Discovery MI, GE Healthcare, Milwaukee, WI, USA) by assessing the image quality and diagnostic performance of BSREM for different β values as well as for different frame durations per bed position.
Methods
PET-CT-system
coupled to an array of SiPM. The PET-detector has an axial field of view of 20 cm and an overlap of 24%. The sensitivity according to NEMA standards is 13 cps/kBq. The system has a 128-slice CT.
Clinical data
We enrolled 13 patients with biopsy-verified high-risk prostate cancer who were re-ferred for an 18F-FCH PET-CT at Skåne University Hospital, Sweden. The study is regarded as development, and all images were anonymized prior to the analysis. There-fore, no ethical board evaluation was required according to Swedish law. The study complies with the Declaration of Helsinki.
Imaging data
18
F-FCH (4 MBq/kg) was administrated to the patients via a single intravenous injection after a minimum of 4 h fasting. The images were acquired after an accumulation time of 60 min. Images were acquired from the upper thigh to the base of the skull with a frame duration of 2.0 min per bed position. The PET data was obtained and stored in list mode. The images were reconstructed using BSREM including time-of-flight and point spread function with a 256 × 256 matrix (pixel size 2.7 × 2.7 mm2, slice thickness 2.8 mm). Differ-entβvalues (150, 200, 300, 400, 500, and 550) and different frame durations (1.0, 1.5, and 2.0 min) were used. For comparison, an OSEM reconstruction including time-of-flight and point spread function, 4 iterations, 16 subsets, standard z-axis filter and a 6 mm Gaussian post filter, a 256 × 256 matrix with a frame duration of 2.0 min was used. Thus, 19 different image series were obtained from each patient.
A diagnostic CT was performed with tube current modulation applied, adjusting the tube current for each patient, with a noise index of 42.25. A tube voltage of 100 kV was used for body mass index (BMI)≤30, and 120 kV was used for BMI > 30. An adaptive statistical iterative reconstruction technique was used.
Quantitative image analysis
A region of interest (ROI) was drawn over one pathologic pelvic lymph node per pa-tient. The size of the selected lymph nodes was measured in a trans-axial CT slice (short- and long-axis). ROIs were also defined in local background adjacent to the lymph node and in muscle (rectus femoris or vastus lateralis muscles) for noise estima-tion. The Advantage Workstation version 7 (GE Healthcare, Milwaukee, WI, USA) was used to define the ROIs. The same ROIs were used for all 19 image series. The mean, maximum, and standard deviation (SD) SUV in the ROIs were calculated. The contrast-to-noise ratio (CNR) were calculated as follow:
CNR¼SUVmax;lesion−SUVmean in local background
SUVSD muscle background ð
2Þ
COV¼ SUVSD muscle
SUVmean muscle ð
3Þ
Qualitative image analysis
Pilot study
Three patients were randomly selected for visual assessment of image quality. The ex-aminations were graded on a scale from 1 to 5 (1 = unacceptable image quality, 2 = less than acceptable image quality, 3 = acceptable image quality, 4 = high image quality, and 5 = very high image quality). This evaluation was performed by one experienced nuclear medicine physician. The six reconstructions with highest median scores plus the image based on OSEM (for comparison) were chosen for further qualitative evalu-ation described below. This procedure was performed to reduce the number of images evaluated and interpreted.
Assessment of image quality
The seven best image series from the pilot study were evaluated for image quality (scale 1–5, described above). The remaining ten patients were evaluated in a blinded fashion by five nuclear medicine physicians. The physicians were not aware of the reconstruction pa-rameters or which of the ten patients they evaluated, but were provided information re-garding the indication for the examination (staging of high-risk prostate cancer).
Interpretation of images
Two experienced nuclear medicine physician independently interpreted the image series in a random manner as above, by assessing the number of suspected metastases in pelvic lymph nodes.
Statistical analysis
Median CNR, noise level, and SUVmaxwere calculated for a single reconstruction set-ting over all patients. For ranking of CNR, the CNR values for all 19 image series were ranked (1–19; the highest to lowest CNR) for each patient and then the mean rank for all patients was calculated. The Friedman ranking test was used to test for differences in CNR, noise level, and lesion SUVmax as well as the number of metastatic lymph nodes for the different image series. A Wilcoxon signed-rank test was used as the post-hoc test when a statistical significance was found. Differences in image quality for different reconstruction parameters were tested using Kruskal-Wallis test, and post-hoc analysis performed using Mann Whitney U test. Bonferroni corrections for multiple tests were used, and the adjustedpvalues are shown throughout the manuscript. Statis-tical significance was considered for p less than 0.05. Statistical analyses were per-formed using IBM SPSS version 25 (IBM, Armonk, NY, USA).
Results
Patients
(range 3.7–4.3 MBq/kg), and the mean accumulation time was 63 ± 4 min (range 59–70 min).
Quantitative analysis
The lymph nodes selected for the quantitative analysis had a median size of 6 × 9 mm (short- and long-axis, respectively) with a range of 4–21 mm (short-axis) × 6–21 mm (long-axis). Only two lymph nodes exceeded a short axis measurement of 10 mm. The two largest lymph nodes had a center of lower attenuation on CT, but still had a homoge-neous18F-FCH uptake. The other lymph nodes had a homogenous appearance on CT.
The highest median CNR was found with BSREM and a frame duration of 2.0 min withβ300 (Fig.1). The OSEM reconstruction had the lowest median CNR. The rank-ing (Fig. 2) shows that the best CNR for all frame durations was when aβof 300 was used. The reconstruction with a frame duration of 2.0 min andβ300 had a significantly higher CNR than OSEM (p> 0.0001). It had also a significantly higher CNR than image series withβ150, 500, and 550 with a frame duration of 1.0 min (p= 0.05,p= 0.05, and
p= 0.003 respectively). All other CNR comparisons between image series were not sta-tistically significant. Thepvalues for all different series combinations and CNR can be found in Additional file1: Table S1.
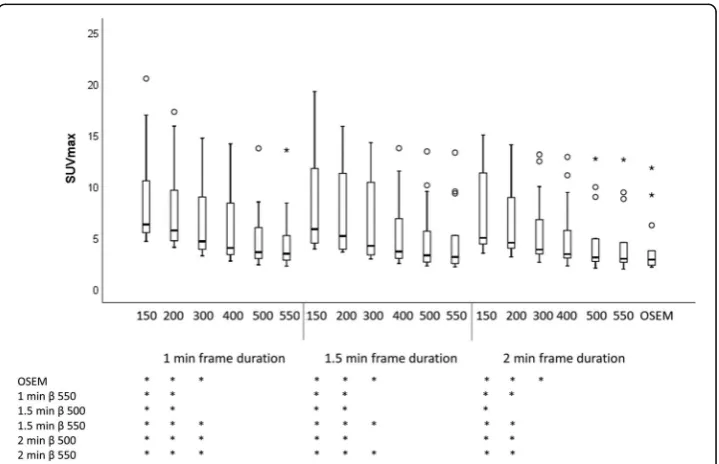
The highest median SUVmaxwas found with a βof 150 and 1.0 min. The lowest me-dian SUVmaxwas found with OSEM (Fig.3). The SUVmaxwas significantly higher forβ 150-200 (all frame durations) compared to OSEM, β 550 with a frame duration of 1.0 min, andβof 500-550 with frame durations of 1.5–2.0 min. Thepvalues for all dif-ferent series combinations and SUVmaxare found in Additional file1: Table S1.
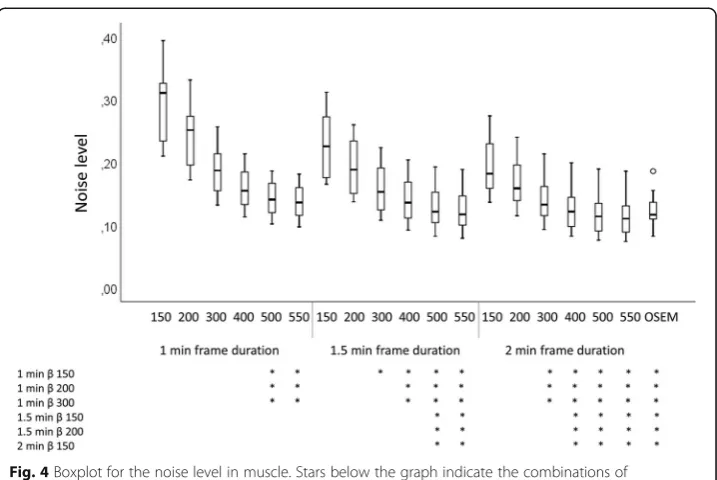
The lowest noise level was found for a βof 550 with frame duration of 2.0 min. The highest was with a βof 150 and frame duration of 1.0 min (Fig.4). The OSEM recon-struction had a similar noise level as β550 and frame duration of 1.5 min and β500 with frame duration of 2.0 min. Thepvalues for all different series combinations and noise level are found in Additional file1: Table S1.
Fig. 2Mean rank of CNR in pathologic lymph nodes. Ranks (1–19 where 1 is the best) were calculated for all patients and then averaged
Fig. 3Boxplot for SUVmaxin pathologic lymph nodes. Stars below the graph indicate the combinations of
Figure5shows a representative example of image quality and different lesion SUVmax values for all series.
Qualitative analysis
Pilot study
The best scores of image quality for the first three patients were the combination of frame durations 1.5 and 2.0 min andβvalues of 300, 400, 500, and 550 as well as OSEM (Table1). BSREM withβ500 and 550 had identical ranking and similar visual appearance; therefore, we proceeded with onlyβ300, 400, and 500 and OSEM in order to reduce the number of images to evaluate. Thus, these seven series were used for further qualitative evaluation.
Fig. 4Boxplot for the noise level in muscle. Stars below the graph indicate the combinations of reconstruction parameters that reached statistical significance
Assessment of image quality
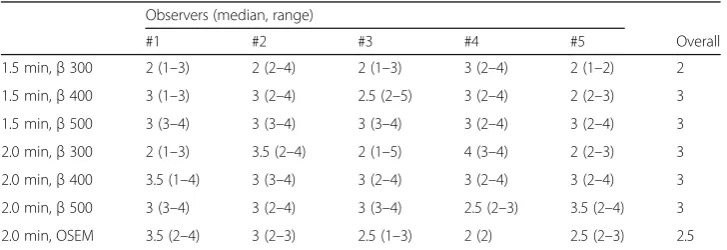
The median quality score was highest (3/5 = acceptable image quality) forβ400-500 with a frame duration of 1.5 min and forβ300-500 with a frame duration of 2.0 min (Table2). The reconstruction with β300 and a frame duration of 1.5 min had significantly lower image quality compared to all other image series except OSEM (p= 0.007 for comparison withβ400 with 1.5 min,p< 0.001 for β500 with 1.5 min,p< 0.001 forβ300-500 with 2.0 min). Also, the OSEM reconstruction had significantly lower image quality compared toβ500 with 1.5 min and (p= 0.005), andβ500 with 2.0 min (p= 0.004), andβ500 with 2.0 min (p= 0.003). No other combinations were found statistically significant.
Table 1Image quality in pilot study
Image quality in pilot study. Image quality in 18F-FCH PET-CT examinations (graded 1–5 where 1 = unacceptable image quality and 5 = very high image quality) for the three patients in the pilot study for all combinations ofβand frame duration as well OSEM. The combinations shown in grey were further evaluated regarding image quality and lymph node metastases
Table 2Assessment of image quality
Observers (median, range)
#1 #2 #3 #4 #5 Overall
1.5 min,β300 2 (1–3) 2 (2–4) 2 (1–3) 3 (2–4) 2 (1–2) 2 1.5 min,β400 3 (1–3) 3 (2–4) 2.5 (2–5) 3 (2–4) 2 (2–3) 3 1.5 min,β500 3 (3–4) 3 (3–4) 3 (3–4) 3 (2–4) 3 (2–4) 3 2.0 min,β300 2 (1–3) 3.5 (2–4) 2 (1–5) 4 (3–4) 2 (2–3) 3 2.0 min,β400 3.5 (1–4) 3 (3–4) 3 (2–4) 3 (2–4) 3 (2–4) 3 2.0 min,β500 3 (3–4) 3 (2–4) 3 (3–4) 2.5 (2–3) 3.5 (2–4) 3 2.0 min, OSEM 3.5 (2–4) 3 (2–3) 2.5 (1–3) 2 (2) 2.5 (2–3) 2.5
Interpretation of images
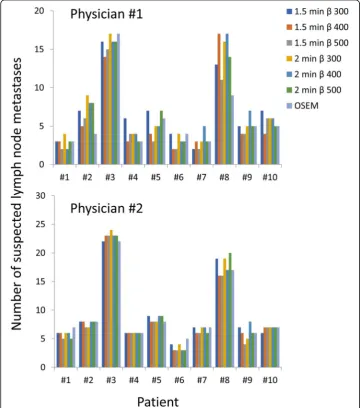
Figure6shows the number of suspected lymph node metastases found for the different image series and patients. For one of the physicians, there was a statistically significant difference of lymph nodes detected betweenβ500 with 1.5 min andβ300 with 2.0 min (p= 0.040). No other combinations were statistically significant. For the other physician, there were no statistically significant differences in the number of suspected lymph nodes between the different series (p= 0.106).
Discussion
The highest CNR was found forβ300 with a frame duration of 2.0 min and the lowest was found for the OSEM reconstruction. The SUVmaxand noise level decreased with increasing β. For a frame duration of 1.5 min, the highest subjective image quality was found using a βof 400-500. For a frame duration of 2 min, the best quality was found
with β 300-500. There were no significant differences in the number of suspected lymph node metastases, except for one combination of image series for one of the phy-sicians, which is probably a random finding.
Regarding the ranking of CNR, there was a “U”-shape for each frame duration in re-lation to theβfactor (Fig.2). To obtain a high CNR, it is important to have both a rela-tively high lesion SUVmax and a relatively low noise level. The low CNR for low β values is due to a high noise level, whereas the low CNR for high βvalues is due to a low lesion SUVmax. The highest median value and best ranking for CNR was found with β300 and frame duration of 2.0 min. The CNR increased with increasing frame duration due to lower noise levels in these images.
SUVmaxdecreases with increasingβ, which corresponds to previous studies [9,11,12]. Noisy images (generally images series with a frame duration of 1.0 min) have a SUVmax that is very noise-dependent. Here, the SUVmaxwas lower for a frame duration of 2.0 min compared to image series with frame durations of 1.0 min and 1.5 min, for the same β value, and this is due to the higher noise levels in the latter. The use of SUVpeakis gener-ally considered less noise dependent but since most of the lesions in this study were smaller than 1 cm3, SUVpeak was not a relevant measure. However, SUVmax in sub-centimeter lesions when using point-spread function reconstructed PET images has been shown to not be reliable due to artifacts [15].
The image series reconstructed with OSEM was used for comparison since it is a well-established reconstruction method. The number of iterations, subsets, and post-filter in the OSEM reconstruction used in this study originate from an initial optimization when the PET-CT system was installed and was not further optimized since that was not the purpose with the study. The OSEM used in this study is designed in accordance with the updated EARL accreditation specifications [16]. If different reconstruction parameters for OSEM are used, different values for CNR, SUVmax, and noise are expected.
The pilot study was conducted to obtain relevant reconstruction parameters and to identify a feasible number of image series for the subsequent qualitative analysis. Analysis of all series combinations would be desirable but was not feasible. The pilot study showed that the median image quality of whole-body18F-FCH was less than acceptable for frame duration of 1 min, regardless ofβ, as well as for 1.5 and 2.0 min withβof 150-200. The definition of good image quality differed between the five observers, due to differences in the preferred or accepted image contrast and noise level. For example, as seen in Table2, physician #4 prefers noisier high contrast images compared to the other physicians. The image quality assessment showed a median quality of 3 (= acceptable image quality) for all image series except OSEM and for β300 with 1.5 min/frame. The relatively low vari-ation in the combinvari-ations of frame durvari-ation andβvalues may have reduced the range of scores for image quality. In order to obtain a median score of high or very high image quality, we expect that the acquisition time needs to be substantially longer.
There was no significant difference in the number of suspected metastatic lymph nodes with different reconstructions or different frame durations, except for one com-bination of image series for one of the physicians, which is probably a random finding. Although only a small number of patients were analyzed, this indicates that all tested image series provide sufficient image quality to interpret the images.
done before for18F-FCH. In patients with prostate cancer, it is important to be able to detect relatively low 18F-FCH uptake in small lymph nodes, which is why optimization of reconstruction parameters for this tracer is important and may not be the same as for other tracers and cancer types. Also, to our knowledge, this is the only study per-forming blinded interpretations of images with different reconstruction parameters for BSREM. This makes it possible to recommend a range of acceptable β, where the clin-ical image interpretation is not affected.
In this study, the patients were administered with 4 MBq/kg and scanned with a frame duration of 1.0, 1.5, and 2.0 min. The activity and frame duration are inter-changeable: 8 MBq/kg with a frame duration of 1.0 min is to a close approximation the same as 4 MBq/kg and 2.0 min/frame. Consider the activity-time (AT), defined as the product of the administered activity per unit body weight and the frame duration (MBq/kg*min), assuming a one hour delay between administration and scan time, then the findings suggest that the image quality is substandard for AT 4 MBq/kg*min re-gardless of β value. It is also not sufficient for AT 6 MBq/kg*min with β of 150-300 and AT 8 MBq/kg*min withβof 150-200. Thus, any of these combinations should not be used. The remaining combinations of AT andβvalues (AT 6 MBq/kg*min withβof 400-550, AT MBq/kg*min 8 withβof 300-550) have reasonably good CNR, noise level, and subjective image quality. The number of suspected lymph node metastases identi-fied does not differ; thus, any of these combinations can be used. However, it seems sufficient to use an AT of 6 MBq/kg*min, which is preferable.
Limitations
The findings should be viewed in light of some limitations. First, only few patients were analyzed. The goal here was to test many reconstructions—more patients would result in a very large number of images to assess, which was not possible. Second, due to the large number of images, only two nuclear medicine physicians were available to inter-pret the images. We did not evaluate the inter-observer variability, since this was not the aim of the study. Inter-observer variability for FCH PET-CT has previously been shown to be moderate for local recurrence in the prostate (Fleiss’kappa 0.55) and to be good for lymph node metastases (Fleiss’kappa 0.89) [19]. Third, in order to minimize the risk of the physicians recognizing the patients when interpreting the images, they performed the image interpretation over several weeks. However, the risk is not com-pletely eliminated. Forth, only three patients were evaluated in the pilot study, and it is possible that the images from these patients are not representative for all 18F-FCH ex-aminations. Fifth, depending on the reconstruction parameters used for OSEM, differ-ent results can be obtained. Therefore, the results of this study cannot be used for comparison between BSREM and OSEM in general.
Conclusion
Additional file
Additional file 1:Table S1.Pvalues from the post-hoc test for the different combinations of image series for CNR, SUVmaxand noise. Those combinations not shown in the table all hadp= 1.000. All shownp-values were
adjusted with the Bonferroni method due to multiple comparisons.Pvalues marked in gray are statistically significant. (DOCX 19 kb)
Abbreviations
AT:Activity-time; BMI: Body mass index; BSREM: Block-sequential regularized expectation maximization algorithm; CNR: Contrast-to-noise ratio; COV: Coefficient of variation; CT: Computed tomography; FCH: Fluorocholine;
OSEM: Ordered subset expectation maximization; PET-CT: Positron emission tomography with computed tomography; ROI: Region of interest; SD: Standard deviation; SUV: Standard uptake values;β: Beta value
Acknowledgements
We thank Ulrika Bitzén and Nicole McMichael for assessing image quality as well as the staff at the Department of Clinical Physiology and Nuclear Medicine for collecting the data. We also thank Anna Åkesson for statistical advice.
Funding
The work was made possible by research grants from the Knut and Alice Wallenberg Foundation, the Swedish Federal Government under ALF agreement, and from Region Skåne. The funders of the study were not involved in the study design, data collection, data interpretation, writing of the report, nor in the decision to submit the paper for publication. The funders have no commercial interests.
Availability of data and materials
The datasets used and analyzed in this study are available from the corresponding author on reasonable request.
Authors’contributions
All authors participated in the design of the study. MB, JO, DM, and ET participated in the data analysis. NKB and HA interpreted the images. MB wrote the manuscript, and the other authors revised the manuscript. All authors read and approved the final manuscript.
Ethics approval and consent to participate
The study is regarded as development and all images were anonymized prior to the analysis. Therefore, no application to the ethical board was required according to Swedish law. The study complies with the Declaration of Helsinki.
Consent for publication
Only anonymized data is published, and therefore no consent was obtained. See paragraph above.
Competing interests
The authors declare that they have no competing interests.
Publisher’s Note
Springer Nature remains neutral with regard to jurisdictional claims in published maps and institutional affiliations.
Author details
1Clinical Physiology and Nuclear Medicine, Skåne University Hospital and Lund University, Malmö, Sweden.2Radiation
Physics, Skåne University Hospital and Lund University, Carl Bertil Laurells gata 9, SE-205 02 Malmö, Sweden.3Medical Radiology, Skåne University Hospital and Lund University, Carl Bertil Laurells gata 9, SE-205 02 Malmö, Sweden.
4
Wallenberg Center for Molecular Medicine, Lund University, Lund, Sweden.
Received: 16 August 2018 Accepted: 5 March 2019
References
1. Bauman G, Belhocine T, Kovacs M, Ward A, Beheshti M, Rachinsky I. 18F-fluorocholine for prostate cancer imaging: a systematic review of the literature. Prostate Cancer Prostatic Dis. 2012;15(1):45–55.
2. Gambhir SS. Molecular imaging of cancer with positron emission tomography. Nat Rev Cancer. 2002;2(9):683–93. 3. Roncali E, Cherry SR. Application of silicon photomultipliers to positron emission tomography. Ann Biomed Eng. 2011;
39(4):1358–77.
4. Hsu DFC, Ilan E, Peterson WT, Uribe J, Lubberink M, Levin CS. Studies of a next-generation silicon-photomultiplier-based time-of-flight PET/CT system. J Nucl Med. 2017;58(9):1511–8.
5. Wagatsuma K, Miwa K, Sakata M, Oda K, Ono H, Kameyama M, et al. Comparison between new-generation SiPM-based and conventional PMT-based TOF-PET/CT. Phys Med. 2017;42:203–10.
6. De Pierro AR, Yamagishi MB. Fast EM-like methods for maximum" a posteriori" estimates in emission tomography. IEEE Trans Med Imaging. 2001;20(4):280–8.
8. Teoh EJ, McGowan DR, Macpherson RE, Bradley KM, Gleeson FV. Phantom and clinical evaluation of the Bayesian penalized likelihood reconstruction algorithm Q.Clear on an LYSO PET/CT system. J Nucl Med. 2015;56(9):1447–52. 9. Sah BR, Stolzmann P, Delso G, Wollenweber SD, Hullner M, Hakami YA, et al. Clinical evaluation of a block sequential
regularized expectation maximization reconstruction algorithm in 18F-FDG PET/CT studies. Nucl Med Commun. 2017; 38(1):57–66.
10. Howard BA, Morgan R, Thorpe MP, Turkington TG, Oldan J, James OG, et al. Comparison of Bayesian penalized likelihood reconstruction versus OS-EM for characterization of small pulmonary nodules in oncologic PET/CT. Ann Nucl Med. 2017;31(8):623–8.
11. Lindstrom E, Sundin A, Trampal C, Lindsjo L, Ilan E, Danfors T, et al. Evaluation of penalized likelihood estimation reconstruction on a digital time-of-flight PET/CT scanner for (18)F-FDG whole-body examinations. J Nucl Med. 2018; 59(7):1152–8.
12. Teoh EJ, McGowan DR, Schuster DM, Tsakok MT, Gleeson FV, Bradley KM. Bayesian penalised likelihood reconstruction (Q.Clear) of (18)F-fluciclovine PET for imaging of recurrent prostate cancer: semi-quantitative and clinical evaluation. Br J Radiol. 2018;91(1085):20170727.
13. Giovacchini G, Giovannini E, Leoncini R, Riondato M, Ciarmiello A. PET and PET/CT with radiolabeled choline in prostate cancer: a critical reappraisal of 20 years of clinical studies. Eur J Nucl Med Mol Imaging. 2017;44(10):1751–76. 14. van der Vos CS, Koopman D, Rijnsdorp S, Arends AJ, Boellaard R, van Dalen JA, et al. Quantification, improvement, and
harmonization of small lesion detection with state-of-the-art PET. Eur J Nucl Med Mol Imaging. 2017;44(Suppl 1):4–16. 15. Munk OL, Tolbod LP, Hansen SB, Bogsrud TV. Point-spread function reconstructed PET images of sub-centimeter lesions
are not quantitative. EJNMMI Phys. 2017;4(1):5.
16. Kaalep A, Sera T, Rijnsdorp S, Yaqub M, Talsma A, Lodge MA, et al. Feasibility of state of the art PET/CT systems performance harmonisation. Eur J Nucl Med Mol Imaging. 2018;45(8):1344–61.
17. Ahn S, Ross SG, Asma E, Miao J, Jin X, Cheng L, et al. Quantitative comparison of OSEM and penalized likelihood image reconstruction using relative difference penalties for clinical PET. Phys Med Biol. 2015;60(15):5733–51.
18. Parvizi N, Franklin JM, McGowan DR, Teoh EJ, Bradley KM, Gleeson FV. Does a novel penalized likelihood reconstruction of 18F-FDG PET-CT improve signal-to-background in colorectal liver metastases? Eur J Radiol. 2015;84(10):1873–8. 19. Pegard C, Gallazzini-Crépin C, Giai J, Dubreuil J, Caoduro C, Desruet M, et al. Study of inter- and intra-observer