oncogenic KIT regulate myeloid cell
transformation via PI3K pathway
Lakshmi Reddy Palam, … , Sophie Paczesny, Reuben Kapur
JCI Insight.
2018;
3(4)
:e94679.
https://doi.org/10.1172/jci.insight.94679
.
Mutations in
KIT
and
TET2
are associated with myeloid malignancies. We show that loss of
TET2-induced PI3K activation and -increased proliferation is rescued by targeting the
p110
a
/
d
subunits of PI3K. RNA-Seq revealed a hyperactive
c-Myc
signature in
Tet2
–/–cells,
which is normalized by inhibiting PI3K signaling. Loss of TET2 impairs the maturation of
myeloid lineage–derived mast cells by dysregulating the expression of
Mitf
and
Cebpa
,
which is restored by low-dose ascorbic acid and 5-azacytidine. Utilizing a mouse model in
which the loss of TET2 precedes the expression of oncogenic
Kit
, similar to the human
disease, results in the development of a non–mast cell lineage neoplasm (AHNMD), which
is responsive to PI3K inhibition. Thus, therapeutic approaches involving hypomethylating
agents, ascorbic acid, and isoform-specific PI3K inhibitors are likely to be useful for treating
patients with
TET2
and
KIT
mutations.
Research Article
Hematology
Find the latest version:
Authorship note: LRP and RSM contributed equally to this work.
Conflict of interest: The authors have declared that no conflict of interest exists.
Submitted: April 21, 2017
Accepted: January 18, 2018
Published: February 22, 2018
Reference information:
JCI Insight. 2018;3(4):e94679. https://doi.org/10.1172/jci. insight.94679.
Loss of epigenetic regulator TET2 and
oncogenic KIT regulate myeloid cell
transformation via PI3K pathway
Lakshmi Reddy Palam,1 Raghuveer Singh Mali,1 Baskar Ramdas,1 Sridhar Nonavinkere Srivatsan,2
Valeria Visconte,3 Ramon V. Tiu,3 Bart Vanhaesebroeck,4 Axel Roers,5 Alexander Gerbaulet,5
Mingjiang Xu,6 Sarath Chandra Janga,2,7 Clifford M. Takemoto,8 Sophie Paczesny,1
and Reuben Kapur1,7,9,10
1Department of Pediatrics, Herman B Wells Center for Pediatric Research, Indiana University School of Medicine,
Indianapolis, Indiana, USA. 2School of Informatics and Computing, Indiana University & Purdue University, Indianapolis,
Indiana, USA. 3Department of Translational Hematology and Oncology Research, Taussig Cancer Institute, Cleveland Clinic,
Cleveland, Ohio, USA. 4University College London Cancer Institute, London, United Kingdom. 5Institute for Immunology,
Dresden, Germany. 6Sylvester Comprehensive Cancer Center, Department of Biochemistry & Molecular Biology, University
of Miami School of Medicine, Miami, Florida, USA. 7Department of Medical and Molecular Genetics, Indiana University
School of Medicine, Indianapolis, Indiana, USA. 8Department of Pediatrics, Johns Hopkins University, Baltimore, Maryland,
USA. 9Department of Biochemistry and Molecular Biology and 10Department of Microbiology and Immunology, Indiana
University School of Medicine, Indianapolis, Indiana, USA.
Introduction
The human disease mastocytosis is considered a myeloproliferative neoplasm (MPN) by WHO (1). This disease is characterized by accumulation of abnormal numbers of mast cells in the skin and var-ious organs. Oncogenic forms of KIT are commonly found in patients with mastocytosis; they result in constitutive autophosphorylation, activation of downstream signaling, and constitutive growth in the absence of its ligand, stem cell factor (SCF) (2–4). The majority (~90%) of mastocytosis patients harbor a particular point mutation in exon 17 (D816V in humans and D814V in mice) of the KIT receptor (2, 5). We and others have shown that expression of D816V or D814V in human or mouse cells, respectively, results in enhanced growth in vitro and transformation in vivo (6–8). A significant degree of clinical heterogeneity exists in mastocytosis patients bearing the oncogenic form of KITD816V mutation. In spite of an abundant presence of KITD816V mutation in all forms of mastocytosis, target-ing KITD816V alone has not been effective (9, 10).
Somatic mutations in ten-eleven-translocation 2 (TET2) have been described in patients with system-ic mastocytosis (SM), myelodysplastsystem-ic syndrome (MDS), and acute myeloid leukemia (AML) (11–13). Interestingly, the mutational frequency of TET2 is highest in SM patients (~30%), in particular in patients who have additional non–mast cell lineage neoplasm (AHNMD) (11). Furthermore, TET2 mutations have been shown to cosegregate with KITD816V mutation in patients with SM, and we have recently demonstrat-ed poor overall survival of SM patients harboring TET2 mutations (14). The major role of TET family members is to oxidize 5-methyl cytosine (5-mC) to 5-hydroxy-mC (5-hmC) (12, 15, 16). TET2 mutations
Mutations in KIT and TET2 are associated with myeloid malignancies. We show that loss of TET2-induced PI3K activation and -increased proliferation is rescued by targeting the p110α/δ subunits of PI3K. RNA-Seq revealed a hyperactive c-Myc signature in Tet2–/– cells, which is normalized by
associated with MPNs have been shown to impair TET2’s catalytic activity and result in reduced 5-hmC levels in patient-derived cells. Thus, TET proteins play an essential role in regulating the epigenetic sta-tus of genes in cells in which they are expressed; however, how TET2 functions in MPNs as well as the mechanisms by which TET2 loss of function cooperates with other mutations, including KIT, to promote malignant transformation is poorly understood.
Treatment strategies and approaches to modulate the effect of loss of TET2-mediated changes in mast cells either alone or in combination with activating KIT mutation have not been investigated in significant detail, although recent studies have begun to shed some light on this (17, 18). Here, we have built and extended on these findings and provide detailed analysis of TET2-deficient mast cells, therapeutic targets, approaches to inhibit, and the potential mechanisms by which loss of TET2 cooperates with activating Kit mutation to enhance the transforming ability of hematopoietic stem and progenitor cells.
Results
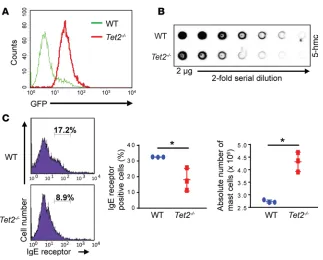
Evaluation of TET2 expression in BM-derived mast cells and analysis of 5-hmC levels. We have previously reported targeted Tet2 reporter mice (19). The targeted alleles result in transcription of nuclear GFP (nGFP) (Tet2: nGFP) mRNA instead of Tet2 (endogenous ATG was disrupted). Heterozygous Tet2: nGFP (Tet2+/–) mice were interbred to obtain homozygous Tet2: nGFP (Tet2–/–) mice. GFP expression in BM cells collected from Tet2: nGFP mice correlates with endogenous TET2 expression (19). We generated BM-derived mast cells (BMMCs) from Tet2: nGFP mice and confirmed the expression of TET2 by flow cytometry (Figure 1A; x axis). Dot blot assays revealed a reduction in the levels of 5-hmC in Tet2–/– BMMCs compared with WT BMMCs (Figure 1B). These data reveal that BMMCs with TET2 deficiency have reduced levels of 5-hmC within their genomic DNA.
In mice, the peritoneal cavity is a large source of mast cells. We therefore quantified mast cells in the peritoneal cavity of WT and Tet2–/– mice. A significant increase in the number of IgE receptor and KIT receptor–positive mast cells was observed in Tet2–/– mice relative to controls (Figure 1C). Although flow cytometry revealed an increase in the total number of IgE receptor–positive mast cells in Tet2–/– mice, they were of an immature phenotype, representing promastocytes similar to those found in fetal blood (20). This was reflected by a decrease in the expression of the high-affinity IgE receptor on Tet2–/– mast cells relative to controls (Figure 1C). No significant changes in other myeloid lineages were observed (data not shown). These results suggest the possibility that constitutive loss of TET2 in BM cells may not only enhance the proliferation of mast cells, but also partially block their maturation. Similar findings have been described in stem cell leukemia–deficient mast cells (21).
Genome-wide transcriptome analysis. In an effort to better understand the role of TET2 in mast cell regulation, we performed RNA-sequencing (RNA-Seq) analysis on BMMCs derived from WT and Tet2–/– mice. Several genes were upregulated in Tet2–/– cells compared with controls (240 genes, P < 0.05, >1.5-fold). Likewise, a much larger pool of genes was downregulated in Tet2–/– cells relative to controls (465 genes, P < 0.05, <–1.5-fold). Expression of genes required for mast cell functions, such as Tpsb2 (mast cell tryptase β 2), Tpsg1 (mast cell tryptase γ 1), Cma1 (mast cell chymase 1), Cpa3 (mast cell carboxypeptidase A), and Mcpt4 (mast cell protease 4), was significantly repressed in Tet2–/– cells compared with WT controls (Figure 2A). Furthermore, expression of genes important for mast cell differentiation/maturation, such as Gata1, Mitf, and Kit, was also reduced in Tet2–/– cells compared with controls. Cebpa expression was higher in Tet2–/– cells relative to controls (Figure 2A). Expression of C/EBPα is associated with basophil maturation and is downregulated as mast cells differentiate (22, 23). Supplemental Table 1 (supplemental material available online with this article; https://doi. org/10.1172/jci.insight.94679DS1) shows the log2-transformed fragments per kilobase per million reads mapped (FPKM) values for the genes shown in the heatmap in Figure 2A.
We next assessed the RNA-Seq data for molecular interaction networks and biological pathways using “cytoscape analysis.” Positively regulated pathway interactions were extrapolated with inclusion of genes that were upregulated (240 genes, P < 0.05, >1.5-fold) in Tet2–/– cells compared with controls. Likewise, negatively regulated pathway interactions were deduced by cytoscape analysis on the pool of genes that were downregulated in Tet2–/– cells relative to controls (465 genes, P < 0.05, <–1.5-fold). Pathway interactions involving cellular response networks, such as inflammatory response, migration, growth, proliferation, and antiapoptosis, were all positively regulated in Tet2–/– cells compared with controls (Supplemental Figure 1A). Among the negatively regulated pathways, the differentiation path-way was most negatively affected as well as genes involved in negative regulation of cell proliferation and phosphorylation (Supplemental Figure 1B). Ingenuity pathway analysis (IPA) of RNA-Seq data revealed that loss of TET2 modulates multiple signaling pathways in mast cells. We found a signifi-cant upregulation in the genes associated with EIF2 signaling, p70SK6 signaling, mTOR signaling, and PI3K signaling, among other pathways (Figure 2B). We also found a significant increase in the expression of c-Myc oncogene in Tet2–/– cells, and IPA analysis suggested c-MYC to be a major signaling molecule activated in Tet2–/– cells with an activation Z score of 5.5 (Figure 2C and Table 1). Importantly, RNA-Seq data analysis revealed that several direct targets of c-MYC were also significantly upregulated as well as repressed in Tet2–/– cells relative to controls (Figure 2D). A significant number of c-MYC– regulated genes are involved in ribosome and ribonucleoprotein biogenesis as well as in RNA binding and metabolic processes. Supplemental Table 2 shows the log2-transformed FPKM values for the genes shown in the heatmap in Figure 2D. Given that c-MYC can control both cell cycle and cell survival, we conducted gene set enrichment analysis (GSEA) for genes involved in regulating cell cycle and apop-tosis. Genes involved in regulating the cell cycle pathway were substantially enriched in Tet2–/– cells compared with controls with a normalized enrichment score (NES) of 5.6 (Figure 2E). Furthermore, apoptosis-promoting genes were negatively enriched in Tet2–/– cells with an enrichment score (NES) of –3.5 (Figure 2E). Taken together, deficiency of TET2 is likely to impair the differentiation of mast cells, resulting in increased proliferation and cell survival.
contrast, during this same period, the maturation of BM cells derived from Tet2+/– and Tet2–/– mice was significantly impaired in a Tet2 gene dosage-dependent manner, with a significant increase in the expression of IgE receptor and KIT receptor single-positive cells and a profound reduction in the presence of KIT/ IgE receptor double-positive cells (Figure 3B). Similar findings were recently reported in a slightly differ-ent model of TET2 deficiency (18). Figure 3C shows cytospins from WT and Tet2–/– cultures. One can observe the presence of immature mast cells lacking characteristic mast cell granules in cultures derived from Tet2–/– mice compared with controls. Consistent with these findings, expression of mast cell–specific genes, including Kit, while showing robust expression in WT BMMCs, showed significant reduction in Tet2–/– cells (Figure 2A and Figure 3D). Further, the expression of c-Myc in Tet2–/– cells was significantly increased rel-ative to controls, thus validating our earlier RNA-Seq observations (Figure 3D). Importantly, loss of TET2 retained high expression of Cebpa relative to controls. Given the enhanced c-Myc expression noted above in Tet2–/– cells, we examined the ability of these cells to proliferate and survive relative to controls. As seen in Figure 3E, an increase in the proliferation of BMMCs was observed relative to controls in a Tet2 gene dosage-dependent manner. Cytokine-independent survival of BMMCs was assessed under conditions of short-term and long-term withdrawal of cytokines. Flow cytometric analysis showed an increase in percent-age cell survival in Tet2–/– cells relative to controls (Figure 3F). Taken together, an early loss of TET2 in mast cell progenitors impairs their survival and proliferation capacity. These results support our in vivo findings in mice (Figure 1C).
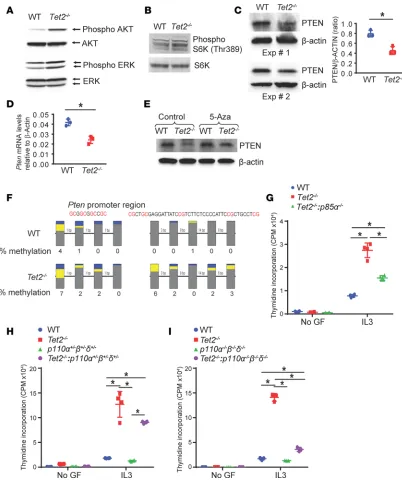
Loss of TET2 in BMMCs results in reduced PTEN expression and hyperactivation of the PI3K/AKT/c-Myc pathway. To understand how c-MYC contributes to the enhanced growth and proliferation of TET2-defi-cient cells, we reexamined our IPA findings and focused on the PI3K/AKT pathway, given that this path-way is dysregulated in TET2-deficient cells (Figure 2B). A link between PI3K/AKT pathpath-way and c-MYC has been described previously (25). PTEN loss–induced activation of PI3K/AKT pathway drives B cell lymphoma transformation by upregulating c-MYC expression (26). In T-ALL, co-occurrence of c-MYC overexpression and PTEN deficiency is commonly seen (27). We found an increase in the activation of AKT as well as ERK/MAPK pathway and an increase in phosphorylated S6 kinase in Tet2–/– cells (Figure 4, A and B). Given the role of PI3K/AKT in regulating the growth of mast cells and the observed hyper-sensitivity of Tet2–/– cells to cytokine stimulation that resembles that of PTEN-deficient mast cells (28), we hypothesized that the increase in AKT activation and growth in Tet2–/– mast cells may in part be due to impaired or reduced expression of PTEN (28). We observed reduced expression of PTEN protein and Pten mRNA in Tet2–/– cells relative to WT controls (Figure 4, C and D). PTEN expression in Tet2–/– cells was rescued to WT levels in the presence of 5-azacytidine, a hypomethylating agent (Figure 4E). The decrease in the expression of PTEN was a result of hypermethylated Pten promoter in Tet2–/– cells (Figure 4F).
PI3Ks are heterodimeric lipid kinases that are composed of regulatory and catalytic subunits. The three catalytic subunits include p110α, p110β, and p110δ. All three catalytic subunits dimerize with the p85 regu-latory subunit. The p85 subunit binds to p110 catalytic subunits, resulting in the conversion of PIP2 to PIP3. PTEN opposes the activation of this pathway by converting PIP3 back to PIP2 (29). To assess the role of the p85 regulatory subunit and the three catalytic subunits of PI3K in cytokine-induced hypersensitivity in
Table 1. List of major signaling molecules predicted to be activated in Tet2–/– mast cells (Ingenuity pathway analysis)
Upstream regulator Molecule type Activation Z score P value of overlap
MYC Transcription regulator 5.483 5.41 × 10–64
TNF Cytokine 2.234 1.03 × 10–53
TGFB1 Growth factor 2.177 1.27 × 10–53
IFNG Cytokine 2.606 4.86 × 10–49
IL4 Cytokine 4.367 6.64 × 10–46
IL1B Cytokine 2.308 1.32 × 10–39
CSF2 Cytokine 2.846 5.24 × 10⁻³²
IL6 Cytokine 2.456 6.72 × 10⁻²⁹
IL13 Cytokine 3.219 8.29 × 10⁻²⁶
TET2-deficient cells, we performed a series of genetic intercrosses to obtain TET2-deficient mice lacking the expression of p85 or heterozygous for all three p110 catalytic subunits or completely devoid all three p110 catalytic subunits of PI3K. BM from these mice was harvested, and mast cells were generated as described above and subjected to thymidine incorporation assay to assess the cell proliferation. Loss of p85α in Tet2–/– cells significantly repressed cytokine-induced proliferation associated with TET2 deficiency (Figure 4G). Likewise, heterozygosity of all three catalytic subunits of p110 also significantly rescued the enhanced cell proliferation seen in Tet2–/– cells (Figure 4H). However, total loss of all three p110 catalytic subunits com-pletely repressed the proliferation noted in TET2-deficient cells to WT levels (Figure 4I).
As shown earlier, whole-transcriptome sequencing data suggest that c-MYC dependent transcriptional regulation is active in Tet2–/– cells. We first assessed the levels of c-MYC protein and c-Myc mRNA in WT and TET2-depleted cells. There was an increase in both protein and mRNA levels in TET2-deficient cells compared with WT cells. Importantly, deletion of p85α in Tet2–/– cells or pharmacologic inhibition of PI3K reduced the level of c-MYC protein and c-Myc mRNA nearly to WT levels (Figure 5, A and B). We next validated downstream direct targets of c-MYC that were shown earlier to be upregulated (Figure 2D and Supplemental Table 2) (30). Enolase 1 (Eno1), a glycolytic gene known to be activated upon c-MYC overexpression (31, 32), was significantly increased in Tet2–/– cells compared with WT controls. Similarly, there was reduced Eno1 expression in cells lacking p85α subunit of class IA PI3K in the background of TET2 deficiency. Likewise, expression of branched chain amino acid transaminase 1 (Bcat1) — a c-MYC target gene that when overexpressed promotes cell proliferation, migration, and invasion (33) — was high in Tet2–/– cells compared with WT cells; however, p85α deletion in the setting of TET2 deficiency corrected Bcat1 mRNA expression to WT levels. Expression of serine hydroxymethyltransferase 1 (Shmt1), a known gene with c-MYC binding sites on its promoter, was significantly upregulated in Tet2–/– cells but normalized to WT levels in the setting of p85α deficiency (34). SHMT1 has a known function in tumor growth and migration. c-MYC is also known to transcriptionally repress the inhibitor of differentiation 2 (ID2) and PTEN-induced putative kinase 1 (PINK1) (35, 36). We discovered that TET2 loss in BMMCs reduces the expression of both Id2 and Pink1 (Figure 2D and Figure 5B). Nucleophosmin (NPM1) is an oncogene frequently associated with blood cell malignancies, such as AML and NOTCH1-driven CLL, that interacts with c-MYC to promote hyperproliferation and transformation (27, 37). c-MYC can directly bind to the NPM1 promoter and transcriptionally upregulate the expression of NPM1 (37). Loss of TET2 results in an increase in the expression of Npm1 compared with controls, which is c-MYC dependent and is rescued to WT levels in the absence of p85α (Figure 5B). We further verified c-MYC functionality in TET2-depleted cells using a shRNA-mediated c-Myc knockdown approach. Tet2–/– cells with c-Myc knockdown showed a 2-fold reduction in cell proliferation when compared with control cells (Figure 5C).
Differential regulation of c-Jun and JunB can modulate c-Myc transcription in an AKT activation– dependent manner (38). Analysis of the c-Myc promoter suggests that JunB competitively binds to AP-1 sites on c-Myc promoter and inhibits its transcription. In contrast, in the absence of JUNB, c-JUN binds to the same AP-1 sites and transcriptionally upregulates c-Myc expression. JUNB collaborates with other AP-1 family members, such as FOS, with higher affinity and inhibits transcription. Thus, JUNB protein levels are likely to be involved in regulating c-Myc expression in Tet2–/– cells. We show by RNA-Seq and QRT-PCR validation a several-fold decrease in JunB and Fos mRNA expression in Tet2–/– cells relative to controls (Fig-ure 5D), which is associated with increased c-MYC expression. Importantly, TET2 loss mediated repres-sion of JunB and Fos expresrepres-sion was reversed in the absence of p85α. Thus, enhanced PI3K activity in TET2-depleted cells regulates c-Myc expression in part by removal of JUNB/FOS-mediated transcriptional inhibition. We validated JUNB-mediated c-Myc repression by overexpressing JunB in Tet2–/– cells. Tet2 –/–-top right quadrant of dot plot. Dot plot for 1 of 3 representative experiments is shown. (B) Flow cytometric quantification of IgE receptor–positive or KIT receptor–positive or IgE receptor and KIT receptor double-positive cells for WT, Tet2+/–, and Tet2–/– genotypes is shown. *P < 0.05, n = 3, mean ± SD. (C) Cytospin images of BMMCs from the indicated genotypes (original magnification, ×400). (D) Tet2, Cebpa, c-Myc, and Kit mRNA levels relative to β-actin mRNA levels in WT and Tet2–/– BMMCs were measured using QRT-PCR. *P < 0.05, n = 3, mean ± SD. (E) BMMCs from WT, Tet2+/–, and Tet2–/– mice were starved of serum/cytokines for 6 hours and cultured in the presence or absence of IL-3 for 48 hours, and cell proliferation was evaluated by [3H] thymidine
JunB-GFP cells showed a significant reduction in c-Myc expression compared with empty vector harboring cells (Figure 5E). Collectively, these results suggest that hyperactivation of the PI3K/c-MYC pathway con-tributes markedly to the enhanced proliferation and survival of TET2-deficient cells.
We next wanted to determine if the mast cell maturation/differentiation defect observed in Tet2–/– cells could also be rescued in the absence of PI3K catalytic subunits. BM cells derived from WT, Tet2–/–,
Figure 4. Deficiency of TET2 in BMMCs results in PI3K activation. (A) AKT (ser473), phosphorylated ERK1/2, and total ERK1/2 levels in WT and Tet2–/– BMMCs. Representative data from 3 independent experiments are shown. (B) Western blots for S6 kinase and phosphor S6 kinase protein levels in WT and Tet2–/– BMMCs are shown. Representative data from 3 independent experiments are shown. (C) Western blots for PTEN and β-actin protein levels in WT and Tet2–/– BMMCs are shown. Data from 2 experiments from a total 3 independent experiments are shown. Quantification of PTEN and β-actin protein band densities is shown. n = 3, mean ± SD, *P < 0.05. (D) Pten mRNA levels in WT and Tet2–/– BMMCs were measured using QRT-PCR. n = 3, *P < 0.05, mean ± SD. (E) WT and Tet2–/– BMMCs were treated with 0.5 μM 5-azacytidine for 24 hours and subjected to Western blot analysis. PTEN and β-actin protein levels are shown. (F) Bisulfite-converted genomic DNA from WT and Tet2–/– BMMCs was used for Pten promoter methylation analysis. Percentage methylation change in GC-rich Pten promoter region is shown. BMMCs from mice with indicated genotypes (G–I) were starved for 6 hours and cultured in the presence or absence of IL-3. After 48 hours, cell proliferation was evaluated by [3H] thymidine incorporation. Counts per minute (CPM) are shown. n = 3, mean ± SD,*P < 0.05. mRNA levels were assessed relative to β-actin
p110α–/–β–/–δ–/–, and compound homozygous Tet2–/–:p110α–/–β–/–δ–/– mice were subjected to mast cell differ-entiation analysis. While WT cells completely differentiated into KIT/IgE receptor double-positive cells by the end of 3 weeks of culture, no rescue in the maturation of Tet2–/– cells was observed at any time point examined under the tested conditions (Supplemental Figure 2). These results suggest that while loss
Figure 5. Deficiency of TET2 in BMMCs induces c-MYC upregulation via PI3K activation. (A) c-MYC protein levels in BMMCs from WT, Tet2–/–, and
Tet2–/–:p85α–/– mice were assessed. A representative experiment from 3 independent experiments is shown. Cell lysates collected from Tet2–/– cells that were treated with or without 0.5 μM GDC-0941 (p110αδ-specific PI3K inhibitor) for 12 hours were subjected to Western blot analysis using an anti–c-MYC antibody. A representative experiment from 3 experiments is shown. (B and D) c-Myc, Eno1, Bcat1, Shmt1, Npm1, Id2, Odc1, Tet2, Fos, and JunB mRNA lev-els in BMMCs from WT, Tet2–/–, and Tet2–/–:p85α–/– mice were measured using QRT-PCR. *P < 0.05, n = 3, mean ± SD. (C) c-Myc mRNA knockdown in Tet2–/– BMMCs was achieved using Myc shRNA. Luciferase shRNA was used as a control. Shown are c-Myc knockdown levels, as assessed by QRT-PCR. These Myc-shRNA– and Luc-shRNA–harboring cells were starved for 6 hours and cultured in the presence or absence of IL-3. After 48 hours, cell proliferation was evaluated by [3H] thymidine incorporation. Counts per minute (CPM) are shown. n = 3, mean ± SD, **P < 0.05. (E) Retroviral JunB-GFP construct was
of TET2-induced hyperproliferation could be rescued by inhibiting the catalytic subunits of PI3K, inhibi-tion of this pathway had little effect on the impaired differentiainhibi-tion associated with TET2 loss.
Given that TET2 regulates global 5-hmC levels and thus may have an effect on the methylation and expression of mast cell–specific transcription factors involved in regulating maturation/differentiation, we treated these cells with a FDA-approved hypomethylating agent, 5-azacytidine. As seen in Figure 6A, treat-ment of Tet2–/– BMMCs with 5-azacytidine (200 nM) completely restored the maturation of these cells to WT levels, as assessed by the acquisition of KIT/IgE receptor double-positive cells. The rescue in the maturation of Tet2–/– BMMCs was associated with renewed expression of Mitf, repression of c-Myc, and increased expression of Kit (Figure 6B). However, the expression of some additional genes, such as Gata2, remained unaltered under these culture conditions.
Recent studies have shown that vitamin C can regulate the activity of TET proteins, including those in mast cells (18, 39, 40). We looked to assess how low-dose vitamin C (25 μg/ml) alone or in combination with low dose 5-azacytidine (100 nM) might affect the maturation of TET2-deficient mast cells. We ratio-nalized that vitamin C treatment of Tet2–/– BMMCs would increase the activity of Tet1 or Tet3, thereby enhancing the conversion of 5-mC to 5-hmC, and that 5-azacytidine would inhibit the activation of DNA methyl transferase (DNMT), thereby generating less 5-mC. As shown in Figure 7, A and B, treatment of Tet2–/– BMMCs with low-dose 5-azacytidine (half the amount used in Figure 6A) alone partially restored the differentiation defect in these cells. Likewise, low-dose vitamin C treatment alone greatly improved the maturation of TET2-deficient BMMCs. In contrast, the combined treatment using low-dose 5-azacytidine and vitamin C had a dramatic effect and completely rescued mast cell maturation, including the correction in hyperproliferation associated with TET2 deficiency (Figure 7, A–C). Figure 7C shows the effect of com-bined treatment of these cells with 5-azacytidine and vitamin C on the proliferation of Tet2–/– BMMCs. Combined treatment with vitamin C and 5-azacytidine resulted in significant changes in the expression of genes normally associated with mast cell maturation (Figure 7D). While the rescue in the expression of
some of the genes associated with mast cell maturation was comparable in Tet2–/– cells that were treated with vitamin C alone or with a combination of vitamin C and 5-azacytidine; combination treatment yielded the most repression in the expression of Cebpa and Pu.1 compared with any other treatment group (Figure 7D).
TET2 mutations are frequent in patients with mastocytosis. In most cases, these mutations are associat-ed with activating KIT (KITD816V) and confer overall poor prognosis. It is, however, unclear how the timing of acquisition of these mutations affects the development of myeloid malignancies, given that the combi-nation of these mutations in patients is most often observed in SM with secondary non–mast cell hemato-logic malignancies. We therefore generated mice heterozygous for the expression of Tet2 (Tet2+/–; to mimic patient conditions), in which the expression of activating KIT (KITD814V) was spatially, temporally, and conditionally regulated. Mx-Cre mice were crossed with the above knockin mice to obtain hematopoietic specific Cre-recombinase expression. Six to eight-week-old knockin mice were intraperitoneally injected with 300 μg of polyI:C 3 times. Mice were analyzed after 12 to 16 weeks after polyI:C injections. As seen in Figure 8A, we observed an aggressive form of MPN characterized by increased frequency of lineage-neg-ative Sca-1+ KIT+ cells in the BM and an increase in the frequency of Gr-1/Mac-1 double-positive myeloid cells in the BM, peripheral blood, and spleen, with associated splenomegaly in compound heterozygous mice relative to controls. BM from these mice and additional controls, including WT and Tet2+/– mice, was
Figure 7. Combination of 5-azacytidine and vitamin C treatment rescues mast cell differentiation and proliferation in TET2-depleted BM cells. (A) BM cells derived from WT and Tet2–/– mice were cultured in the presence or absence of 5-azacytidine (100 nM) or vitamin C (25 μg/ ml) or in the presence of both 5-azacyti-dine (100 nM) and vitamin C (25 μg/ml) for 3 weeks. Cells were harvested and stained with antibodies that recognize KIT and IgE receptor, followed by flow cytometry. The percentage of cells double positive for KIT and IgE receptor is shown in the dot plot. (B) Quantitative assessment of the percentage of cells that are double positive for KIT and IgE receptor in A is shown. n = 3, mean ± SEM, *P < 0.05. (C) BM derived from WT and Tet2–/– mice was cultured in the presence or absence of 5-azacytidine (100 nM) plus vitamin C (25 μg/ml) for 3 weeks. After 3 weeks, these cells were starved for 6 hours and cultured for 48 hours in the presence of IL-3 (10 ng/ml). After 48 hours, proliferation was evaluated by [3H] thymidine incorporation. Counts per
harvested and subjected to mast cell differentiation in vitro. As seen in Figure 8B and consistent with our earlier observation, haploinsufficiency of Tet2 results in reduced mast cell differentiation relative to con-trols. In contrast, Tet2+/–:Kit+/D814V BMMCs demonstrated rapid and enhanced maturation relative to any other group, as indicated by the presence of over 80% KIT/IgE receptor double-positive cells by the end of third week of culture. The increase in the maturation of Tet2+/–:Kit+/D814V BMMCs was associated with a rescue in the expression of Kit and Mitf and with a repression in the expression Cebpa relative to controls (Figure 8C). Not only did these cells show an increase in maturation, when subjected to a thymidine incor-poration assay, a significant increase in the growth of these cells in both IL-3 and SCF culture conditions was also observed (Figure 8D). These results suggest that the Tet2 haploinsufficiency–associated matura-tion defect of mast cells is rescued in the presence of KitD814V mutation. However, KitD814V mutation confers SCF ligand–mediated proliferation to TET2-deficient cells.
Given the cooperation between oncogenic KIT and loss of TET2 and the role of PI3K catalytic sub-units in regulating the proliferation of TET2-deficient mast cells, we next assessed the specific contribution of each of these three p110 catalytic subunits utilizing pharmacologic and genetic approaches. We treated the cells with p110 isoform–specific inhibitors of PI3K, including GDC-0941 (specific for p110α/δ), TGX-221 (specific for p110β), and IC87114 (specific for p110δ). As seen in Figure 9, A and B, a significant reduc-tion in the growth of KitD814V+/–, Tet2+/–, and KitD814V+/–:Tet2+/– bearing cells was observed in the presence of GDC-0941 and IL-3 or SCF but not in cells treated with TGX-221 or IC87114. Similar results were obtained when primary SM patient–derived cells were treated with the same combination of drugs (Fig-ure 9, D–F). To further confirm our pharmacologic findings and to specifically assess the role of all three catalytic subunits of PI3K in KitD814V induced growth, we used a genetic approach in which we generated BMMCs from mice lacking the expression of specific isoforms of p110 and their combinations. These cells were engineered to express KitD814V and subjected to proliferation analysis in the absence of ligand stimu-lation. As seen in Figure 9C and consistent with our pharmacologic findings shown in Figure 9, A, B, and D–F, combined loss of p110α and p110δ subunits of PI3K resulted in the most profound reduction in pro-liferation of KitD814V bearing cells. Taken together, our results show that, in addition to using various combi-nations of 5-azacytidine and vitamin C, combined inhibition of p110α and p110δ subunits of PI3K is likely to be the most effective approach for treating MPN patients bearing activating KIT and TET2 mutations.
Discussion
In the current study, we have identified therapeutic targets for the treatment of MPN involving KIT and TET2 mutations. We show that the hyperproliferation caused by loss of TET2 is significantly related to hyperacti-vation of the PI3K pathway. We also show that activating KIT mutation–induced ligand-independent growth utilizes a similar pathway (Figure 9C). Importantly, we show that cells that express oncogenic KIT and lack TET2 are also dependent on the PI3K pathway for proliferation. Thus, both oncogenic KIT and loss of TET2 induced signals converge on PI3K to regulate proliferation (Figure 10). We show using genetic and phar-macologic approaches that the majority of PI3K-dependent proliferation via these mutations is p110α and p110δ dependent, as cells lacking these genes and isoform-specific inhibitors against these catalytic subunits demonstrate maximum repression in proliferation. Thus, instead of utilizing second- and third-generation TKI inhibitors, such as dasatinib and nilotinib, which show minimal efficacy in mastocytosis patients in vivo, perhaps using isoform-specific inhibitors of PI3K might yield better therapeutic outcomes, at least in patients bearing a combination of oncogene KIT and TET2 mutations (Figure 9E).
Figure 8. TET2 loss in cooperation with oncogenic KIT induced myeloproliferative neoplasm. (A) WT, Tet2+/–, and Tet2+/–:Kit+/D814V mice were intraper-itoneally injected with poly(I:C), and mice were analyzed after 12–16 weeks of treatment. Flow cytometric quantification on BM cells was performed by staining the cells with KIT, Sca-1, and lineage-specific antibodies. The percentage of cells negatively selected for lineage markers, KIT positivity, and Sca-1 positivity (LSK) is shown above inset boxes. Peripheral blood and BM cells were also analyzed by flow cytometry using Mac1, Gr1, and KIT antibodies, and the percentage of cells positive for Mac1 and Gr1 or cells positive for Mac1 and KIT is shown in dot blots. Spleen images of indicated genotypes are shown. Experiments were performed more than 3 times, and data from a representative experiment are shown. (B) BM-derived mast cells (BMMCs) were generat-ed from WT, Tet2+/–, and Tet2+/–:Kit+/D814V mice described in A. Cells were harvested and stained with antibodies that recognize KIT and IgE receptor after the indicated weeks of culture, followed by flow cytometry analysis. The percentage of BMMCs double positive for KIT and IgE receptor expression are shown in dot blots. Representative of 3 independent experiments. (C) BMMCs as cultured in B were harvested, and Tet2, Kit, Cebpa, Mitf, and PU.1 mRNA levels, relative to β-actin mRNA levels, were measured using QRT-PCR. Mean ± SD, * P < 0.05. (D) BMMCs from mice with indicated genotypes were starved for 6 hours and cultured in the presence or absence of IL-3 or SCF. After 48 hours, proliferation was evaluated by [3H] thymidine incorporation. Counts per
Figure 9. PI3K inhibitor treatment decreases proliferation of KIT mutation-bearing mouse primary BM-derived mast cells with TET2 loss and in human SM patient samples. (A) BM-derived mast cells (BMMCs) derived from WT, Tet2+/–, Kit+/D814V, and Tet2+/–:Kit+/D814V mice were starved for 6 hours and cultured in the presence or absence of IL-3 (10 ng/ml) or SCF (30 ng/ml) in combination with increasing doses of GDC-0941 (p110α/δ-specific inhibitor of PI3K). After 48 hours, proliferation was evaluated by [3H] thymidine incorporation. Counts per minute (CPM) are indicated. n = 3, mean ± SD. *P < 0.05 compared with WT cells, **P
< 0.05 compared with untreated Tet2+/– cells, ***P < 0.05 compared with untreated Kit+/D814V cells, ****P < 0.05 compared with untreated Tet2+/–:Kit+/D814V cells, unpaired 2-tailed Student’s t test. (B) WT and Tet2–/– BMMCs were transduced with KitD814V retroviral vector and sorted to homogeneity. These cells were treat-ed with increasing doses of GDC-0941 (p110α/δ-specific), TGX-221 (p110β-specific), or IC87114 (p110δ-specific) inhibitors. After 48 hours, ligand-independent proliferation was evaluated by [3H] thymidine incorporation. CPM are shown. A representative experiment performed in quadruplicate is shown. Similar results
were observed in 3 independent experiments. *P < 0.05 compared with untreated Tet2–/–-KitD814Vcells, **P < 0.05 compared with untreated WT-KitD814Vcells, unpaired 2-tailed Student’s t test. (C) KitD814V encoding retroviral vector was transduced into BMMCs that were deficient in the indicated catalytic subunits of PI3K. Sorted GFP-positive cells were subjected to thymidine incorporation assay in the absence of ligand stimulation. No GF, no growth factor. After 48 hours, proliferation was evaluated by [3H] thymidine incorporation. CPM are shown. Data are from a single experiment performed in triplicates. Mean ± SEM,
The relative balance between the expression of transcription factors MITF and C/EBPα is likely to be essential for the observed defects associated with differentiation and growth seen in TET2-deficient BMMCs. To date, MITF is considered one of the most critical transcription factors for specifying mast cell fate (23, 42–44). MITF promotes a set of mast cell–specific genes, including Kit, while simultaneously repressing a set of basophil-specific genes, such as C/EBPα, while it does not affect T, B, eosinophil, neutrophil, or mac-rophage development (22). Given that both MITF and C/EBPα can silence each other’s transcription in a directly antagonist fashion by binding to each others promoter, thus suppressing its respective promoter activity, this is likely to be the major reason for the correction in the maturation of TET2-deficient BMMCs in the presence of vitamin C and 5-azacytidine reported here. Taken together, our results suggest that TET2 is an upstream regulator of mast cell and basophil lineage commitment, and, in its absence, C/EBPα expression is derepressed, which results in enhanced presence of IgE receptor and Kit single-positive cells that appear to be stuck in an intermediary transition stage between basophils and mast cells. When the ratio of MITF to C/ EBPα expression is modulated by treating these cells with a combination of vitamin C and 5-azacytidine, the balance in the expression of these factors is tipped in the favor of MITF, which favors mast cell differentiation.
Studies have shown that vitamin C functions as a cofactor for Fe (II) 2-oxoglutarate dioxygenase enzymes, such as TET (39). Addition of vitamin C promotes TET activity in cells. This results in a global increase in 5-hmC and DNA demethylation of many gene promoters and upregulation of many genes. Our findings in cells treated with vitamin C are in accordance with these observations and those recently reported in TET2-deficient mast cells and TET2 deficiency–associated leukemic cells (18, 45, 46). We also observed a partial correction in the differentiation of Tet2–/– BMMCs in the presence of vitamin C alone, which was associated with a significant but partial rescue in the expression of several genes associated with mast cell maturation. Importantly, our results reveal that therapeutic efficacy of hypomethylating agents can be enhanced when vitamin C is added at low levels. This cooperative effect is likely the result of both passive DNA demethylation by low-dose 5-azacytidine treatment and active conversion of 5-mC to 5-hmC by TET1 and TET3 in the absence of TET2 in these cells (47). Thus, addition of vitamin C may be an efficient way to enhance the clinical effect of hypomethylating agents for the treatment of MPNs. Recent studies have utilized vitamin C to correct TET2 deficiency in hematopoietic stem and progenitor cells and block myeloid leukemia progression (45) and effect normal stem cell function (46).
Our results in the context of cooperation between oncogenic Kit and TET2 are somewhat in agree-ment with previously reported findings but also distinct (17). We believe our mouse model truly mimics the human disease characterized by the development of AHNMD. The differences in the two studies are likely to be due to the spatial and temporal expression of TET2 and oncogenic Kit. In a previously reported study, both TET2 and oncogenic Kit were activated around the same time by polyI:C administration (17). In contrast, our studies, as in the human disease, in which loss of TET2 is followed by the acquisition of oncogenic Kit mutations, demonstrate the development of AHNMD. This is likely due to constitutive loss of TET2 early on in hematopoietic stem/progenitor cells, which induces key changes in this compartment, which is further amplified by the late-onset acquisition of oncogenic Kit, thus driving the development of AHNMD, similar to the human scenario. In this same model, we also demonstrated that oncogenic Kit expression in the background of TET2 heterozygosity in BMMCs rescues the maturation defect associated with Tet2+/– mast cells, which is associated with complete rescue in the expression of MITF and suppres-sion of C/EBPα. Thus, oncogenic Kit, through its ability to induce MITF expression (48), likely shifts the ratio of MITF to C/EBPα in favor of MITF, which by virtue of its ability to antagonize C/EBPα, may drive mast cell maturation. We have previously shown the importance of MITF in oncogenic KIT-induced growth and survival of mast cells derived from patients (48).
Methods
Mice. Tet2: nGFP mice have been previously described (19). Mice harboring floxed p110α and p110β
alleles and a p110δD910A/D910A knockin allele were provided by Bart Vanhaesebroeck (University College London, London, United Kingdom). Floxed p85α mice have been previously described (49). Floxed p85α–/– mice were crossed with Tet2–/– mice to obtain Tet2–/–:p85α–/– double-knockout mice. Conditional KitD814V knockin mice have been described previously (50). Tet2–/– mice were crossed with KitD814V mice to obtain Tet2+/–:Kit+/D814V mice. Mx-Cre mice were crossed with above conditional knockout or knockin mice to obtain hematopoietic specific Cre-recombinase expression. Six- to eight-week-old conditional knockout or knockin mice were intraperitoneally injected with 300 μg polyI:C 3 times with 48-hour time intervals. Tet2+/–, KitD814V, and Tet2+/–:Kit+/D814V mice were analyzed 12–16 weeks after polyI:C injections. For BMMC generation, mice were euthanized after 4–6 weeks after polyI:C injection.
Cytokines, antibodies, and reagents. Recombinant murine IL-3 and SCF were purchased from Pepro Tech. Allophycocyanin-conjugated KIT antibody (17-1171-83), phycoerythrin-conjugated FcεR1 anti-body (12-5898-82), PE-annexin V antianti-body (556422), and 7-amino actinomycin D (7-AAD) were pur-chased from BD Biosciences. Anti–phospho-AKT (product no. 4060), anti–phospho-ERK (product no. 4370), anti-AKT (product no. 9272), anti-ERK1/2 (product no. 9108), S6Kinase (product no. 2708), phosphor S6Kinase (product no. 9206), and anti-PTEN (product no. 9188) antibodies were purchased from Cell Signaling Technology and anti–β-actin antibody (A5316) was purchased from MilliporeSigma. RetroNectin was purchased from Takara. Iscove’s modified Dulbecco’s medium (IMDM) was purchased from Invitrogen. [3H] Thymidine was purchased from PerkinElmer. 5-Azacytidine and vitamin C were purchased from MilliporeSigma. PI3K inhibitor GDC-0941 was purchased from Selleck Chemicals, TGX-221 and IC87114 were purchased from Calbiochem. Puromycin was purchased from MilliporeSig-ma. ImageJ software that used for protein band densitometry was obtained from the NIH repository (https://imagej.nih.gov/ij/download.html).
Generation of BM-derived mast BMMCs. Low-density BM cells from WT mice and mice with indicated genotypes were cultured in the presence of IL-3 (10 ng/ml) for 3–4 weeks.
infection was performed. 48 hours later, cells were sorted for GFP to homogeneity. shRNA RNA plasmid bearing cells were selected for puromycin resistance.
Analysis of mast cell differentiation, proliferation, and apoptosis. Differentiation progress of mast cells was ana-lyzed by examining the expression of Kit and IgE receptor using flow cytometry as described earlier (51). Prolif-eration and apoptosis were assessed by conducting a thymidine incorporation assay as described previously (51). Analysis of intraperitoneal mast cells. 7 ml sterile PBS was injected intraperitoneally into mice and allowed to equilibrate for 5 minutes. A total of 5 ml peritoneal lavage was retrieved, and total cells were counted after red cell lysis. Cells were stained with antibody specific to high-affinity IgE receptor (FCeR1α receptor) and KIT receptor, followed by flow cytometric analysis.
Methylation analysis. Two micrograms genomic DNA isolated from WT and Tet2–/– BMMCs was used for bisulfite treatment using the EpiTect Bisulfite kit (Qiazen) according to the manufacturer’s instructions. Prim-er sets used to amplify the Pten gene promotPrim-er region wPrim-ere designed using MethPrimPrim-er web tool (52). The PCR fragment for the Pten promoter region was generated using approximately 40 ng bisulfite-modified DNA and the following primers: forward, GGAAGTTGTAGTTATGATGGAAGTTTGAGAGTTG; reverse, AACCTACTTCTCCTCAACAACCAAAAACCTAAC. The resultant PCR fragment was cloned into pCR 2.1 vector using the TA cloning kit (ThermoFisher Scientific) according to the manufacturer’s instructions. 10–15 plasmid clones of WT and Tet2–/– cells were sequenced using McLab DNA sequencing service. BiQ analyzer (53) was used to analyze the percentage methylation on the GC-rich region of Pten promoter.
DNA dot blotting. Levels of 5-hmC in WT and Tet2–/– BMMCs were detected using dot blot as described previously (54). Genomic DNA isolated from WT and Tet2–/– BMMCs was added to denatur-ation buffer (0.4 mM NaOH, 10 mM EDTA) and denatured for 10 minutes at 100°C. Samples were rap-idly chilled for 5 minutes on wet ice, and then 2-fold serial dilutions of DNA were applied to a positively charged nylon membrane under vacuum using a 96-well Dot Blot Hybridization Manifold (Bio-Rad). The membrane was washed twice in 2 × SSC buffer, UV cross-linked, and dried for 1 hour at 70°C. Mem-brane was blocked with 5% nonfat dry milk for 1 hour and was probed with anti–5-hmC antibody (Active Motif) at 4oC overnight. Membrane was washed with TBS-T buffer and incubated with HRP-conjugated anti-mouse secondary antibody (1:5,000 dilution) for 1 hour at room temperature. After washing with TBS-T, membrane was visualized by enhanced chemiluminescence.
5-Azacytidine and vitamin C treatment. WT and Tet2–/– BMMCs were incubated with 5-azacytidine for 24 hours. Cells were collected, and equal amounts of protein lysates were subjected to Western blot analysis using an anti-PTEN antibody or anti–β-actin antibody as indicated. To assess mast cell matu-ration, WT and Tet2–/– BMMCs were cultured in the presence or absence of indicated concentrations of 5-azacytidine and vitamin C.
QRT-PCR analysis. BMMCs collected from indicated genotypes were cultured in the presence of IL-3 (10 ng/ml) and indicated concentrations of 5-azacytidine and vitamin C. RNA was isolated using the Qiagen RNeasy plus mini kit according to manufacturer’s instructions. RNA was quantified using Nanodrop. RNA (4 μg) was used for cDNA preparation using a RNA-to-cDNA reverse transcription kit (Bioline). 2× Sensi-Fast SYBR Green enzyme mix (Bioline) was used for quantitation of mRNA levels by real-time PCR. PCR cycles and signal acquisition were performed using Agilent Mx3000P QPCR System thermal cycler (Agilent Technologies). Primers used for quantitation of mRNA levels are provided in Supplemental Table 3.
gene expression data in R (Edge R) (58) package was used for differential gene expression analysis of RNA-seq expression profiles. StringTie output of genes and their respective FPKM values were converted to data matrix and, thereby, differentially expressed genes were identified. Log2-transformed fold changes in gene expression in Tet2–/– mast cells over WT mast cells were used to perform IPA using IPA software, a web- delivered application (https://www.qiagenbioinformatics.com/products/ingenuity-pathway-analysis/). Only genes that were differentially expressed with a FDR <0.01 were considered for further functional enrichment and GSEA, with a specific emphasis on genes involved in mast cell biology. Heatmap images were visualized using gitools (http://www.gitools.org/).
GSEA. GSEA (59) was performed using the default parameters, except the Enrichment Statistic Classic option was used as the weighted option, using GSEA desktop application (version 2.2.2). All the genes obtained from StringTie analysis with log fold changes and P values from EdgeR were included to construct a rank order by using a scoring metric (60). Eventually, we examined the upregulated or downregulated genes involved in biological processes from the KEGG database (61, 62).
Biological functional enrichment of genes. CluGo (63), the open source plugin in Cytoscape, was used to comprehend and visualize enriched biological themes. Differentially expressed genes with P values of less than 0.05 and FPKM values of greater than 15 were included in the analysis to understand the signifi-cance of expressed transcripts in respective biological processes. Differentially expressed genes with log fold changes greater than 1.5 (for upregulated processes) and less than –1.5 (for downregulated processes) were considered.
Statistics. Statistical differences between 2 groups were determined using the unpaired Student’s t test with a 2-tailed distribution. One-way ANOVA was used in analyses involving multiple comparisons. P < 0.05 was considered significant.
Study approval. All mice were maintained under specific pathogen–free conditions at the Indiana Uni-versity Laboratory Animal Research Center (Indianapolis, Indiana, USA). All animal procedures were conducted in accordance with the Guide for the Care and Use of Laboratory Animals (National Academies Press, 2011) and were approved by the Institutional Animal Care and Use Committees at Indiana Universi-ty School of Medicine. Samples from SM patients were collected after obtaining written informed consent in accordance with the Declaration of Helsinki; sample use was approved by the IRB of the Cleveland Clinic/Case Comprehensive Cancer Center and the IRB of the Indiana University School of Medicine.
Author contributions
LRP conceived, designed, performed, and analyzed experiments and wrote the manuscript. RSM con-ceived, designed, performed, and analyzed experiments. BR performed experiments. SNS analyzed data. VV, RVT, BV, AR, AG, and MX provided reagents. SCJ analyzed data. CMT performed experi-ments. RK conceived, designed and analyzed experiments, and wrote the manuscript. SP conceived and designed experiments.
Acknowledgments
We would like to thank Tracy Winkle for providing administrative support. This work was supported in part by grants from the NIH (R01HL077177; R01HL075816; R01HL081111; R01CA173852) and the Riley Children’s Foundation.
Address correspondence to: Reuben Kapur or Sophie Paczesny, Herman B Wells Center for Pediatric Research, Indiana University School of Medicine, Cancer Research Institute, 1044 West Walnut Street, R4-W168 (R. Kapur) or R4-W425 (S. Paczesny), Indianapolis, Indiana 46202, USA. Phone: 317.274.4658; Email: rkapur@iu.edu (R. Kapur). Phone: 317.278.5487; Email: sophpacz@iu.edu (S. Paczesny).
RVT’s present address is: Early Phase Oncology, Eli Lilly and Company, Indianapolis, Indiana, USA.
RSM’s present address is: Translational Oncology, Genentech Inc., South San Francisco, California, USA.
1. Pardanani A, Tefferi A. Systemic mastocytosis in adults: a review on prognosis and treatment based on 342 Mayo Clinic patients and current literature. Curr Opin Hematol. 2010;17(2):125–132.
mononuclear cells of patients who have mastocytosis with an associated hematologic disorder. Proc Natl Acad Sci USA. 1995;92(23):10560–10564.
3. Valent P, et al. Diagnostic criteria and classification of mastocytosis: a consensus proposal. Leuk Res. 2001;25(7):603–625. 4. Valent P, et al. Mastocytosis: pathology, genetics, and current options for therapy. Leuk Lymphoma. 2005;46(1):35–48. 5. Garcia-Montero AC, et al. KIT mutation in mast cells and other bone marrow hematopoietic cell lineages in systemic mast
cell disorders: a prospective study of the Spanish Network on Mastocytosis (REMA) in a series of 113 patients. Blood. 2006;108(7):2366–2372.
6. Xiang Z, Kreisel F, Cain J, Colson A, Tomasson MH. Neoplasia driven by mutant c-KIT is mediated by intracellular, not plas-ma membrane, receptor signaling. Mol Cell Biol. 2007;27(1):267–282.
7. Munugalavadla V, Sims EC, Borneo J, Chan RJ, Kapur R. Genetic and pharmacologic evidence implicating the p85 alpha, but not p85 beta, regulatory subunit of PI3K and Rac2 GTPase in regulating oncogenic KIT-induced transformation in acute myeloid leukemia and systemic mastocytosis. Blood. 2007;110(5):1612–1620.
8. Munugalavadla V, Sims EC, Chan RJ, Lenz SD, Kapur R. Requirement for p85alpha regulatory subunit of class IA PI3K in myeloproliferative disease driven by an activation loop mutant of KIT. Exp Hematol. 2008;36(3):301–308.
9. Verstovsek S, et al. Activity of AMN107, a novel aminopyrimidine tyrosine kinase inhibitor, against human FIP1L1-PDGFR-al-pha-expressing cells. Leuk Res. 2006;30(12):1499–1505.
10. Verstovsek S, et al. Phase II study of dasatinib in Philadelphia chromosome-negative acute and chronic myeloid diseases, including systemic mastocytosis. Clin Cancer Res. 2008;14(12):3906–3915.
11. Tefferi A, et al. Frequent TET2 mutations in systemic mastocytosis: clinical, KITD816V and FIP1L1-PDGFRA correlates.
Leu-kemia. 2009;23(5):900–904.
12. Ko M, et al. Impaired hydroxylation of 5-methylcytosine in myeloid cancers with mutant TET2. Nature. 2010;468(7325):839–843. 13. Tefferi A. Mutations galore in myeloproliferative neoplasms: would the real Spartacus please stand up? Leukemia.
2011;25(7):1059–1063.
14. Traina F, et al. Single nucleotide polymorphism array lesions, TET2, DNMT3A, ASXL1 and CBL mutations are present in sys-temic mastocytosis. PLoS One. 2012;7(8):e43090.
15. Tahiliani M, et al. Conversion of 5-methylcytosine to 5-hydroxymethylcytosine in mammalian DNA by MLL partner TET1.
Science. 2009;324(5929):930–935.
16. Ito S, et al. Tet proteins can convert 5-methylcytosine to 5-formylcytosine and 5-carboxylcytosine. Science. 2011;333(6047):1300–1303. 17. De Vita S, et al. Loss of function of TET2 cooperates with constitutively active KIT in murine and human models of
mastocy-tosis. PLoS One. 2014;9(5):e96209.
18. Montagner S, et al. TET2 Regulates mast cell differentiation and proliferation through catalytic and non-catalytic activities. Cell
Rep. 2016;15(7):1566–1579.
19. Li Z, et al. Deletion of Tet2 in mice leads to dysregulated hematopoietic stem cells and subsequent development of myeloid malignancies. Blood. 2011;118(17):4509–4518.
20. Rodewald HR, Dessing M, Dvorak AM, Galli SJ. Identification of a committed precursor for the mast cell lineage. Science. 1996;271(5250):818–822.
21. Salmon JM, et al. Aberrant mast-cell differentiation in mice lacking the stem-cell leukemia gene. Blood. 2007;110(10):3573–3581. 22. Kitamura Y, Morii E, Jippo T, Ito A. Regulation of mast cell phenotype by MITF. Int Arch Allergy Immunol. 2002;127(2):106–109. 23. Qi X, et al. Antagonistic regulation by the transcription factors C/EBPα and MITF specifies basophil and mast cell fates.
Immu-nity. 2013;39(1):97–110.
24. Ma P, et al. Balanced interactions between Lyn, the p85alpha regulatory subunit of class I(A) phosphatidylinositol-3-kinase, and SHIP are essential for mast cell growth and maturation. Mol Cell Biol. 2011;31(19):4052–4062.
25. Zhu J, Blenis J, Yuan J. Activation of PI3K/Akt and MAPK pathways regulates Myc-mediated transcription by phosphorylat-ing and promotphosphorylat-ing the degradation of Mad1. Proc Natl Acad Sci USA. 2008;105(18):6584–6589.
26. Pfeifer M, et al. PTEN loss defines a PI3K/AKT pathway-dependent germinal center subtype of diffuse large B-cell lymphoma.
Proc Natl Acad Sci USA. 2013;110(30):12420–12425.
27. Pozzo F, et al. NOTCH1-mutated chronic lymphocytic leukemia cells are characterized by a MYC-related overexpression of nucleophosmin 1 and ribosome-associated components. Leukemia. 2017;31(11):2407–2415.
28. Furumoto Y, et al. PTEN deficiency in mast cells causes a mastocytosis-like proliferative disease that heightens allergic respons-es and vascular permeability. Blood. 2011;118(20):5466–5475.
29. Vanhaesebroeck B, Stephens L, Hawkins P. PI3K signalling: the path to discovery and understanding. Nat Rev Mol Cell Biol. 2012;13(3):195–203.
30. Zeller KI, Jegga AG, Aronow BJ, O’Donnell KA, Dang CV. An integrated database of genes responsive to the Myc oncogenic transcription factor: identification of direct genomic targets. Genome Biol. 2003;4(10):R69.
31. Hsu KW, et al. The activated Notch1 receptor cooperates with alpha-enolase and MBP-1 in modulating c-myc activity. Mol Cell
Biol. 2008;28(15):4829–4842.
32. Sedoris KC, Thomas SD, Miller DM. c-myc promoter binding protein regulates the cellular response to an altered glucose con-centration. Biochemistry. 2007;46(29):8659–8668.
33. Zhou W, et al. Over-expression of BCAT1, a c-Myc target gene, induces cell proliferation, migration and invasion in nasopha-ryngeal carcinoma. Mol Cancer. 2013;12:53.
34. Haggerty TJ, Zeller KI, Osthus RC, Wonsey DR, Dang CV. A strategy for identifying transcription factor binding sites reveals two classes of genomic c-Myc target sites. Proc Natl Acad Sci USA. 2003;100(9):5313–5318.
35. Dadson K, et al. The E3 ligase Mule protects the heart against oxidative stress and mitochondrial dysfunction through Myc-de-pendent inactivation of Pgc-1α and Pink1. Sci Rep. 2017;7:41490.
36. Kurland JF, Tansey WP. Myc-mediated transcriptional repression by recruitment of histone deacetylase. Cancer Res. 2008;68(10):3624–3629.
38. Vartanian R, et al. AP-1 regulates cyclin D1 and c-MYC transcription in an AKT-dependent manner in response to mTOR inhi-bition: role of AIP4/Itch-mediated JUNB degradation. Mol Cancer Res. 2011;9(1):115–130.
39. Blaschke K, et al. Vitamin C induces Tet-dependent DNA demethylation and a blastocyst-like state in ES cells. Nature. 2013;500(7461):222–226.
40. Chung TL, et al. Vitamin C promotes widespread yet specific DNA demethylation of the epigenome in human embryonic stem cells. Stem Cells. 2010;28(10):1848–1855.
41. Bejar R, et al. TET2 mutations predict response to hypomethylating agents in myelodysplastic syndrome patients. Blood. 2014;124(17):2705–2712.
42. Takemoto CM, et al. Mast cell transcriptional networks. Blood Cells Mol Dis. 2008;41(1):82–90.
43. Shahlaee AH, Brandal S, Lee YN, Jie C, Takemoto CM. Distinct and shared transcriptomes are regulated by microphthal-mia-associated transcription factor isoforms in mast cells. J Immunol. 2007;178(1):378–388.
44. Takemoto CM, Yoon YJ, Fisher DE. The identification and functional characterization of a novel mast cell isoform of the microphthalmia-associated transcription factor. J Biol Chem. 2002;277(33):30244–30252.
45. Cimmino L, et al. Restoration of TET2 function blocks aberrant self-renewal and leukemia progression. Cell. 2017;170(6):1079– 1095.e20.
46. Agathocleous M, et al. Ascorbate regulates haematopoietic stem cell function and leukaemogenesis. Nature. 2017;549(7673):476–481.
47. Hore TA, et al. Retinol and ascorbate drive erasure of epigenetic memory and enhance reprogramming to naïve pluripotency by complementary mechanisms. Proc Natl Acad Sci USA. 2016;113(43):12202–12207.
48. Lee YN, et al. KIT signaling regulates MITF expression through miRNAs in normal and malignant mast cell proliferation.
Blood. 2011;117(13):3629–3640.
49. Luo J, et al. Class IA phosphoinositide 3-kinase regulates heart size and physiological cardiac hypertrophy. Mol Cell Biol. 2005;25(21):9491–9502.
50. Gerbaulet A, et al. Mast cell hyperplasia, B-cell malignancy, and intestinal inflammation in mice with conditional expression of a constitutively active kit. Blood. 2011;117(6):2012–2021.
51. Ma P, et al. The PI3K pathway drives the maturation of mast cells via microphthalmia transcription factor. Blood. 2011;118(13):3459–3469.
52. Li LC, Dahiya R. MethPrimer: designing primers for methylation PCRs. Bioinformatics. 2002;18(11):1427–1431. 53. Bock C, Reither S, Mikeska T, Paulsen M, Walter J, Lengauer T. BiQ Analyzer: visualization and quality control for DNA
methylation data from bisulfite sequencing. Bioinformatics. 2005;21(21):4067–4068.
54. Nestor CE, et al. Tissue type is a major modifier of the 5-hydroxymethylcytosine content of human genes. Genome Res. 2012;22(3):467–477.
55. Kim D, Langmead B, Salzberg SL. HISAT: a fast spliced aligner with low memory requirements. Nat Methods. 2015;12(4):357–360. 56. Li H, et al. The Sequence Alignment/Map format and SAMtools. Bioinformatics. 2009;25(16):2078–2079.
57. Pertea M, Pertea GM, Antonescu CM, Chang TC, Mendell JT, Salzberg SL. StringTie enables improved reconstruction of a transcriptome from RNA-seq reads. Nat Biotechnol. 2015;33(3):290–295.
58. Robinson MD, McCarthy DJ, Smyth GK. edgeR: a Bioconductor package for differential expression analysis of digital gene expression data. Bioinformatics. 2010;26(1):139–140.
59. Subramanian A, et al. Gene set enrichment analysis: a knowledge-based approach for interpreting genome-wide expression pro-files. Proc Natl Acad Sci USA. 2005;102(43):15545–15550.
60. Plaisier SB, Taschereau R, Wong JA, Graeber TG. Rank-rank hypergeometric overlap: identification of statistically significant overlap between gene-expression signatures. Nucleic Acids Res. 2010;38(17):e169.
61. Kanehisa M, Sato Y, Kawashima M, Furumichi M, Tanabe M. KEGG as a reference resource for gene and protein annotation.
Nucleic Acids Res. 2016;44(D1):D457–D462.
62. Kanehisa M, Goto S. KEGG: kyoto encyclopedia of genes and genomes. Nucleic Acids Res. 2000;28(1):27–30.