activation in long-standing type 1 diabetes
Julie A. Lovshin, … , Bruce A. Perkins, David Z.I. Cherney
JCI Insight. 2018;
3(1)
:e96968.
https://doi.org/10.1172/jci.insight.96968
.
BACKGROUND.
In type 1 diabetes (T1D), adjuvant treatment with inhibitors of the
renin-angiotensin-aldosterone system (RAAS), which dilate the efferent arteriole, is associated
with prevention of progressive albuminuria and renal dysfunction. Uncertainty still exists as
to why some individuals with long-standing T1D develop diabetic kidney disease (DKD)
while others do not (DKD resistors). We hypothesized that those with DKD would be
distinguished from DKD resistors by the presence of RAAS activation.
METHODS.
Renal and systemic hemodynamic function was measured before and after
exogenous RAAS stimulation by intravenous infusion of angiotensin II (ANGII) in 75
patients with prolonged T1D durations and in equal numbers of nondiabetic controls. The
primary outcome was change in renal vascular resistance (RVR) in response to RAAS
stimulation, a measure of endogenous RAAS activation.
RESULTS.
Those with DKD had less change in RVR following exogenous RAAS
stimulation compared with DKD resistors or controls (19%, 29%, 31%, P = 0.008, DKD vs.
DKD resistors), reflecting exaggerated endogenous renal RAAS activation. All T1D
participants had similar changes in renal efferent arteroilar resistance (9% vs. 13%, P =
0.37) irrespective of DKD status, which reflected less change versus controls (20%, P […]
Clinical Medicine
Endocrinology
Nephrology
Find the latest version:
Authorship note: B.A. Perkins and D.Z.I. Cherney are co–senior authors.
Conflict of interest: J.A. Lovshin has received consulting fees or speaking honorarium or both from Novo Nordisk, Eli Lilly & Co, Merck, and AstraZeneca and grant support from Sanofi and Merck. G. Boulet has received speaker honoraria from Johnson & Johnson. H.A. Keenan has received support from Sanofi. B.A. Perkins has received speaker honoraria from Medtronic, Johnson & Johnson, Roche, GlaxoSmithKline Canada, Novo Nordisk, and Sanofi; has received research grant support from Medtronic and Boehringer Ingelheim; and serves as a consultant for NeuroMetrix. D.Z.I. Cherney has received consulting fees or speaking honoraria or both from Janssen, Boehringer Ingelheim, Eli Lilly & Co, AstraZeneca, Merck, and Sanofi and has received operating funds from Janssen, Boehringer Ingelheim, Eli Lilly & Co, AstraZeneca, and Merck.
Submitted: August 23, 2017 Accepted: November 28, 2017 Published: January 11, 2018 Reference information:
JCI Insight. 2018;3(1):e96968. https:// doi.org/10.1172/jci.insight.96968.
Renin-angiotensin-aldosterone system
activation in long-standing type 1 diabetes
Julie A. Lovshin,1,2 Geneviève Boulet,3 Yuliya Lytvyn,2 Leif E. Lovblom,3 Petter Bjornstad,2,4Mohammed A. Farooqi,3 Vesta Lai,2 Leslie Cham,2 Josephine Tse,2 Andrej Orszag,3 Daniel Scarr,3
Alanna Weisman,1,3 Hillary A. Keenan,5 Michael H. Brent,6 Narinder Paul,7 Vera Bril,8
Bruce A. Perkins,1,3 and David Z.I. Cherney2
1Division of Endocrinology and Metabolism and 2Division of Nephrology, Department of Medicine, University of Toronto, Toronto, Ontario, Canada. 3Lunenfeld-Tanenbaum Research Institute, Mount Sinai Hospital, Toronto, Ontario, Canada. 4Research Division, Barbara Davis Center for Diabetes, Aurora, Colorado, USA. 5Research Division, Joslin Diabetes Center, Boston, Massachusetts, USA. 6Department of Ophthalmology and Vision Sciences, Department of Medicine, University of Toronto, Toronto, Ontario, Canada. 7Joint Department of Medical Imaging, Division of Cardiothoracic Radiology, University Health Network, Toronto, Ontario, Canada. 8Ellen and Martin Prosserman Centre for Neuromuscular Diseases, Krembil Neuroscience Centre, Division of Neurology, Department of Medicine, University Health Network, University of Toronto, Toronto, Ontario, Canada.
Introduction
Diabetic kidney disease (DKD) is the leading cause of end-stage renal disease and dialysis in North Amer-ica (1–3) and is a strong predictor of cardiovascular disease and mortality (4, 5). The cumulative lifetime incidence of DKD in type 1 diabetes (T1D) is approximately 50% (6, 7), which means that a subset of patients with T1D do not develop clinical DKD (6, 7). Renal and systemic hemodynamic mechanisms that protect against DKD in long-standing T1D in some patients (DKD resistors), but not in others (those with DKD), are poorly understood. Although DKD resistors may have better cardiometabolic risk factor profiles, including better glycemic, lipid, and blood pressure control, DKD risk may also be determined by differences in intrarenal hemodynamic function (8, 9). Intrarenal hemodynamic function is strongly
BACKGROUND. In type 1 diabetes (T1D), adjuvant treatment with inhibitors of the renin-angiotensin-aldosterone system (RAAS), which dilate the efferent arteriole, is associated with prevention of progressive albuminuria and renal dysfunction. Uncertainty still exists as to why some individuals with long-standing T1D develop diabetic kidney disease (DKD) while others do not (DKD resistors). We hypothesized that those with DKD would be distinguished from DKD resistors by the presence of RAAS activation.
METHODS. Renal and systemic hemodynamic function was measured before and after exogenous RAAS stimulation by intravenous infusion of angiotensin II (ANGII) in 75 patients with prolonged T1D durations and in equal numbers of nondiabetic controls. The primary outcome was change in renal vascular resistance (RVR) in response to RAAS stimulation, a measure of endogenous RAAS activation.
RESULTS. Those with DKD had less change in RVR following exogenous RAAS stimulation compared with DKD resistors or controls (19%, 29%, 31%, P = 0.008, DKD vs. DKD resistors), reflecting exaggerated endogenous renal RAAS activation. All T1D participants had similar changes in renal efferent arteroilar resistance (9% vs. 13%, P = 0.37) irrespective of DKD status, which reflected less change versus controls (20%, P = 0.03). In contrast, those with DKD exhibited comparatively less change in afferent arteriolar vascular resistance compared with DKD resistors or controls (33%, 48%, 48%, P = 0.031, DKD vs. DKD resistors), indicating higher endogenous RAAS activity.
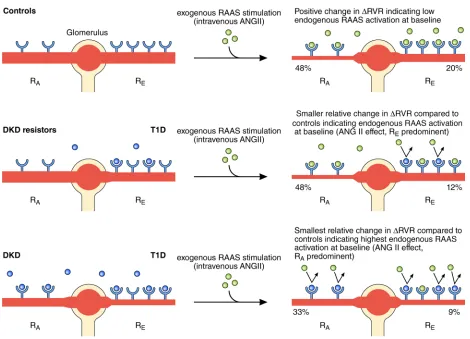
CONCLUSION. In long-standing T1D, the intrarenal RAAS is exaggerated in DKD, which unexpectedly predominates at the afferent rather than the efferent arteriole, stimulating vasoconstriction.
influenced by the renin-angiotensin-aldosterone system (RAAS) (10). Chronic activation of the renal and systemic RAAS, principally by angiotensin II (ANGII1–8), is considered a key factor in the pathogenesis of DKD. Chronic RAAS activation raises intraglomerular pressure locally within the kidney and also initiates tissue injury and stimulates fibrosis, the generation of reactive oxygen species, and proinflammatory effects intrarenally and systemically (11, 12).
Current nephroprotective strategies that emphasize optimal control of multiple risk factors, including hyperglycemia, dyslipidemia, and hypertension, only partially protect against DKD in T1D. RAAS inhibi-tors remain the current standard of care for nephroprotection in DKD. From a hemodynamic perspective, however, these agents exert only partial renal protection through dilation of the efferent arteriole (11, 13). Although beneficial, RAAS inhibitors are not without risk and are associated with acute kidney injury and hyperkalemia, especially in the elderly (13). Moreover, from a physiological perspective, organ-specific measurement of RAAS activation has not been undertaken in older cohorts of patients with long-standing diabetes. Ultimately, RAAS inhibitors are limited as cardiorenal protective therapies since dual RAAS blockade exerts either no benefit or harm (12, 14–16), and agents that have been evaluated as possible add-on therapies to RAAS inhibitiadd-on are largely ineffective (17, 18). In the setting of T1D, primary renal disease prevention with RAAS inhibitors is ineffective, and only a limited number of ongoing trials are examining novel pharmacotherapies to treat DKD in T1D (19). While many reasons may underlie our current inabil-ity to prevent or slow the progression of DKD, it is due in part to our limited understanding of changes in renal physiology that promote DKD. Filling in current knowledge gaps around DKD pathophysiology and identifying factors that distinguish DKD versus DKD resistor status may elucidate the role of potential novel therapeutic targets to prevent or slow DKD progression in T1D.
The primary objective of this study, the Canadian Study of Longevity in Type 1 Diabetes, was to better characterize pathways implicated in the pathophysiology of T1D complications. Specifically, we aimed to identify key determinants of factors that conferred protection against development of DKD in individuals without overt evidence of renal injury (estimated glomerular filtration rate modification of diet in renal dis-ease [eGFRMDRD] ≥60 ml/min/1.73 m2 and 24-hour urine albumin excretion <30 mg/d), despite prolonged
durations of T1D. We determined whether intrarenal hemodynamic responses to exogenous RAAS stimu-lation (intravenous infusion of ANGII), as a measure of baseline endogenous RAAS activation, differed in adults with T1D for ≥50 years, based on the presence or absence of DKD, and compared them with those of healthy age- and sex-matched controls. Secondary objectives were to determine whether systemic hemo-dynamic function, as reflected by changes in blood pressure and arterial stiffness, differed at baseline and in response to exogenous RAAS between participants with prolonged T1D and in controls. We hypothesized that adults with T1D and DKD, but not DKD resistors, would have significantly less change in renal hemody-namic functional parameters in response to exogenous RAAS stimulation, reflecting high endogenous intra-renal RAAS activation at baseline during clamped euglycemia compared with nondiabetic controls. We also hypothesized that exogenous RAAS stimulation would not modify systemic hemodynamic function in those with DKD, reflecting heightened endogenous RAAS activation, compared with DKD resistors and controls.
Results
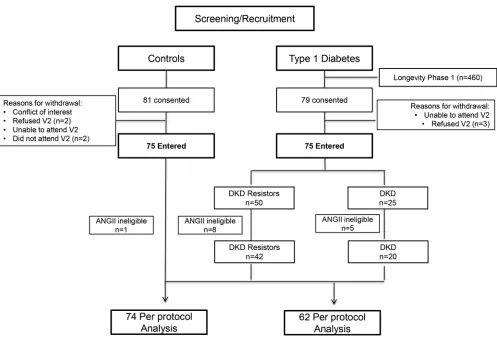
Baseline characteristics. Of the 75 participants with T1D, 50 were DKD resistors and 25 had DKD (Figure
Renal and systemic hemodynamic function at baseline and response to exogenous RAAS stimulation with ANGII. Baseline renal hemodynamic function and systemic hemodynamic parameters (prior to ANGII
infusions) are shown in Table 2. Among the measured variables, the DKD subgroup had the lowest baseline glomerular filtration rate (GFRINSULIN) and effective renal plasma flow (ERPFPAH), compared with DKD resistors and controls. Compared with controls, DKD resistors had similar baseline GFR
INSU-LIN, ERPFPAH, and mean arterial pressure (MAP). Among the calculated variables, compared with the
DKD subgroup, DKD resistors had higher renal blood flow (RBF; P < 0.001), similar glomerular hydro-static pressure (PGLO), lower renal afferent arteriolar resistance (RA, P < 0.001), and lower renal efferent arteriolar resistance (RE, P = 0.02). The filtration fraction (FF) tended to be highest in those with DKD, although this trend did not reach significance compared with DKD resistors (P = 0.055). Compared with controls, DKD resistors had higher PGLO, lower RA, and higher RE. Baseline renal vascular resis-tance (RVR), the variable used in the calculation of the primary study outcome, was similar between controls and DKD resistors but was markedly higher in participants with DKD (11.5 ± 3.9, 11.8 ± 2.5, and 15.4 ± 2.6 mmHg/l/min•100, respectively, P < 0.001).
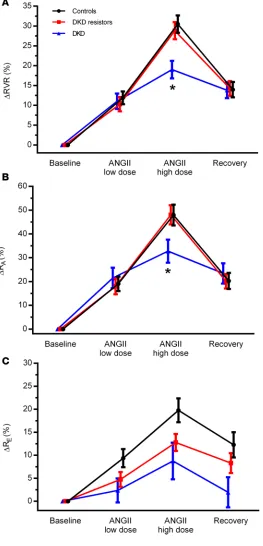
Responses in renal and systemic hemodynamic function due to exogenous RAAS stimulation with low- and high-dose ANGII infusion are summarized in Table 3. The primary study endpoint, the change in RVR in response to exogenous RAAS stimulation (ΔRVR, middle of table), was decreased in those with DKD when compared with DKD resistors (19.0% ± 9.4% vs. 28.8% ± 13.8%, P = 0.008). Notably,
ΔRVR was similar between DKD resistors and controls. This same pattern — high response in controls and DKD resistors and comparatively low response in those with DKD — was observed for ΔRA. In Figure 1. Patient flow diagram. Equal numbers of participants with T1D (n = 75) and age- and sex-matched controls (n = 75) were enrolled in this cross-sectional study. T1D participants were further classified into DKD resistors or DKD subgroups based on the presence of overt renal injury (DKD resistor = eGFRMDRD ≥60 ml/min/1.73 m2 and 24-hour urine albumin excretion <30 mg/d). Some participants were not eligible for exogenous
contrast, though ΔRE was higher in controls, significant differences were not observed between DKD resistors and the DKD subgroup. A trend toward reduced ΔRE was observed across controls, DKD resis-tors, and DKD subgroups (Table 3). The patterns of ΔRVR, ΔRA, and ΔRE are shown in Figure 2, with similar patterns of response in Figure 2, A and B (representing ΔRVR and ΔRA), but a different pattern of response in Figure 2C (representing ΔRE).
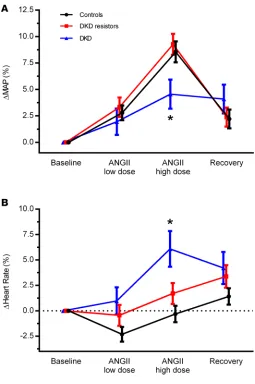
The response of blood pressure to exogenous RAAS stimulation followed a pattern similar to ΔRVR (Figure 3A), represented by ΔMAP. In contrast, heart rate markedly increased in those with DKD but not in DKD resistors or controls (i.e., change was close to 0). This different pattern of response is shown in Figure 3B.
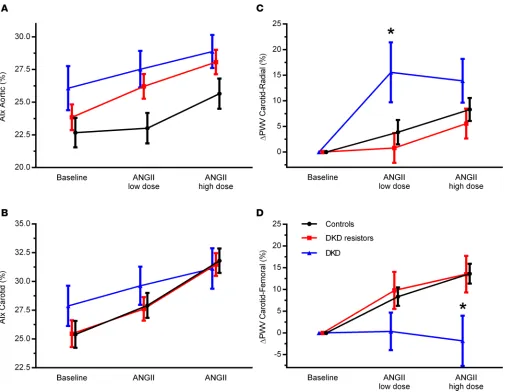
Vascular studies. No statistically significant differences in augmentation index (AIx) were observed
among the groups (Table 4 and Figure 4). At baseline, carotid-radial pulse wave velocity (PWV) and carotid-femoral PWV were lowest in controls (P = 0.026, P < 0.001, respectively, Table 4). Baseline carotid-femoral PWV was higher in those with DKD compared with DKD resistors (P = 0.016). In response to exogenous RAAS stimulation, carotid-radial PWV was significantly increased in the DKD subgroup compared with DKD resistors (Table 5 and Figure 4). In contrast, in response to RAAS stim-ulation, carotid-femoral PWV was significantly decreased in those with DKD compared with DKD resistors and controls (Table 5 and Figure 4).
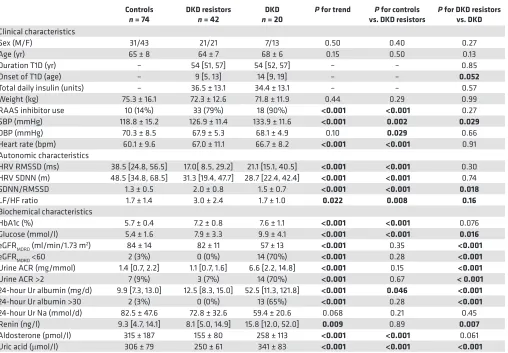
Table 1. Clinical and biochemical characteristics of the study participants
Controls
n = 74 DKD resistors n = 42 nDKD = 20 P for trend vs. DKD resistorsP for controls P for DKD resistors vs. DKD
Clinical characteristics
Sex (M/F) 31/43 21/21 7/13 0.50 0.40 0.27 Age (yr) 65 ± 8 64 ± 7 68 ± 6 0.15 0.50 0.13 Duration T1D (yr) – 54 [51, 57] 54 [52, 57] – – 0.85 Onset of T1D (age) – 9 [5, 13] 14 [9, 19] – – 0.052
Total daily insulin (units) – 36.5 ± 13.1 34.4 ± 13.1 – – 0.57 Weight (kg) 75.3 ± 16.1 72.3 ± 12.6 71.8 ± 11.9 0.44 0.29 0.99 RAAS inhibitor use 10 (14%) 33 (79%) 18 (90%) <0.001 <0.001 0.27 SBP (mmHg) 118.8 ± 15.2 126.9 ± 11.4 133.9 ± 11.6 <0.001 0.002 0.029
DBP (mmHg) 70.3 ± 8.5 67.9 ± 5.3 68.1 ± 4.9 0.10 0.029 0.66 Heart rate (bpm) 60.1 ± 9.6 67.0 ± 11.1 66.7 ± 8.2 <0.001 <0.001 0.91 Autonomic characteristics
HRV RMSSD (ms) 38.5 [24.8, 56.5] 17.0[ 8.5, 29.2] 21.1 [15.1, 40.5] <0.001 <0.001 0.30 HRV SDNN (m) 48.5 [34.8, 68.5] 31.3 [19.4, 47.7] 28.7 [22.4, 42.4] <0.001 <0.001 0.74 SDNN/RMSSD 1.3 ± 0.5 2.0 ± 0.8 1.5 ± 0.7 <0.001 <0.001 0.018
LF/HF ratio 1.7 ± 1.4 3.0 ± 2.4 1.7 ± 1.0 0.022 0.008 0.16
Biochemical characteristics
HbA1c (%) 5.7 ± 0.4 7.2 ± 0.8 7.6 ± 1.1 <0.001 <0.001 0.076 Glucose (mmol/l) 5.4 ± 1.6 7.9 ± 3.3 9.9 ± 4.1 <0.001 <0.001 0.016
eGFRMDRD (ml/min/1.73 m2) 84 ± 14 82 ± 11 57 ± 13 <0.001 0.35 <0.001
eGFRMDRD <60 2 (3%) 0 (0%) 14 (70%) <0.001 0.28 <0.001
Urine ACR (mg/mmol) 1.4 [0.7, 2.2] 1.1 [0.7, 1.6] 6.6 [2.2, 14.8] <0.001 0.15 <0.001
Urine ACR >2 7 (9%) 3 (7%) 14 (70%) <0.001 0.67 < 0.001
24-hour Ur albumin (mg/d) 9.9 [7.3, 13.0] 12.5 [8.3, 15.0] 52.5 [11.3, 121.8] <0.001 0.046 <0.001
24-hour Ur albumin >30 2 (3%) 0 (0%) 13 (65%) <0.001 0.28 <0.001
24-hour Ur Na (mmol/d) 82.5 ± 47.6 72.8 ± 32.6 59.4 ± 20.6 0.068 0.21 0.45 Renin (ng/l) 9.3 [4.7, 14.1] 8.1 [5.0, 14.9] 15.8 [12.0, 52.0] 0.009 0.89 0.007
Aldosterone (pmol/l) 315 ± 187 155 ± 80 258 ± 113 <0.001 <0.001 0.061 Uric acid (μmol/l) 306 ± 79 250 ± 61 341 ± 83 <0.001 <0.001 <0.001
Autonomic dysfunction. Compared with participants with T1D (both DKD and DKD resistors subgroups),
controls had significantly greater heart rate variability (HRV, Table 1). There were no significant differences observed in root mean square of successive difference (RMSSD) or standard deviation of normal-to-normal intervals (SDNN) between those with DKD or DKD resistors. The ratio of SDNN to RMSSD (SDNN/ RMSSD) as a surrogate for sympathetic/parasympathetic activity was significantly greater in DKD resistors (2.0 ± 0.8) compared with controls (1.3 ± 0.5, P < 0.001) and the DKD subgroup (1.5 ± 0.7, P < 0.001), suggesting greater sympathetic activity in DKD resistors. A similar pattern was observed for the ratio of low-power to high-power frequencies of R to R intervals (LF/HF ratio), though values for DKD and DKD resistors were similar. HRV was associated with ΔRVR in response to low-dose ANGII (RMSSD: r = 0.41,
P = 0.009; SDNN: r = 0.31, P = 0.051; LF/HF ratio: r = –0.40, P = 0.012) and high-dose ANGII
(RMS-SD: r = 0.36, P = 0.01; LF/HF ratio: –0.48, P = 0.002) in DKD resistors, but significant relationships were not observed in the DKD subgroup (Supplemental Table 1; supplemental material available online with this article; https://doi.org/10.1172/jci.insight.96968DS1). Furthermore, SDNN/RMSSD was negatively asso-ciated with ΔRVR in response to low-dose ANGII (r = –0.40, P = 0.010) and high-dose ANGII (r = –0.40, P = 0.012) in DKD resistors, but significant relationships were not observed in those with DKD (Supplemental Table 1). RMSSD was positively associated with ΔSBP in response to low-dose ANGII (r = 0.47, P = 0.035) but not high-dose ANGII (Supplemental Table 1) in the DKD subgroup but not DKD resistors. SDNN/ RMSSD was not significantly associated with ΔSBP in response to low-dose ANGII or high-dose ANGII (Supplemental Table 1) in either T1D subgroup.
Discussion
Activation of the intrinsic RAAS is physiologically important in humans for regulating arterial blood pressure and for maintaining sodium and electrolyte hemostasis. In the setting of chronic hyperglycemia, overactivation of the RAAS is strongly implicated in the initiation and progression of DKD (10, 20–24). Organ-specific measurement of RAAS activation, however, has not been previously characterized in cohorts with long-standing T1D within defined subgroups of those with and without DKD (10).
In experimental work, animals with T1D and hyperfiltration exhibit a decrease in RA, possibly on the basis of changes in tubuloglomerular feedback, with overall similar levels of RE, depending on the amount of dietary protein intake (25). In young patients with T1D and hyperfiltration and in patients with type 2 diabetes (T2D), abnormalities in both RA and RE have been reported (20, 26). Less, however, is known about the effect of exogenous ANGII on renal segmental resistance changes in humans, which may depend on a variety of clinical factors, including age (27) and weight (28). In this set of mechanistic studies, our first major observation was that, in adults with T1D, DKD resistors had similar responses in RVR to RAAS
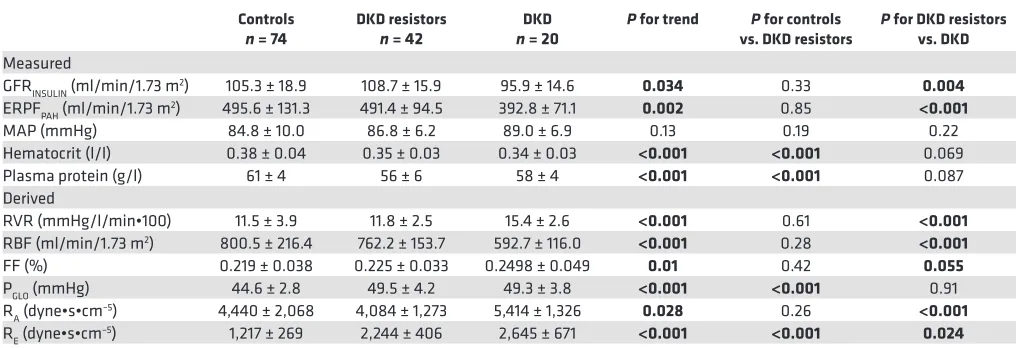
Table 2. Renal hemodynamic function and systemic hemodynamic measurements at baseline
Controls
n = 74 DKD resistors n = 42 n = 20DKD P for trend vs. DKD resistorsP for controls P for DKD resistors vs. DKD
Measured
GFRINSULIN (ml/min/1.73 m2) 105.3 ± 18.9 108.7 ± 15.9 95.9 ± 14.6 0.034 0.33 0.004
ERPFPAH (ml/min/1.73 m2) 495.6 ± 131.3 491.4 ± 94.5 392.8 ± 71.1 0.002 0.85 <0.001
MAP (mmHg) 84.8 ± 10.0 86.8 ± 6.2 89.0 ± 6.9 0.13 0.19 0.22 Hematocrit (l/l) 0.38 ± 0.04 0.35 ± 0.03 0.34 ± 0.03 <0.001 <0.001 0.069 Plasma protein (g/l) 61 ± 4 56 ± 6 58 ± 4 <0.001 <0.001 0.087 Derived
RVR (mmHg/l/min•100) 11.5 ± 3.9 11.8 ± 2.5 15.4 ± 2.6 <0.001 0.61 <0.001
RBF (ml/min/1.73 m2) 800.5 ± 216.4 762.2 ± 153.7 592.7 ± 116.0 <0.001 0.28 <0.001
FF (%) 0.219 ± 0.038 0.225 ± 0.033 0.2498 ± 0.049 0.01 0.42 0.055
PGLO (mmHg) 44.6 ± 2.8 49.5 ± 4.2 49.3 ± 3.8 <0.001 <0.001 0.91 RA (dyne•s•cm–5) 4,440 ± 2,068 4,084 ± 1,273 5,414 ± 1,326 0.028 0.26 <0.001
RE (dyne•s•cm–5) 1,217 ± 269 2,244 ± 406 2,645 ± 671 <0.001 <0.001 0.024
Data expressed as mean ± SD. Significant values are shown in bold (P < 0.05). DKD, diabetic kidney disease; ERPFPAH, effective renal plasma flow
para-aminohippuric acid; FF, filtration fraction; GFRINSULIN, glomerular filtration rateINSULIN; MAP, mean arterial pressure; PGLO, glomerular hydrostatic pressure; RA, renal
stimulation compared with age- and sex-matched controls without diabetes, suggesting that these groups have relatively similar levels of endogenous RAAS activation at baseline. In contrast, those with DKD had minimal changes in RVR responses to exogenous RAAS stimulation, reflecting exaggerated intrarenal RAAS activation at baseline. When analyzed on the basis of afferent (RA) versus efferent (RE) arteriolar vascular resistance, we observed that the effect of endogenous baseline RAAS activation unexpectedly predominated at the RA in the DKD subgroup. Evidence of exaggerated endogenous RAAS activation was also present in the systemic circulation in the DKD but not the DKD resistor subgroup.
The overall aims of the Canadian Study of Longevity in Type 1 Diabetes were to examine pathophys-iological mechanisms that contribute to complications in patients with prolonged durations (>50 years) of T1D, with the primary objective to characterize renal and systemic vascular phenotypes related to DKD. Recent reports from the Scottish Registry Linkage Study and from studies of the Swedish National Diabetes Register indicate that T1D is associated with a several-fold increase in mortality across all age groups (29–31). The strongest risk factor for cardiovascular disease and mortality in T1D is DKD (4, 5). The FinnDiane and Pittsburgh EDC studies reported that, in the absence of DKD, mortality is not increased in patients with T1D compared with patients without diabetes over 20-years of follow-up (32, 33). These findings support more aggressive risk factor management in T1D, especially in those at increased risk of DKD. While approximately 50% of people with T1D will resist DKD (6, 7), despite treatment optimization, a subset of people (~30%– 50%) with T1D will continue to develop DKD (4, 5) for reasons that remain incompletely understood.
The current standard of care for DKD includes the use of RAAS inhibitors (34), which preferential-ly modify renal efferent tone through blocking the production of ANGII (ACE inhibitors) or the effect of ANGII at the ANGII type 1 (AT1) receptor expressed on vascular smooth muscle cells (with ANGII receptor blockers) (10). In T1D, hyperglycemia augments RAAS activation, including increased ambi-ent levels of intrarenal RAAS mediators (35) and also leads to changes in AT1 receptor localization, expression, and/or sensitivity (36). In the present set of experiments, we observed different intrarenal hemodynamic functional responses to acute exogenous RAAS stimulation with low- and high-dose ANGII infusion in participants with T1D and evidence of DKD compared with those without DKD. Interestingly, our analysis based on Gomez equations suggested that differences in RAAS-stimulated
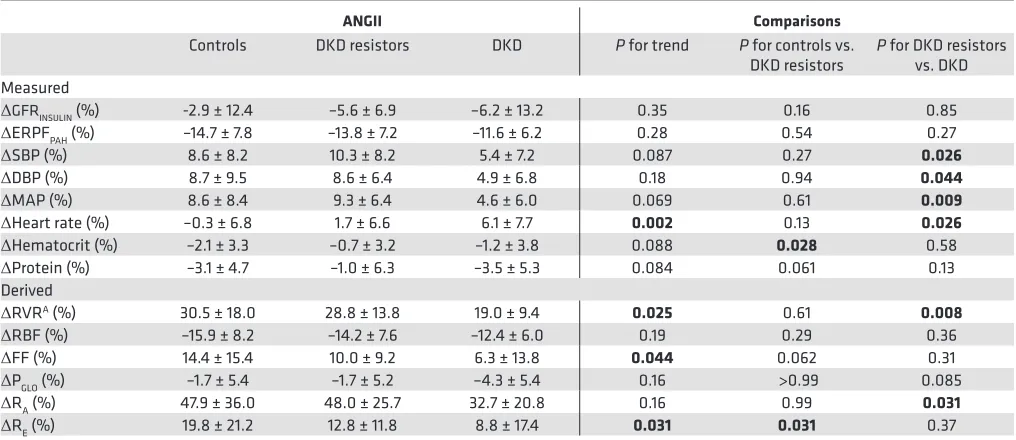
Table 3. Percentage change in renal hemodynamic function and systemic hemodynamics in response to exogenous RAAS stimulation with ANGII
ANGII Comparisons
Controls DKD resistors DKD P for trend P for controls vs.
DKD resistors P for DKD resistors vs. DKD Measured
ΔGFRINSULIN (%) -2.9 ± 12.4 –5.6 ± 6.9 –6.2 ± 13.2 0.35 0.16 0.85
ΔERPFPAH (%) –14.7 ± 7.8 –13.8 ± 7.2 –11.6 ± 6.2 0.28 0.54 0.27
ΔSBP (%) 8.6 ± 8.2 10.3 ± 8.2 5.4 ± 7.2 0.087 0.27 0.026 ΔDBP (%) 8.7 ± 9.5 8.6 ± 6.4 4.9 ± 6.8 0.18 0.94 0.044 ΔMAP (%) 8.6 ± 8.4 9.3 ± 6.4 4.6 ± 6.0 0.069 0.61 0.009 ΔHeart rate (%) –0.3 ± 6.8 1.7 ± 6.6 6.1 ± 7.7 0.002 0.13 0.026 ΔHematocrit (%) –2.1 ± 3.3 –0.7 ± 3.2 –1.2 ± 3.8 0.088 0.028 0.58
ΔProtein (%) –3.1 ± 4.7 –1.0 ± 6.3 –3.5 ± 5.3 0.084 0.061 0.13 Derived
ΔRVRA (%) 30.5 ± 18.0 28.8 ± 13.8 19.0 ± 9.4 0.025 0.61 0.008 ΔRBF (%) –15.9 ± 8.2 –14.2 ± 7.6 –12.4 ± 6.0 0.19 0.29 0.36
ΔFF (%) 14.4 ± 15.4 10.0 ± 9.2 6.3 ± 13.8 0.044 0.062 0.31
ΔPGLO (%) –1.7 ± 5.4 –1.7 ± 5.2 –4.3 ± 5.4 0.16 >0.99 0.085 ΔRA (%) 47.9 ± 36.0 48.0 ± 25.7 32.7 ± 20.8 0.16 0.99 0.031 ΔRE (%) 19.8 ± 21.2 12.8 ± 11.8 8.8 ± 17.4 0.031 0.031 0.37
Positive values represent increase from baseline. Significant values are shown in bold (P < 0.05). AChange in RVR in response to exogenous RAAS
RVR responses were due to an attenuated response to ANGII at the afferent renal arteriole in those with DKD versus DKD resistors due to high endogenous baseline RAAS activation at the afferent arteriole. Evidence of endogenous RAAS activa-tion was present to a similar degree at the efferent arteriole, as there was minimal change in the RE in all T1D partici-pants regardless of DKD status. These observations suggest that under conditions of prolonged T1D duration, patients with DKD manifest accentuated endogenous renal RAAS activation, predominantly at the afferent arteriole, leading to blunted hemodynamic responsiveness to exogenous RAAS stimulation (Figure 5). Whether this occurs due to higher local RAAS production in the renal microcirculation or due to higher expression or sensitivity of AT1 receptors in renal arterioles in DKD or due to the development of resistance to ANGII is unknown but warrants further investigation. A trend toward reduced ΔRE was observed among the DKD subgroup compared with the DKD resistors; however, this was not statistically significant. We leave open the possibil-ity that this study may not have been adequately powered to detect an effect on RE.
The hemodynamic phenotype in the systemic circula-tion of those with T1D typically parallels the changes in the renal microcirculation. Systemic circulatory changes in T1D have been attributed to RAAS activation (37–40), leading to increased arterial stiffness, endothelial dysfunction, hyper-tension, and the risk of macrovascular complications — all of which may be exaggerated with increased age (41–44). In the present study, changes in blood pressure did not differ among DKD resistors compared with the controls in response to RAAS stimulation. In contrast, in T1D adults with DKD, the vasoconstrictive blood pressure response to RAAS stimu-lation was comparatively attenuated, suggesting higher endog-enous baseline RAAS activation in the systemic circulation in those with DKD. These observations suggest that the clas-sical RAAS paradox, whereby intrarenal RAAS activation is exaggerated in the presence of low levels of the systemic RAAS (45), may not occur in the setting of prolonged T1D durations, since the responses to exogenous RAAS stimulation were concordantly sup-pressed for RVR and for systemic blood pressure in those with DKD. In keeping with these observations, baseline plasma renin concentrations were highest among those with DKD, and circulating aldosterone levels tended to be higher in those with DKD compared with those without DKD.
Preservation of renal and systemic vascular function in DKD resistors may contribute to protec-tion against microvascular and macrovascular injury and the development of clinical complicaprotec-tions. To further assess the vasculature in this cohort, we measured arterial stiffness and observed that, only in participants with T1D with DKD, there was an attenuated carotid-femoral PWV response compared
with those without DKD and compared with controls with exogenous RAAS stimulation. In contrast, carotid-radial PWV responses to exogenous RAAS stimulation were exaggerated in participants with T1D and DKD. In patients with T1D without DKD, PWV responses to exogenous RAAS stimulation were similar compared with controls. These findings substantiate the hypothesis that, in the setting of prolonged T1D, DKD is asso-ciated with circulation-specific changes in PWV-derived arterial stiffness responses to exogenous ANGII.
Cardiac autonomic neuropathy is an early predictor of mac-rovascular disease, carotid artery disease, and mortality in diabe-tes mellitus (46). In this cohort, although control participants had higher HRV compared with adults with T1D, we did not observe statistically significant differences in HRV between T1D adults with and without DKD. Despite the fact that no significant differences were observed in HRV among T1D participants within the cohort, HRV was positively associated with the intrarenal hemodynamic response to exogenous RAAS stimulation only in DKD resistors, which may also reflect a relationship between lower baseline RAAS activation (e.g., accentuated RAAS stimulation response) and pres-ervation of HRV in DKD resistors. Interestingly, those with T1D and DKD had increased heart rate upon exogenous RAAS stimu-lation, despite having minimal change in blood pressure upon exog-enous RAAS stimulation. We are presently unaware of definitive mechanisms in humans linking exaggerated responses in heart rate to RAAS stimulation in those with DKD in the absence of increases in arterial pressure. Prior preclinical studies in baroreceptor-denervated rats revealed acute sympathoexcitatory effects in response to exogenous ANGII — effects, which may counter ANGII-stimulated increases in blood pressure, which are associated with a baroreceptor response that affects heart rate via downregulating sympathetic nerve activity (47).
While it is not yet clear how our observations may translate into clinical practice, it is relevant that sodi-um glucose cotransporter-2 (SGLT2) inhibitors reduce cardiovascular risk, albsodi-uminuria, and progressive DKD in patients with T2D who participated in the EMPA-REG OUTCOME and CANVAS Program car-diovascular safety trials (48–50). Renal benefits with SGLT2 inhibitors in animals and in humans have been attributed in large part to proximal tubular natriuresis, leading to activation of tubuloglomerular feedback and afferent vasoconstriction (35, 51–53). In the current set of studies involving adults with long-standing
Figure 3. Percentage change in systemic hemodynamic parameters response to exogenous RAAS stimulation with ANGII. Percentage change in MAP (A) and heart rate (B) are shown for age- and sex-matched controls (n = 74), DKD resistors (n = 42), and DKD nonresistors (n = 20) at baseline, in response to low- and high-dose ANGII, and during recovery. Data represent mean ± SEM. ANGII, angiotensin II; MAP, mean arterial pressure. *P < 0.05, Student’s t test, for DKD resistors versus DKD.
Table 4. Arterial stiffness measurements at baseline
Controls DKD resistors DKD P for trend P for controls vs. DKD resistors P for DKD resistors vs. DKD
n = 74 n = 42 n = 20
Aortic AIx (%) 22.6 ± 9.8 23.8 ± 6.4 26.1 ± 7.6 0.27 0.42 0.23 Carotid AIx (%) 25.4 ± 10.0 25.5 ± 7.6 27.9 ± 7.9 0.54 0.95 0.26 Carotid-radial PWV (m/s) 7.8 ± 1.2 8.6 ± 1.9 8.2 ± 1.1 0.11 0.043 0.61 Carotid-femoral PWV (m/s) 7.6 ± 1.9 10.4 ± 3.7 12.7 ± 4.4 <0.001 <0.001 0.016
investigate other vasoconstrictive or vasodilatory pathways independent of the RAAS, which may also be of importance in the differentiation of DKD resistor status in those with prolonged T1D durations. In addition, other factors, including atrial natriuretic peptide, may be involved in the regulation of renal func-tion in the setting of diabetes, although this is likely relevant primarily during uncontrolled hyperglycemia rather than under the clamped euglycemic conditions used as part of the Canadian Study of Longevity in Type 1 Diabetes. Finally, we studied participants who were already prone to DKD, and therefore, the changes observed in endogenous RAAS activation may represent associative rather than causative DKD mechanisms. The strengths of this study included direct measures of GFR and renal plasma flow, with simultaneous measurements of systemic hemodynamic function, vascular studies, and neurohormonal and autonomic assessment under clamped euglycemic conditions. Another strength of our study is complete intrarenal and systemic hemodynamic functional testing at baseline and in response to low and high dos-es of ANGII in participants with prolonged durations of T1D (≥50 years) and in age- and sex-matched controls without diabetes. In contrast to studies including patients with shorter diabetes durations (10–30 years), wherein DKD resistor status may be less reliable due to the possibility of participants subsequently developing DKD, a strength of the current study is our confidence in the classification of the DKD resistor subgroup, who despite very prolonged durations of T1D did not have evidence of renal injury.
In summary, in adults with long-standing T1D, those categorized as DKD resistors had similar responses to exogenous RAAS stimulation as age- and sex-matched nondiabetic controls. In contrast, participants with long-standing T1D and evidence of DKD exhibited less change in intrarenal hemodynamic function with exog-enous RAAS stimulation, particularly at the renal afferent arteriole, compared with those without DKD and controls. Differing patterns of systemic vascular responses to exogenous RAAS stimulation were also observed among DKD and DKD resistor subgroups. These observations strongly suggest that baseline endogenous RAAS activation is at least one important factor that differentiates DKD resistor status in adults with a prolonged dura-tion of T1D. Furthermore, these results emphasize that, in adults with long-standing T1D with DKD, excessive RAAS tone and currently available methods to modify the RAAS affect the renal circulation differently than assumed, a finding which offers insights into limitations of these agents and possible future targets for therapy.
Methods
Study design
This was a cross-sectional cohort study of 75 participants with T1D of ≥50-year duration with and without DKD and 75 age- and sex-matched controls to determine mechanisms of nephropathy resis-tance (Figure 1). Participants with T1D were categorized as DKD resistors if they had eGFRMDRD ≥60 ml/min/1.73 m2 and 24-hour urine albumin excretion <30 mg/d at their screening visit. Study
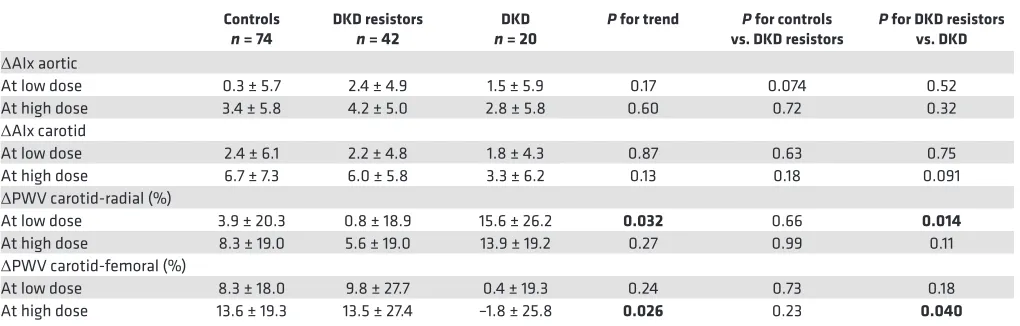
Table 5. Change in arterial stiffness in response to exogenous RAAS stimulation with ANGII
Controls
n = 74 DKD resistors n = 42 n = 20DKD P for trend vs. DKD resistorsP for controls P for DKD resistors vs. DKD ΔAIx aortic
At low dose 0.3 ± 5.7 2.4 ± 4.9 1.5 ± 5.9 0.17 0.074 0.52 At high dose 3.4 ± 5.8 4.2 ± 5.0 2.8 ± 5.8 0.60 0.72 0.32
ΔAIx carotid
At low dose 2.4 ± 6.1 2.2 ± 4.8 1.8 ± 4.3 0.87 0.63 0.75 At high dose 6.7 ± 7.3 6.0 ± 5.8 3.3 ± 6.2 0.13 0.18 0.091
ΔPWV carotid-radial (%)
At low dose 3.9 ± 20.3 0.8 ± 18.9 15.6 ± 26.2 0.032 0.66 0.014
At high dose 8.3 ± 19.0 5.6 ± 19.0 13.9 ± 19.2 0.27 0.99 0.11
ΔPWV carotid-femoral (%)
At low dose 8.3 ± 18.0 9.8 ± 27.7 0.4 ± 19.3 0.24 0.73 0.18 At high dose 13.6 ± 19.3 13.5 ± 27.4 –1.8 ± 25.8 0.026 0.23 0.040 Positive values represent increase from baseline. Significant values are shown in bold (P < 0.05). ΔAIx is presented as unit change from baseline AIx, while
participants were categorized as DKD if they had an eGFRMDRD <60 ml/min/1.73 m2 or 24-hour urine
Study population
Participants were recruited from the nation-wide registry of approximately 450 Canadians with long-stand-ing T1D (duration ≥50 years) established durlong-stand-ing the first phase of the Canadian Study of Longevity in Type 1 Diabetes, as previously described (51, 60, 61). Search criteria for second phase of the study included residence in the Greater Toronto Area (e.g., proximity to the University Health Network and Mount Sinai Hospital in Toronto) or a willingness to travel to Toronto General Hospital, Toronto, Ontario, Canada, for the 2 study days. Age- and sex-matched controls were recruited from friends or family members of the T1D participants or were recruited through community advertisement. Inclusion criteria for the controls were (a) 1:1 sex matching as well as being within 5 years of age of a T1D participant and (b) ability to understand and cooperate with study procedures. Exclusion criteria were (a) presence of diabetes mellitus (for controls), (b) microalbuminuria or eGFR <45 ml/min/1.73 m2, (c) history of hypertension or blood
pressure >140/90 mmHg, and (d) current eye infection, corneal damage, severe movement disorder, or proparacaine allergy to preclude safe corneal confocal microscopy examination (for T1D participants).
Measurement of renal hemodynamic function in response to ANGII
Prestudy procedures in brief. All participants underwent RAAS inhibitor (ACE inhibitors, angiotensin
recep-tor blockers, direct renin inhibirecep-tors, aldosterone antagonists) washout 30 days prior to study day 2. For 7 days prior to the study day 2, participants were instructed to maintain a minimum sodium intake of 150 mmol/d and a protein diet of 1.5 g/kg/d. Compliance was evaluated by measurement of 24-hour urine sodium and urea excretion on the seventh day (62, 63). During this time, study staff reviewed daily blood pressure measurements through home monitoring (ambulatory blood pressure meters were provided to participants). For participants who could not tolerate RAAS withdrawal (consistent home blood pressure readings >140/80 mmHg), calcium channel blockade with amlodipine was used if required, and evalua-tion of urinary albumin and serum creatinine and potassium took place at study day 2 (11, 64).
Study day procedures. Following an overnight fast, participants arrived at the Renal Physiology
Labora-tory (Toronto General Hospital) for measurement of renal hemodynamic function. Renal hemodynamic function was measured at baseline and in response to low- and high-dose ANGII infusion (Clinalfa; 51.2
μg/vial prepared in a 400 ng/ml solution). All study participants underwent the same experimental pro-cedures, except that participants with T1D underwent a minimum 2-hour euglycemic clamp prior to and during measurement of renal hemodynamic function. The euglycemic clamp was maintained by mea-surement of venous blood glucose every 10–15 minutes, and an insulin infusion was titrated to achieve a constant blood glucose range of 4–6 mmol/l.
After a brief physical exam, peripheral intravenous catheters were placed for blood sampling, infusion of regents, and infusion of dextrose (5% dilution) or insulin (0.2 IU/ml dilution) (for euglycemic clamp). After a rest period of approximately 15 minutes, baseline blood and urine were drawn. Ad libitum water consumption was allowed during the experimental period, up to a maximum of 500 ml. Patients remained supine throughout the study and during measurements but were allowed to ambulate for subjective voiding.
Renal hemodynamic function was measured using insulin and para-aminohippurate (PAH) clearance techniques standardized per 1.73 m2 of body surface area, which measures the GFR
INSULIN and ERPFPAH,
respectively (65–67). FF was determined by dividing the GFRINSULIN by the ERPFPAH. RBF was calculated by dividing the ERPFPAH by 1-hematocrit. RVR was derived by dividing MAP by RBF. Intrarenal hemo-dynamic resistance measurements (RA, RE, and PGLO) were estimated using Gomez formulae, as described elsewhere (59, 68). Renal hemodynamic function was measured at (a) at baseline, (b) following a 0.5 ng/ kg/min (low-dose) infusion of intravenous ANGII, (c) following a 1 ng/kg/min (high-dose) infusion of
intravenous ANGII, and (d) during a 90-minute recovery period. Blood was collected for hematocrit, total protein, insulin, and PAH measurements. Initiation of ANGII infusion was withheld if a patient’s blood pressure increased above 150/80 mmHg, and infusion of ANGII was stopped if a study subject’s SBP increased to >160/100 mmHg during the ANGII experimental period.
Vascular studies
percentage of the central pulse pressure and corrected to an average heart rate of 75 beats/min. The aortic PWV was measured by sequentially recording ECG-gated right carotid and radial artery waveforms. Our group has published and validated the use of the SphygmoCor device previously (69).
HRV
HRV, testing vagal tone (RMSSD) sympathetic activity (SDNN), and LF/HF ratios were measured in all study participants using methods we have previously described (SphygmoCor) (69).
Study endpoints
As the gold-standard measure of endogenous intrarenal RAAS activation (20, 70, 71), the primary endpoint of the study was change in RVR in response to exogenous RAAS stimulation, defined as the percentage difference between RVR measured at baseline and RVR measured after the second infusion of ANGII. The relationship between change in RVR and endogenous RAAS activation is inverse (a smaller percentage change in RVR after exogenous RAAS stimulation reflects greater endogenous RAAS activation at baseline, a greater percentage change in RVR reflects endogenous RAAS activation at baseline). The primary com-parison was between the DKD resistor and DKD subgroups of the T1D participants. Secondary endpoints included changes in intrarenal hemodynamic function (RA, RE, PGLO, GFRINSULIN, ERPFPAH, RBF, RVR, FF), systemic variables (MAP and heart rate), and vascular studies of arterial stiffness measures (AIx, PWV) and autonomic function (SDNN, RMSSD, LF, HF). Secondary comparisons included analysis of trends across all 3 subgroups (DKD, DKD resistors, and controls, respectively) and between controls and DKD resistors.
Statistics
Statistical analyses were performed using SAS version 9.2 for Windows (SAS Institute). The primary end-point comparison was made using the 2-tailed Student’s t test. Continuous variables were assessed for nor-mality (Shapiro-Wilk and inspection of histograms). Tests for trend of clinical characteristics and study end-points among controls, DKD resistors, and DKD subgroups were made using ANOVA, the Kruskal-Wallis test, or the χ2 test, depending on variable distribution. Secondary comparisons were also made using the t
test or the Wilcoxon rank-sum test. A 2-tailed P value of 0.05 was used for tests of statistical significance. All study participants included in the final analysis underwent ANGII infusion, and analyses were done on a per protocol basis. Missing GFRINSULIN and ERPFPAH data existed at all 4 time points for 6 participants (3 controls and 3 T1D) due to sample contamination. Three participants had partial (<4 time points) sample contamination, and in these cases, observations were carried forward. The planned sample size was based on previous studies in T1D longevity cohorts of nephropathy resistance (72) (in which prevalence of nephropathy resistance was estimated to be one-third) and renal hemodynamics (62) (in which ΔRVR was observed to be 0.086 ± 0.035 mmHg/l/min in participants with T1D aged >35 years and 0.057 ± 0.026 mmHg/l/min in
non-diabetic controls). To achieve a difference in mean ΔRVR, a DKD resistor sample size of n = 21 was required to achieve 90% power with a type 1 error of 0.05. To recruit at minimum 21 DKD resistors, we planned a sample size of 75 T1D participants.
Study approval
All participants provided written informed consent prior to inclusion in this study, and the study was approved by the institutional research ethics boards of the University Health Network and Mount Sinai Hospital.
Author contributions
Acknowledgments
The Canadian Study of Longevity in Diabetes was funded by the JDRF (operating grant 17-2013-312). JAL is supported by a CARE (Cardio-Renal-Endocrine) post-doctoral fellowship by the Division of Nephrol-ogy, Department of Medicine, University Health Network, University of Toronto. We acknowledge the contributions of the Steven and Ofra Menkes Fund for supporting aspects of this research.
Address correspondence to: Julie A. Lovshin, Room H154, H-Wing, 2075 Bayview Avenue, Sunnybrook Health Sciences Centre, Toronto, Ontario, Canada, M4N 3M5. Phone: 416.480.4800 ext. 2264; Email: julie.lovshin@sunnybrook.ca.
1. Saran R, et al. US Renal Data System 2015 Annual Data Report: Epidemiology of Kidney Disease in the United States. Am J
Kidney Dis. 2016;67 (3 Suppl 1):Svii, S1–Svii,305.
2. Bjornstad P, Cherney D, Maahs DM. Early diabetic nephropathy in type 1 diabetes: new insights. Curr Opin Endocrinol Diabetes
Obes. 2014;21 (4):279–286.
3. Bjornstad P, Cherney DZ, Maahs DM. Update on estimation of kidney function in diabetic kidney disease. Curr Diab Rep. 2015;15 (9):57.
4. Marshall SM. Diabetic nephropathy in type 1 diabetes: has the outlook improved since the 1980s? Diabetologia. 2012;55 (9):2301–2306.
5. Krolewski AS, Warram JH, Christlieb AR, Busick EJ, Kahn CR. The changing natural history of nephropathy in type I diabe-tes. Am J Med. 1985;78(5):785–794.
6. Krolewski AS, Warram JH, Rand LI, Kahn CR. Epidemiologic approach to the etiology of type I diabetes mellitus and its com-plications. N Engl J Med. 1987;317 (22):1390–1398.
7. Caramori ML, et al. Cellular basis of diabetic nephropathy: 1. Study design and renal structural-functional relationships in patients with long-standing type 1 diabetes. Diabetes. 2002;51(2):506–513.
8. Doria A, Warram JH, Krolewski AS. Genetic predisposition to diabetic nephropathy. Evidence for a role of the angiotensin I--converting enzyme gene. Diabetes. 1994;43(5):690–695.
9. Soro-Paavonen A, et al. Circulating ACE2 activity is increased in patients with type 1 diabetes and vascular complications.
J Hypertens. 2012;30 (2):375–383.
10. Velez JC. The importance of the intrarenal renin-angiotensin system. Nat Clin Pract Nephrol. 2009;5 (2):89–100.
11. Sochett EB, Cherney DZ, Curtis JR, Dekker MG, Scholey JW, Miller JA. Impact of renin angiotensin system modulation on the hyperfiltration state in type 1 diabetes. J Am Soc Nephrol. 2006;17 (6):1703–1709.
12. Mauer M, et al. Renal and retinal effects of enalapril and losartan in type 1 diabetes. N Engl J Med. 2009;361(1):40–51. 13. Turgut F, Balogun RA, Abdel-Rahman EM. Renin-angiotensin-aldosterone system blockade effects on the kidney in the elderly:
benefits and limitations. Clin J Am Soc Nephrol. 2010;5 (7):1330–1339.
14. Mann JF, et al. Renal outcomes with telmisartan, ramipril, or both, in people at high vascular risk (the ONTARGET study): a multicentre, randomised, double-blind, controlled trial. Lancet. 2008;372(9638):547–553.
15. Parving HH, et al. Cardiorenal end points in a trial of aliskiren for type 2 diabetes. N Engl J Med. 2012;367 (23):2204–2213. 16. Fried LF, et al. Combined angiotensin inhibition for the treatment of diabetic nephropathy. N Engl J Med. 2013;369 (20):1892–1903. 17. Lewis EJ, et al. Pyridorin in type 2 diabetic nephropathy. J Am Soc Nephrol. 2012;23 (1):131–136.
18. Cherney DZ, et al. Effect of protein kinase Cbeta inhibition on renal hemodynamic function and urinary biomarkers in humans with type 1 diabetes: a pilot study. Diabetes Care. 2009;32 (1):91–93.
19. Maahs DM, et al. Uric acid lowering to prevent kidney function loss in diabetes: the preventing early renal function loss (PERL) allopurinol study. Curr Diab Rep. 2013;13 (4):550–559.
20. Miller JA. Impact of hyperglycemia on the renin angiotensin system in early human type 1 diabetes mellitus. J Am Soc Nephrol. 1999;10 (8):1778–1785.
21. Miller JA, Floras JS, Zinman B, Skorecki KL, Logan AG. Effect of hyperglycaemia on arterial pressure, plasma renin activity and renal function in early diabetes. Clin Sci. 1996;90 (3):189–195.
22. Cherney DZ, et al. The effect of aliskiren on urinary cytokine/chemokine responses to clamped hyperglycaemia in type 1 diabe-tes. Diabetologia. 2013;56 (10):2308–2317.
23. Cherney DZ, Scholey JW, Miller JA. Insights into the regulation of renal hemodynamic function in diabetic mellitus. Curr
Dia-betes Rev. 2008;4 (4):280–290.
24. Cherney DZ, Scholey JW, Sochett E, Bradley TJ, Reich HN. The acute effect of clamped hyperglycemia on the urinary excre-tion of inflammatory cytokines/chemokines in uncomplicated type 1 diabetes: a pilot study. Diabetes Care. 2011;34 (1):177–180. 25. Zatz R, Dunn BR, Meyer TW, Anderson S, Rennke HG, Brenner BM. Prevention of diabetic glomerulopathy by
pharmacologi-cal amelioration of glomerular capillary hypertension. J Clin Invest. 1986;77 (6):1925–1930.
26. Hollenberg NK, et al. Glomerular hemodynamics and the renin-angiotensin system in patients with type 1 diabetes mellitus.
Kidney Int. 2003;63 (1):172–178.
27. Cherney DZ, et al. Age is a determinant of acute hemodynamic responses to hyperglycemia and angiotensin II in humans with uncomplicated type 1 diabetes mellitus. Am J Physiol Regul Integr Comp Physiol. 2010;299 (1):R206–R214.
28. Roos MH, Eringa EC, van Rodijnen WF, van Lambalgen TA, Ter Wee PM, Tangelder GJ. Preglomerular and postglomerular basal diameter changes and reactivity to angiotensin II in obese rats. Diabetes Obes Metab. 2008;10 (10):898–905.
30. Harding JL, Shaw JE, Peeters A, Davidson S, Magliano DJ. Age-Specific Trends From 2000-2011 in All-Cause and Cause-Spe-cific Mortality in Type 1 and Type 2 Diabetes: A Cohort Study of More Than One Million People. Diabetes Care. 2016;39 (6):1018–1026.
31. Lind M, et al. Glycemic control and excess mortality in type 1 diabetes. N Engl J Med. 2014;371(21):1972–1982.
32. Groop PH, et al. The presence and severity of chronic kidney disease predicts all-cause mortality in type 1 diabetes. Diabetes. 2009;58 (7):1651–1658.
33. Orchard TJ, Secrest AM, Miller RG, Costacou T. In the absence of renal disease, 20 year mortality risk in type 1 diabetes is comparable to that of the general population: a report from the Pittsburgh Epidemiology of Diabetes Complications Study.
Dia-betologia. 2010;53 (11):2312–2319.
34. Canadian Diabetes Association Clinical Practice Guidelines Expert Committee, McFarlane P, Gilbert RE, MacCallum L, Senior P. Chronic kidney disease in diabetes. Can J Diabetes. 2013;37 Suppl 1:S129–S136.
35. Burns KD, et al. The relationship between urinary renin-angiotensin system markers, renal function, and blood pressure in ado-lescents with type 1 diabetes. Am J Physiol Renal Physiol. 2017;312 (2):F335–F342.
36. Carey RM, Siragy HM. The intrarenal renin-angiotensin system and diabetic nephropathy. Trends Endocrinol Metab. 2003;14(6):274–281.
37. Matsumoto N, et al. Diabetes mellitus worsens intrarenal hemodynamic abnormalities in nondialyzed patients with chronic renal failure. Nephron. 2000;86 (1):44–51.
38. Dalla Vestra M, et al. Nitric oxide modulation of renal and cardiac hemodynamics in type 2 diabetes. Eur J Endocrinol. 2002;146 (5):687–694.
39. Rönnback M, et al. Altered age-related blood pressure pattern in type 1 diabetes. Circulation. 2004;110 (9):1076–1082. 40. Herbert KE, Mistry Y, Hastings R, Poolman T, Niklason L, Williams B. Angiotensin II-mediated oxidative DNA damage
accel-erates cellular senescence in cultured human vascular smooth muscle cells via telomere-dependent and independent pathways.
Circ Res. 2008;102 (2):201–208.
41. Jie W, et al. SDF-1α/CXCR4 axis is involved in glucose-potentiated proliferation and chemotaxis in rat vascular smooth muscle cells. Int J Exp Pathol. 2010;91 (5):436–444.
42. Lakatta EG, Wang M, Najjar SS. Arterial aging and subclinical arterial disease are fundamentally intertwined at macroscopic and molecular levels. Med Clin North Am. 2009;93(3):583–Contents.
43. Akbari CM, Saouaf R, Barnhill DF, Newman PA, LoGerfo FW, Veves A. Endothelium-dependent vasodilatation is impaired in both microcirculation and macrocirculation during acute hyperglycemia. J Vasc Surg. 1998;28(4):687–694.
44. Gordin D, Rönnback M, Forsblom C, Heikkilä O, Saraheimo M, Groop PH. Acute hyperglycaemia rapidly increases arterial stiffness in young patients with type 1 diabetes. Diabetologia. 2007;50 (9):1808–1814.
45. Price DA, et al. The paradox of the low-renin state in diabetic nephropathy. J Am Soc Nephrol. 1999;10 (11):2382–2391. 46. Vinik AI, Ziegler D. Diabetic cardiovascular autonomic neuropathy. Circulation. 2007;115(3):387–397.
47. Xu L, Sved AF. Acute sympathoexcitatory action of angiotensin II in conscious baroreceptor-denervated rats. Am J Physiol Regul
Integr Comp Physiol. 2002;283 (2):R451–R459.
48. Neal B, et al. Canagliflozin and cardiovascular and renal events in type 2 diabetes. N Engl J Med. 2017;377(7):644–657. 49. Wanner C, et al. Empagliflozin and progression of kidney disease in type 2 diabetes. N Engl J Med. 2016;375(4):323–334. 50. Zinman B, et al. Empagliflozin, cardiovascular outcomes, and mortality in type 2 diabetes. N Engl J Med. 2015;373(22):2117–2128. 51. Boulet G, et al. Prevalence of Insulin Pump Therapy and Its Association with Measures of Glycemic Control: Results from the
Canadian Study of Longevity in Type 1 Diabetes. Diabetes Technol Ther. 2016;18 (5):298–307.
52. Rajasekeran H, Cherney DZ, Lovshin JA. Do effects of sodium-glucose cotransporter-2 inhibitors in patients with diabetes give insight into potential use in non-diabetic kidney disease? Curr Opin Nephrol Hypertens. 2017;26 (5):358–367.
53. Heerspink HJ, Perkins BA, Fitchett DH, Husain M, Cherney DZ. Sodium glucose cotransporter 2 inhibitors in the treatment of diabe-tes mellitus: Cardiovascular and kidney effects, potential mechanisms, and clinical applications. Circulation. 2016;134 (10):752–772. 54. Skrtić M, et al. Characterisation of glomerular haemodynamic responses to SGLT2 inhibition in patients with type 1 diabetes
and renal hyperfiltration. Diabetologia. 2014;57(12):2599–2602.
55. Cherney DZ, et al. Renal hemodynamic effect of sodium-glucose cotransporter 2 inhibition in patients with type 1 diabetes mel-litus. Circulation. 2014;129 (5):587–597.
56. Cherney DZ, et al. Sodium glucose cotransport-2 inhibition and intrarenal RAS activity in people with type 1 diabetes. Kidney
Int. 2014;86 (5):1057–1058.
57. Dandona P, et al. Efficacy and safety of dapagliflozin in patients with inadequately controlled type 1 diabetes (DEPICT-1): 24 week results from a multicentre, double-blind, phase 3, randomised controlled trial. Lancet Diabetes Endocrinol. 2017;5(11):864–876. 58. Garg SK, et al. Effects of sotagliflozin added to insulin in patients with type 1 diabetes. N Engl J Med. 2017;377(24):2337–2348. 59. Bjornstad P, et al. The Gomez’ equations renal hemodynamic function in kidney disease research [published online of print
September 7, 2016]. Am J Physiol Renal Physiol. https://doi.org/10.1152/ajprenal.00415.2016.
60. Marso SP, et al. Semaglutide and cardiovascular outcomes in patients with type 2 diabetes. N Engl J Med. 2016;375(19):1834–1844. 61. Weisman A, et al. Commonly Measured Clinical Variables Are Not Associated With Burden of Complications in
Long-stand-ing Type 1 Diabetes: Results From the Canadian Study of Longevity in Diabetes. Diabetes Care. 2016;39 (5):e67–e68. 62. Cherney DZ, Lai V, Miller JA, Scholey JW, Reich HN. The angiotensin II receptor type 2 polymorphism influences
haemody-namic function and circulating RAS mediators in normotensive humans. Nephrol Dial Transplant. 2010;25 (12):4093–4096. 63. Cherney DZ, et al. Systemic hemodynamic function in humans with type 1 diabetes treated with protein kinase Cβ inhibition
and renin-angiotensin system blockade: a pilot study. Can J Physiol Pharmacol. 2012;90 (1):113–121.
64. Isakova T, et al. Fibroblast growth factor 23 and risks of mortality and end-stage renal disease in patients with chronic kidney disease. JAMA. 2011;305 (23):2432–2439.
65. Page A, et al. Endothelial nitric oxide synthase gene/gender interactions and the renal hemodynamic response to angiotensin II.
J Am Soc Nephrol. 2005;16 (10):3053–3060.
67. Chidambaram M, et al. Variation in the renin angiotensin system throughout the normal menstrual cycle. J Am Soc Nephrol. 2002;13 (2):446–452.
68. Gomez DM. Evaluation of renal resistances, with special reference to changes in essential hypertension. J Clin Invest. 1951;30 (10):1143–1155.
69. Cherney DZ, Lai V, Scholey JW, Miller JA, Zinman B, Reich HN. Effect of direct renin inhibition on renal hemodynamic function, arterial stiffness, and endothelial function in humans with uncomplicated type 1 diabetes: a pilot study. Diabetes Care. 2010;33 (2):361–365.
70. Miller JA, Anacta LA, Cattran DC. Impact of gender on the renal response to angiotensin II. Kidney Int. 1999;55 (1):278–285. 71. Miller JA, et al. Gender differences in the renal response to renin-angiotensin system blockade. J Am Soc Nephrol. 2006;17
(9):2554–2560.