VOLUME NO. 3 (2013), ISSUE NO. 03 (MARCH) ISSN 2231-5756
A Monthly Double-Blind Peer Reviewed (Refereed/Juried) Open Access International e-Journal - Included in the International Serial Directories Indexed & Listed at:
Ulrich's Periodicals Directory ©, ProQuest, U.S.A., EBSCO Publishing, U.S.A., Cabell’s Directories of Publishing Opportunities, U.S.A., Open J-Gage, India [link of the same is duly available at Inflibnet of University Grants Commission (U.G.C.)],
Index Copernicus Publishers Panel, Poland with IC Value of 5.09 & number of libraries all around the world.
VOLUME NO. 3 (2013), ISSUE NO. 03 (MARCH) ISSN 2231-5756
INTERNATIONAL JOURNAL OF RESEARCH IN COMMERCE, IT & MANAGEMENT
A Monthly Double-Blind Peer Reviewed (Refereed/Juried) Open Access International e-Journal - Included in the International Serial Directories
ii
CONTENTS
CONTENTS
CONTENTS
CONTENTS
Sr.No.
TITLE & NAME OF THE AUTHOR (S)
Page No.
1. EXTENT OF ABSOLUTE POVERTY IN RURAL SECTOR OF HIMACHAL PRADESH: A MEASURE OF UNEMPLOYMENT RAMNA
1 2. THE ENTREPRENEURSHIP CORE COMPETENCES FOR DISTRIBUTION SERVICE INDUSTRY
SU-CHANG CHEN, HSI-CHI HSIAO, JEN-CHIA CHANG, CHUN-MEI CHOU, CHIN-PIN CHEN & CHIEN-HUA SHEN
5 3. THE RELATIONSHIP BETWEEN MACROECONOMIC VARIABLES AND CEMENT INDUSTRY RETURNS: EMPIRICAL EVIDENCE FROM PAKISTANI CEMENT
INDUSTRY
MUHAMMAD IMRAN & QAISAR ABBAS
10 4. OUTLOOK OF MANAGEMENT STUDENTS TOWARDS EFFICIENCY OF ONLINE LEARNING-A CASE STUDY OF SHIVAMOGGA CITY, KARNATAKA STATE
SANDHYA.C, R. HIREMANI NAIK & ANURADHA.T.S
17 5. TRAFFIC RELATED MORTALITY AND ECONOMIC DEVELOPMENT
MURAT DARÇIN
21 6. SUBSCRIBER’S PERCEPTION TOWARDS CUSTOMER CARE SERVICE IN MOBILE TELECOMMUNICATION WITH SPECIAL REFERENCE TO TUTICORIN
CITY
S. ANTHONY RAHUL GOLDEN. & DR. V. GOPALAKRISHNAN
27
7. A STUDY OF WAVELET BASED IMAGE COMPRESSION ALGORITHMS CHETAN DUDHAGARA & DR. KISHOR ATKOTIYA
31 8. A STUDY OF CONSUMER’S IMPULSE BUYING BEHAVIOUR WITH REFERENCE TO EFFECT OF PROMOTIONAL TOOL IN THE OUTLETS OF
CHHATTISGARH
DR. MANOJ VERGHESE & POOJA G. LUNIYA
37
9. STUDY OF CONSUMER BEHAVIOR IN CELL PHONE INDUSTRY DR. ARUNA DEOSKAR
41 10. ANOTHER APPROACH OF SOLVING UNBALANCED TRANSPORTATION PROBLEM USING VOGEL’S APPROXIMATION METHOD
DILIP KUMAR GHOSH & YASHESH ZAVERI
45 11. PROBLEM OF NON-PERFORMING ASSETS OF STATE BANK OF INDIA: A CASE STUDY OF NAGPUR DISTRICT
DR. N. K. SHUKLA & M. MYTRAYE
49 12. INVESTMENT STRATEGY OF LIC OF INDIA AND ITS IMPACT ON PROFITABILITY
T. NARAYANA GOWD, DR. C. BHANU KIRAN & DR. CH. RAMAPRASADA RAO
59 13. PREDICTION OF DHAKA TEMPERATURE BASED ON SOFT COMPUTING APPROACHES
SHIPRA BANIK, MOHAMMAD ANWER & A.F.M. KHODADAD KHAN
65 14. SET THEORETIC APPROACH TO FUNDS FLOW STATEMENTS – A STUDY WITH REFERENCE TO STATE BANK OF INDIA
DR. PRANAM DHAR
71 15. STRATEGIES FOR THE SUCCESS OF BRAND EXTENDED PRODUCT : AN ANALYTICAL STUDY OF DEHRADUN DISTRICT WITH SPECIAL REFERENCE TO
FMCG
DR. AMIT JOSHI, DR.SAURABH JOSHI, DR. PRIYA GROVER & PARVIN JADHAV
80
16. VALUE ADDED TAX AND ECONOMIC GROWTH: THE NIGERIA EXPERIENCE (1994 -2010) DR. OWOLABI A. USMAN & ADEGBITE TAJUDEEN ADEJARE
85 17. CORPORATE SOCIAL RESPONSIBILITY INITIATIVES BY POWER GRID CORPORATION OF INDIA LIMITED: A STUDY
DR. S. RAGHUNATHA REDDY & MM SURAJ UD DOWLA
90 18. METADATA MANAGEMENT IN DATA WAREHOUSING AND BUSINESS INTELLIGENCE
VIJAY GUPTA & DR. JAYANT SINGH
93 19. QUALITY OF WORK LIFE - A CRITICAL STUDY ON INDIAN HOSPITALS
B.UMA RANI & M. SARALA
97 20. BUSINESS ETHICS: WAY FOR SUSTAINABLE DEVELOPMENT OF ORGANISATION
DR. SATYAM PINCHA & AVINASH PAREEK
105 21. USE OF ICT TOOLS IN HIGHER EDUCATION
SANDEEP YADAV & KIRAN YADAV
108 22. CONSTRUCTING CONFIDENCE INTERVALS FOR DIFFERENT TEST PROCEDURES FROM RIGHT FAILURE CENSORED NORMAL DATA
V. SRINIVAS
111 23. RECOGNISING CUSTOMER COMPLAINT BEHAVIOUR IN RESTAURANT
MUHAMMAD RIZWAN, MUHAMMAD AHMAD ATHAR, MUBASHRA WAHEED, ZAINAB WAHEED, RAIMA IMTIAZ & AYESHA MUNIR
116 24. SOCIO-CULTURAL EFFECTS OF ALCOHOL CONSUMPTION BEHAVIOUR OF YOUNG COMMERCIAL DRIVERS IN SOUTH WEST NIGERIA
DR. ADEJUMO, GBADEBO OLUBUNMI
123 25. MEAN-SHIFT FILTERING AND SEGMENTATION IN ULTRA SOUND THYROID IMAGES
S. BINNY
126 26. E-TAILING, ONLINE RETAILING ITS FACTORS AND RELATIONS WITH CUSTOMER PERSPECTIVE
WASIMAKRAM BINNAL
131 27. THE KNOWLEDGE MANAGEMENT AND THE PARAMETERS OF THE TECHNOLOGICAL INNOVATION PROCESS: APPLICATION IN THE TUNISIAN CASE
MLLE MAALEJ RIM & HABIB AFFES
134 28. THE RELATIONSHIP BETWEEN CORPORATE SOCIAL RESPONSIBILITY AND CORPORATE FINANCIAL PERFORMANCE: META-ANALYSIS
ASMA RAFIQUE CHUGHTAI & AAMIR AZEEM
139 29. AN EMPIRICAL STUDY ON STRESS SYMPTOMS OF ARTS, ENGINEERING AND MANAGEMENT STUDENTS IN TIRUCHIRAPALLI DISTRICT, TAMIL NADU
S. NAGARANI
144 30. PURCHASE INTENTION TOWARDS COUNTERFEIT PRODUCT
MUHAMMAD RIZWAN, SYEDA RABIA BUKHARI, TEHREEM ILYAS, HAFIZA QURAT UL AIN & HINA GULZAR
152
VOLUME NO. 3 (2013), ISSUE NO. 03 (MARCH) ISSN 2231-5756
INTERNATIONAL JOURNAL OF RESEARCH IN COMMERCE, IT & MANAGEMENT
A Monthly Double-Blind Peer Reviewed (Refereed/Juried) Open Access International e-Journal - Included in the International Serial Directories
iii
CHIEF PATRON
CHIEF PATRON
CHIEF PATRON
CHIEF PATRON
PROF. K. K. AGGARWAL
Chancellor, Lingaya’s University, Delhi
Founder Vice-Chancellor, Guru Gobind Singh Indraprastha University, Delhi
Ex. Pro Vice-Chancellor, Guru Jambheshwar University, Hisar
FOUNDER
FOUNDER
FOUNDER
FOUNDER PATRON
PATRON
PATRON
PATRON
LATE SH. RAM BHAJAN AGGARWAL
Former State Minister for Home & Tourism, Government of Haryana
Former Vice-President, Dadri Education Society, Charkhi Dadri
Former President, Chinar Syntex Ltd. (Textile Mills), Bhiwani
CO
CO
CO
CO----ORDINATOR
ORDINATOR
ORDINATOR
ORDINATOR
AMITA
Faculty, Government M. S., Mohali
ADVISORS
ADVISORS
ADVISORS
ADVISORS
DR. PRIYA RANJAN TRIVEDI
Chancellor, The Global Open University, Nagaland
PROF. M. S. SENAM RAJU
Director A. C. D., School of Management Studies, I.G.N.O.U., New Delhi
PROF. M. N. SHARMA
Chairman, M.B.A., Haryana College of Technology & Management, Kaithal
PROF. S. L. MAHANDRU
Principal (Retd.), Maharaja Agrasen College, Jagadhri
EDITOR
EDITOR
EDITOR
EDITOR
PROF. R. K. SHARMA
Professor, Bharti Vidyapeeth University Institute of Management & Research, New Delhi
CO
CO
CO
CO----EDITOR
EDITOR
EDITOR
EDITOR
DR. BHAVET
Faculty, Shree Ram Institute of Business & Management, Urjani
EDITORIAL ADVISORY BOARD
EDITORIAL ADVISORY BOARD
EDITORIAL ADVISORY BOARD
EDITORIAL ADVISORY BOARD
DR. RAJESH MODI
Faculty, Yanbu Industrial College, Kingdom of Saudi Arabia
PROF. SANJIV MITTAL
University School of Management Studies, Guru Gobind Singh I. P. University, Delhi
PROF. ANIL K. SAINI
Chairperson (CRC), Guru Gobind Singh I. P. University, Delhi
DR. SAMBHAVNA
VOLUME NO. 3 (2013), ISSUE NO. 03 (MARCH) ISSN 2231-5756
INTERNATIONAL JOURNAL OF RESEARCH IN COMMERCE, IT & MANAGEMENT
A Monthly Double-Blind Peer Reviewed (Refereed/Juried) Open Access International e-Journal - Included in the International Serial Directories
iv
DR. MOHENDER KUMAR GUPTA
Associate Professor, P. J. L. N. Government College, Faridabad
DR. SHIVAKUMAR DEENE
Asst. Professor, Dept. of Commerce, School of Business Studies, Central University of Karnataka, Gulbarga
ASSOCIATE EDITORS
ASSOCIATE EDITORS
ASSOCIATE EDITORS
ASSOCIATE EDITORS
PROF. NAWAB ALI KHAN
Department of Commerce, Aligarh Muslim University, Aligarh, U.P.
PROF. ABHAY BANSAL
Head, Department of Information Technology, Amity School of Engineering & Technology, Amity
University, Noida
PROF. A. SURYANARAYANA
Department of Business Management, Osmania University, Hyderabad
DR. SAMBHAV GARG
Faculty, Shree Ram Institute of Business & Management, Urjani
PROF. V. SELVAM
SSL, VIT University, Vellore
DR. PARDEEP AHLAWAT
Associate Professor, Institute of Management Studies & Research, Maharshi Dayanand University, Rohtak
DR. S. TABASSUM SULTANA
Associate Professor, Department of Business Management, Matrusri Institute of P.G. Studies, Hyderabad
SURJEET SINGH
Asst. Professor, Department of Computer Science, G. M. N. (P.G.) College, Ambala Cantt.
TECHNICAL ADVISOR
TECHNICAL ADVISOR
TECHNICAL ADVISOR
TECHNICAL ADVISOR
AMITA
Faculty, Government M. S., Mohali
FINANCIAL ADVISORS
FINANCIAL ADVISORS
FINANCIAL ADVISORS
FINANCIAL ADVISORS
DICKIN GOYAL
Advocate & Tax Adviser, Panchkula
NEENA
Investment Consultant, Chambaghat, Solan, Himachal Pradesh
LEGAL ADVISORS
LEGAL ADVISORS
LEGAL ADVISORS
LEGAL ADVISORS
JITENDER S. CHAHAL
Advocate, Punjab & Haryana High Court, Chandigarh U.T.
CHANDER BHUSHAN SHARMA
Advocate & Consultant, District Courts, Yamunanagar at Jagadhri
SUPERINTENDENT
SUPERINTENDENT
SUPERINTENDENT
SUPERINTENDENT
SURENDER KUMAR POONIA
VOLUME NO. 3 (2013), ISSUE NO. 03 (MARCH) ISSN 2231-5756
INTERNATIONAL JOURNAL OF RESEARCH IN COMMERCE, IT & MANAGEMENT
A Monthly Double-Blind Peer Reviewed (Refereed/Juried) Open Access International e-Journal - Included in the International Serial Directories
v
CALL FOR MANUSCRIPTS
CALL FOR MANUSCRIPTS
CALL FOR MANUSCRIPTS
CALL FOR MANUSCRIPTS
Weinvite unpublished novel, original, empirical and high quality research work pertaining to recent developments & practices in the area of Computer, Business, Finance, Marketing, Human Resource Management, General Management, Banking, Insurance, Corporate Governance and emerging paradigms in allied subjects like Accounting Education; Accounting Information Systems; Accounting Theory & Practice; Auditing; Behavioral Accounting; Behavioral Economics; Corporate Finance; Cost Accounting; Econometrics; Economic Development; Economic History; Financial Institutions & Markets; Financial Services; Fiscal Policy; Government & Non Profit Accounting; Industrial Organization; International Economics & Trade; International Finance; Macro Economics; Micro Economics; Monetary Policy; Portfolio & Security Analysis; Public Policy Economics; Real Estate; Regional Economics; Tax Accounting; Advertising & Promotion Management; Business Education; Management Information Systems (MIS); Business Law, Public Responsibility & Ethics; Communication; Direct Marketing; E-Commerce; Global Business; Health Care Administration; Labor Relations & Human Resource Management; Marketing Research; Marketing Theory & Applications; Non-Profit Organizations; Office Administration/Management; Operations Research/Statistics; Organizational Behavior & Theory; Organizational Development; Production/Operations; Public Administration; Purchasing/Materials Management; Retailing; Sales/Selling; Services; Small Business Entrepreneurship; Strategic Management Policy; Technology/Innovation; Tourism, Hospitality & Leisure; Transportation/Physical Distribution; Algorithms; Artificial Intelligence; Compilers & Translation; Computer Aided Design (CAD); Computer Aided Manufacturing; Computer Graphics; Computer Organization & Architecture; Database Structures & Systems; Digital Logic; Discrete Structures; Internet; Management Information Systems; Modeling & Simulation; Multimedia; Neural Systems/Neural Networks; Numerical Analysis/Scientific Computing; Object Oriented Programming; Operating Systems; Programming Languages; Robotics; Symbolic & Formal Logic and Web Design. The above mentioned tracks are only indicative, and not exhaustive.
Anybody can submit the soft copy of his/her manuscript anytime in M.S. Word format after preparing the same as per our submission guidelines duly available on our website under the heading guidelines for submission, at the email address: [email protected].
GUIDELINES FOR SUBM
GUIDELINES FOR SUBM
GUIDELINES FOR SUBM
GUIDELINES FOR SUBMISSION OF MANUSCRIPT
ISSION OF MANUSCRIPT
ISSION OF MANUSCRIPT
ISSION OF MANUSCRIPT
1. COVERING LETTER FOR SUBMISSION:
DATED: _____________
THE EDITOR
IJRCM
Subject: SUBMISSION OF MANUSCRIPT IN THE AREA OF .
(e.g. Finance/Marketing/HRM/General Management/Economics/Psychology/Law/Computer/IT/Engineering/Mathematics/other, please specify)
DEAR SIR/MADAM
Please find my submission of manuscript entitled ‘___________________________________________’ for possible publication in your journals.
I hereby affirm that the contents of this manuscript are original. Furthermore, it has neither been published elsewhere in any language fully or partly, nor is it under review for publication elsewhere.
I affirm that all the author (s) have seen and agreed to the submitted version of the manuscript and their inclusion of name (s) as co-author (s).
Also, if my/our manuscript is accepted, I/We agree to comply with the formalities as given on the website of the journal & you are free to publish our contribution in any of your journals.
NAME OF CORRESPONDING AUTHOR: Designation:
Affiliation with full address, contact numbers & Pin Code: Residential address with Pin Code:
Mobile Number (s): Landline Number (s): E-mail Address: Alternate E-mail Address:
NOTES:
a) The whole manuscript is required to be in ONE MS WORD FILE only (pdf. version is liable to be rejected without any consideration), which will start from the covering letter, inside the manuscript.
b) The sender is required to mention the following in the SUBJECT COLUMN of the mail:
New Manuscript for Review in the area of (Finance/Marketing/HRM/General Management/Economics/Psychology/Law/Computer/IT/ Engineering/Mathematics/other, please specify)
c) There is no need to give any text in the body of mail, except the cases where the author wishes to give any specific message w.r.t. to the manuscript. d) The total size of the file containing the manuscript is required to be below 500 KB.
e) Abstract alone will not be considered for review, and the author is required to submit the complete manuscript in the first instance.
f) The journal gives acknowledgement w.r.t. the receipt of every email and in case of non-receipt of acknowledgment from the journal, w.r.t. the submission of manuscript, within two days of submission, the corresponding author is required to demand for the same by sending separate mail to the journal.
2. MANUSCRIPT TITLE: The title of the paper should be in a 12 point Calibri Font. It should be bold typed, centered and fully capitalised.
3. AUTHOR NAME (S) & AFFILIATIONS: The author (s) full name, designation, affiliation (s), address, mobile/landline numbers, and email/alternate email address should be in italic & 11-point Calibri Font. It must be centered underneath the title.
VOLUME NO. 3 (2013), ISSUE NO. 03 (MARCH) ISSN 2231-5756
INTERNATIONAL JOURNAL OF RESEARCH IN COMMERCE, IT & MANAGEMENT
A Monthly Double-Blind Peer Reviewed (Refereed/Juried) Open Access International e-Journal - Included in the International Serial Directories
vi
5. KEYWORDS: Abstract must be followed by a list of keywords, subject to the maximum of five. These should be arranged in alphabetic order separated by commas and full stops at the end.
6. MANUSCRIPT: Manuscript must be in BRITISH ENGLISH prepared on a standard A4 size PORTRAIT SETTING PAPER. It must be prepared on a single space and single column with 1” margin set for top, bottom, left and right. It should be typed in 8 point Calibri Font with page numbers at the bottom and centre of every page. It should be free from grammatical, spelling and punctuation errors and must be thoroughly edited.
7. HEADINGS: All the headings should be in a 10 point Calibri Font. These must be bold-faced, aligned left and fully capitalised. Leave a blank line before each heading.
8. SUB-HEADINGS: All the sub-headings should be in a 8 point Calibri Font. These must be bold-faced, aligned left and fully capitalised.
9. MAIN TEXT: The main text should follow the following sequence:
INTRODUCTION
REVIEW OF LITERATURE
NEED/IMPORTANCE OF THE STUDY
STATEMENT OF THE PROBLEM
OBJECTIVES
HYPOTHESES
RESEARCH METHODOLOGY
RESULTS & DISCUSSION
FINDINGS
RECOMMENDATIONS/SUGGESTIONS
CONCLUSIONS
SCOPE FOR FURTHER RESEARCH
ACKNOWLEDGMENTS
REFERENCES
APPENDIX/ANNEXURE
It should be in a 8 point Calibri Font, single spaced and justified. The manuscript should preferably not exceed 5000 WORDS.
10. FIGURES & TABLES: These should be simple, crystal clear, centered, separately numbered & self explained, and titles must be above the table/figure. Sources of data should be mentioned below the table/figure. It should be ensured that the tables/figures are referred to from the main text.
11. EQUATIONS: These should be consecutively numbered in parentheses, horizontally centered with equation number placed at the right.
12. REFERENCES: The list of all references should be alphabetically arranged. The author (s) should mention only the actually utilised references in the preparation of manuscript and they are supposed to follow Harvard Style of Referencing. The author (s) are supposed to follow the references as per the following:
•
All works cited in the text (including sources for tables and figures) should be listed alphabetically.•
Use (ed.) for one editor, and (ed.s) for multiple editors.•
When listing two or more works by one author, use --- (20xx), such as after Kohl (1997), use --- (2001), etc, in chronologically ascending order.•
Indicate (opening and closing) page numbers for articles in journals and for chapters in books.•
The title of books and journals should be in italics. Double quotation marks are used for titles of journal articles, book chapters, dissertations, reports, working papers, unpublished material, etc.•
For titles in a language other than English, provide an English translation in parentheses.•
The location of endnotes within the text should be indicated by superscript numbers.PLEASE USE THE FOLLOWING FOR STYLE AND PUNCTUATION IN REFERENCES: BOOKS
•
Bowersox, Donald J., Closs, David J., (1996), "Logistical Management." Tata McGraw, Hill, New Delhi.•
Hunker, H.L. and A.J. Wright (1963), "Factors of Industrial Location in Ohio" Ohio State University, Nigeria.CONTRIBUTIONS TO BOOKS
•
Sharma T., Kwatra, G. (2008) Effectiveness of Social Advertising: A Study of Selected Campaigns, Corporate Social Responsibility, Edited by David Crowther & Nicholas Capaldi, Ashgate Research Companion to Corporate Social Responsibility, Chapter 15, pp 287-303.JOURNAL AND OTHER ARTICLES
•
Schemenner, R.W., Huber, J.C. and Cook, R.L. (1987), "Geographic Differences and the Location of New Manufacturing Facilities," Journal of Urban Economics, Vol. 21, No. 1, pp. 83-104.CONFERENCE PAPERS
•
Garg, Sambhav (2011): "Business Ethics" Paper presented at the Annual International Conference for the All India Management Association, New Delhi, India, 19–22 June.UNPUBLISHED DISSERTATIONS AND THESES
•
Kumar S. (2011): "Customer Value: A Comparative Study of Rural and Urban Customers," Thesis, Kurukshetra University, Kurukshetra.ONLINE RESOURCES
•
Always indicate the date that the source was accessed, as online resources are frequently updated or removed.WEBSITES
VOLUME NO. 3 (2013), ISSUE NO. 03 (MARCH) ISSN 2231-5756
INTERNATIONAL JOURNAL OF RESEARCH IN COMMERCE, IT & MANAGEMENT
A Monthly Double-Blind Peer Reviewed (Refereed/Juried) Open Access International e-Journal - Included in the International Serial Directories
1
EXTENT OF ABSOLUTE POVERTY IN RURAL SECTOR OF HIMACHAL PRADESH: A MEASURE OF
UNEMPLOYMENT
RAMNA
ASST. PROFESSOR
SCHOOL OF HUMANITIES & SOCIAL SCIENCES
INDIAN INSTITUTE OF TECHNOLOGY
MANDI
ABSTRACT
Poverty, unemployment and inequality are related phenomenon. Success in solving or reducing one of these can be assumed to have a favorable effect on the others. Conceived in this broad sense, the alleviation of poverty in one form or the other has always occupied an important place in the list of stated objectives of all the five year plans of the country. The concern for a direct attack on the poverty problem emerged distinctly from the Fourth Plan from which various poverty elimination and employment generation programmes have been started. Yet, achievement has been for from satisfactory. The available data from different sources indicates that the condition of the poor continues to be as appealing as it was at the beginning of planning. This paper discusses the likely scenarios regarding the magnitude of poverty and unemployment in Himachal Pradesh. The extent of poverty/ unemployment has been worked out highest on the smaller size of holding and shows inverse relationship with an increase in the size of holdings. Policy interventions such as provision of non-farm permanent and seasonal employment, commercialization of agriculture, development of horticulture, animal husbandry, dairy development, forestry, cottage industry, art & craft industries, education & social services and public works etc. can benefit the chronically poor people.
KEYWORDS
household, man days, consumer unit.
INTRODUCTION
overty in India exists due to the slow pace of economic development as well as due to the unequal distribution of development gains. A large number of empirical studies conducted by the individual scholars and the Government agencies, by using different calorie norms and/or the value of poverty line put forth highly diverging figures of rural poverty. The concept of poverty in India has been used mostly in the sense of absolute poverty and has been measured in terms of a minimum level of per capita consumption expenditure needed to ensure a normative calorie intake. Poverty is found both in rural and urban areas but is more acute and widespread in rural areas. Moreover, urban poverty is an overflow of rural poverty. The incidence of poverty expressed as percentage of people below the poverty line in 1999-2000 is observed 27.1 percent in rural area and 23.6 percent in urban area. For the country as a whole, this percentage has been observed 26.1 percent during the same period. While in absolute term, the number of poor is observed 260 million with about 75 percent of these being in the rural areas for the same period. A number of studies revealed that the extent of poverty is higher in rural areas than in urban areas. A study by Minhas (1970) revealed that the extent of rural poverty was very high during 1956-57 i.e. 65 percent and this has been reduced to 56.6 percent during 1967-68. Ojha (1970) findings revealed that 51.8 percent of rural population was below poverty line during 1960-63 at calorie norm of 2250 per capita per day. Bardhan (1970) estimated that 38 percent during 1960-61 and 54 percent of the rural population was below poverty line during 1968-69. Dandekar and Rath (1971) by applying the minimum calories norm of 2250 per capita per day consumption expenditure during 1960-61, concluded that about 40 percent rural and 50 percent urban population falls below the poverty line. Hashim and Padam Singh (1986) studied the extent of rural poverty during 1960-61 to 1983-84. Their findings revealed that 55.50 percent of rural population was below poverty line during 1960-61 and 44.98 percent were below poverty line during 1970-71. This figure came to 40.40 percent during 1983-84. According to the Planning Commission of India the extent of poverty in rural India was 28.2 percent during 1989-90. Krishna (2003) found that a number of households had climbed out of poverty in the past 25 years. Simultaneously, however, a large number of previously non-poor households had also fallen into poverty, resulting in a rather small net improvement in the poverty situation in this area. Since the reasons for people overcoming poverty are quite distinct from the reasons why they succumb to it. Dev and Mahajan (2003) observed that employment growth recorded a drastic decline during 1993-94 to 1999-2000 as compared to the period of 1983-84 to 1993-94. Bhalla and Hazall (2003) on the basis of NSS data found that there were 3.98 million unemployed in India in 1973-74 and their number had increased to 7.49 million by 1993-94 and to as much as 9.15 million by 1999-2000. In the meantime the incidence of unemployment had increased from 1.64 percent in 1973-74 to 1.96 percent in 1993-94 and to 2.25 percent in 1999-2000. S.Mahendru et al.(2007) and Himanshu (2007 )by using the NNS data concluded almost same that in spite of higher overall growth, the extent of decline in poverty in the post reform period (1993-2005) has not been higher than in the pre-reform period (1983-1993) ,further they concluded that the inequality has increased significantly in the post reform period and seems to have slowed down the rate of poverty reduction but the extent of decline in 1995-05 seems to have been higher than in 1993-2000 in spite of slower growth in agriculture in the latter years. Datta (2008) worked out that the estimate of Head count ratio of poverty for 2005-06 to 2004-05, the decline in the Head count ratio between two years is 1.4 to 1.6 percent due to higher rate of economic growth rate accompanied by the impressive growth in the agriculture sector while the trend rate of decline between 1993-94 and 2004-05was 0.8 percent. Martin (2008) in his article discussed that in 2005, 40 percent of India’s population lived below poverty line whose consumption is less than $1.25 a day. While 25 years earlier 60 percent of India’s population lived below the same real line. This is clear progress. India’s long term pace of poverty reduction by this measure is no more than average for the developing world excluding China. Himanshu (2010) studied that estimates of the incidence of rural poverty show a head count ratio of 41.8 percent for 2004-05 as against the official estimate of 28.3 percent. The estimates reveal much larger rural-urban differences but less concentration of either rural or urban poverty in few states. In Himachal Pradesh 34.1 percent of population was living below the poverty line According to the study conducted by the federation of Chambers of Commerce and Industry in 1972. The extent of rural poverty in Himachal Pradesh on the basis of the value of poverty index for 1972-73 and 191972-73-74 has been calculated equal to 31.53 percent and 47.01 percent respectively (Sharma, 1982). Thakur (1985) concluded that on the basis of the value of poverty index the percentage of poor has been worked out 71.06, 50.65 and 26.34 percent on the marginal, small and medium size of holdings respectively. Ramna et al. (2008) worked out that the Percentage of poor on the marginal, small, medium and all holdings together are 43.46, 29.89, 20.17 and 33.53 percent respectively.
In this paper an attempt has been made to estimate the extent of poverty and unemployment in the rural sector of Himachal Pradesh with a view to achieve the following OBJECTIVES:
1. to study the socio-economic characteristics of the respondents,
2. to asses the extent of poverty & unemployment with the help of poverty/ income criterion; and
3. to pinpoint the causes of poverty / unemployment and to suggest measures for reducing the volume of poverty and unemployment.
DATA SOURCE & METHODOLOGY
Himachal Pradesh is a hilly State. Cropping pattern and agricultural income of the farmers vary according to altitude of the State. Therefore on the basis of altitude the cultivated land in the State has been categorized into three zones viz., (a) low hill zone, ranging between 1200- 3000 feet, (b) mid hill zone from 3000-5000 feet and (c) high hill zone of 5000 feet and above. In the valley areas of low hill zone, the main agricultural products are food grain, i.e., wheat, maize,
VOLUME NO. 3 (2013), ISSUE NO. 03 (MARCH) ISSN 2231-5756
INTERNATIONAL JOURNAL OF RESEARCH IN COMMERCE, IT & MANAGEMENT
A Monthly Double-Blind Peer Reviewed (Refereed/Juried) Open Access International e-Journal - Included in the International Serial Directories
2
paddy, pulses, sugarcane, oilseeds etc., whereas due to suitable topography and climatic conditions, the high hill zone of the state is widely known for horticultural products, viz., apple, seed potato, apricot, grapes, ginger, dry fruits etc. The agricultural activities in the mid-hill zone bear similarity in some areas to that of low-hill zone while in other areas to high hill zone. Therefore the present study is conducted in district Mandi of Himachal Pradesh because Mandi district falls in the mid hill zone of the state, so the topography, climatic conditions, access to resources as well as cropping, income, consumption and employment pattern in this district bear similarity to some area of low hill zone while, other area to high hill zone of the state. In order to provide the factual position of the problem, district Mandi from the mid-hill zone of the State has been selected purposely. A sample of 111 households consisting of 51 marginal having land <1 hectare, 40 small having land 1-2 hectares & 20 medium farmers having land above 2 hectares have been selected with the help of multistage random sampling. The required information has been collected from the sample households with the help of pre-tested schedule during 2002-03. After tabulating the data in homogenous categories and working out the averages and percentages, the following methods are applied with a view to find out the magnitude of poverty/ unemployment. The measure of poverty involves distinct problems. The first is the specification of the 'poverty line' i.e., which should be the value of consumption basket considered to represent the socially accepted 'minimum' standard of living. Once the poverty line is determined, the second step is that of determining an ‘Index of Poverty’. In the present study the poverty line has been determined on the basis of the value of minimum nutritional requirements, i.e. 2400 calories per consumer unit per day as has been suggested by the Government of India, Planning Commission and Indian Council of Medical Research. The value of minimum per consumer unit per day consumption basket (i.e. both out of home grown stock as well as out of purchases) has been calculated by multiplying quantities of different food items by their respective actual retail prices prevailing in the sample area during the period of investigation i.e. 2002-03. The total number of males, females and children of varying age have been converted into 'Standard Consumer Units' or adult male value by applying the scale of coefficient suggested by the Indian Council of Medical Research, e.g. a family consisting of father, mother and three children aged 10, 8, 6 years has an ‘adult male value’ or consumption units of 4.9 (i.e. 1.6+1.2+0.8+0.7+0.6). Keeping in view the hilly topography and the extreme climatic variations in the area under study the minimum food requirements are 'necessary' but not sufficient for the survival of mankind. Therefore, in order to work out the value of 'poverty line' allowances have also been made to the minimum non-food requirements by working out the ratios of total non-food expenditure to the total food expenditure for each holding group.RESULTS AND DISCUSSION
The results and discussion based on the first hand information are presented below; SOCIO-ECONOMIC CHARACTERISTICS OF RESPONDENTS
Demographic profile is an important indicator of determining the socio-economic well being of the family and society at large. In the study area total sample population has been worked out 635 persons. The family human labour days by converting into ‘standard mandays’ by attaching proper coefficient of efficiency have been worked out 173.75, 155.75, 86.25 and 415.75 on the marginal, small, medium and among all the holdings together respectively. Sex-ratio is an important indicator to know about the proportion of males and females in the total population and has been worked out 871, 1025, 1096 and 972 females per thousand males on the marginal, small, medium and among all the holding groups together respectively.
TABLE I: BASIC CHARACTERISTICS: SOME INDICATORS Size Class of Holdings
Sr. No. Particulars Marginal Holding Small Holding Medium Holding All Holdings
1. Total Number of Households 51 40 20 111
2.
Total Sample population
Male Female Total
139 121 260
120 123 243
63 69 132
322 313 635
3. Sex-ratio per thousand male 871 1025 1096 972
4. Average Size of Family 5.09 6.08 6.6 5.72
5. Percentage of Family workforce 65.38 60.91 59.09 62.36
6. Percentage of Dependents 34.62 39.09 40.91 37.64
7. Total Standard Mandays 173.75 155.75 86.25 415.75
8. Per Household Standard Mandays 3.41 3.89 4.31 3.75
9. Total Number of Consumer Units 308.3 277.7 153.7 739.7 10. Number of Per Household Consumer Units 6.05 6.94 7.69 6.67
11.
Literacy Percentage
Male 85.62 87.50 87.30 86.65
Female 64.46 75.61 75.36 71.25
Total 75.77 81.48 81.06 79.60
The average family size for the sample households has been worked out 5.09, 6.08, 6.6 and 5.72 on the marginal, small, medium and all holding groups together respectively. The percentage of family workforce (15-59 years) among the sample households has been worked out 65.38, 60.91, 59.09 and 62.36 percent on the respective size of holding groups. Total number of consumer units when converted into ‘Standard Consumption Units’ by applying the scale of coefficient suggested by the Indian Council of Medical Research have been worked out 308.3, 277.70, 153.70 and 739.70 on the marginal, small, medium and among all the holding groups together respectively. While the number of per household consumer unit came out 6.05, 6.94, 7.69 and 6.67 on the respective size of holding groups. While the percentage of literacy has been worked out 75.77, 81.48, 81.06 and 79.60 percent on the marginal, small, medium and all the holdings together respectively. This literacy percentage has been worked out lowest on the marginal size of holding mainly due to the reason that households falling on this holding size cannot afford to bear the expenses of education of their children due to meager household income and uneconomic size of holding. While households falling on the small and medium size of holdings can afford to make investment on the education of their children due to their sound and regular sources of income.
EXTENT OF ABSOLUTE POVERTY – A MEASURE OF UNEMPLOYMENT
The household consumption expenditure on both food and non-food items as well as the extent of absolute poverty which is used as a measure of unemployment among the sample households has been presented below.
VALUE OF POVERTY INDEX: A NUTRITION APPROACH
VOLUME NO. 3 (2013), ISSUE NO. 03 (MARCH) ISSN 2231-5756
INTERNATIONAL JOURNAL OF RESEARCH IN COMMERCE, IT & MANAGEMENT
A Monthly Double-Blind Peer Reviewed (Refereed/Juried) Open Access International e-Journal - Included in the International Serial Directories
3
TABLE – II: PER CONSUMER UNIT PER MONTH CONSUMPTION EXPENDITURE ON FOOD AND NON-FOOD ITEMS AMONG THE SAMPLE HOUSEHOLDSS.No. Items Size Class of Holdings (Value in Rs.)
Marginal Holding Small Holding Medium Holding All Holdings
1 Food Items 391.33 440.77 461.15 431.08
2 Non-Food Items 148.73 216.01 248.58 204.44
3 Food and Non-Food Items 540.06 657.70 709.73 635.52
4 % Expenditure on Food Items 72.46 67.02 64.98 67.83
5 % Expenditure on Non-Food Items 27.54 32.98 35.02 32.17 6 % Expenditure of Non-Food Items to Food Items 38.01 49.22 53.90 47.43 1. Per consumer unit per month Consumption Expenditure on Food Items = Rs.262.80.
2. Ratio of Non-Food Expenditure to Food Expenditure = Rs.47.43% i.e. Rs.124.65. 3. Value of Poverty Index (1+2) i.e. Rs.262.80 + Rs. 124.65 = Rs.387.45.
Among all the holdings together the value of per consumer unit per month consumption expenditure on food items came out Rs. 431.08. While the per consumer unit per month actual consumption expenditure on non-food items has been worked out Rs. 148.73, 216.01, 248.58 and Rs.204.44 on the marginal, small, medium and among all the holding groups together respectively. This table further shows that the percentage of per consumer unit per month consumption expenditure on non-food items to food items has been worked out 38.01, 49.22, 53.90 and 47.43 percent on the marginal, small, medium and among all the holding groups together respectively. The percentage of per consumer unit per month consumption expenditure on non-food items to food items has been worked out lowest on the marginal size of holding and shows an increasing tendency with an increase in the size of holdings. This happened mainly due to the fact that marginal farmers have uneconomic size of holdings, meagre household income and lack of gainful employment opportunities & vice versa.
VALUE OF POVERTY INDEX: A NUTRITION PLUS APPROACH
Minimum food requirement is necessary but not sufficient for the survival of mankind. Like the minimum food requirement a certain minimum amount of non-food items is equally important for the survival of mankind. No specific norm comparable to 'minimum calorie requirements' has so far been suggested by any Government agency or individual scholar for non-food items. But in the present study due consideration has been given to the non-food items such as fuel, light, clothing, footwear, health, education, fairs and festivals etc. The minimum non-food requirements vary from region to region due to variation in the topography, climatic conditions, nature, type and intensity of economic activities carried out. Therefore, in this study in order to find out the value of poverty index the value of minimum non-food requirements has been worked out by calculating the ratio of total non-food expenditure to the minimum food expenditure. The per consumer unit per month consumption expenditure on food and non-food items among the holding groups consisting of poor has been worked out Rs. 431.08 and Rs. 204.44 respectively. Thus the ratio of non-food expenditure to food expenditure among the holding groups consisting of poor came out 47.43 percent (see table II). This ratio has been suggested by different individuals for different areas. Sastry and Suryanarayana (1981) have suggested 36 percent for the rural areas and 46 percent for the urban areas of Andhra Pradesh as the minimum monthly expenditure on non-food components to the food components. Thakur (1985) have suggested 46.63 percent of the rural poor of Himachal Pradesh as the minimum monthly expenditure on non-food components to food components. Sharma (1994) have suggested 65 percent for the tribal poor of Kinnaur District of Himachal Pradesh as the minimum monthly expenditure on non-food components to the food components. Sharma (1997) have suggested 65 percent for the tribal poor and 54 percent for the non-tribal poor of Chamba District of Himachal Pradesh as the minimum monthly expenditure on non-food items. In the present study the minimum non-food requirements to the poor in the study area has been worked out 47.43 percent. This percentage is higher to the percentage (i.e., 46.63 %) suggested by Thakur for the rural Himachal Pradesh and Sastry and Suryanarayana (i.e., 36%) for the rural Andhra Pradesh. The comparatively higher ratio of non-food expenditure in the present study came out mainly due to manifold increase in prices of non-food items like cloth, footwear, light, fuel, medicines as well as increase in fee in educational institutions. In order to determine the value of poverty index both minimum expenditure on food and non-food items has been calculated. Hence, the value of both minimum food and non-food requirements (i.e., Nutrition Plus Approach) has been worked out Rs. 387.45 (i.e., 262.80 for food items + Rs. 124.65 for non-food items). With the help of 'Nutrition Approach' i.e. by taking into account the value of minimum food requirements by providing 2400 calories per consumer unit per day the value of poverty index has been worked out Rs. 262.80. According to this 'poverty' or 'income criterion' all those persons who earn income less than the value of poverty index i.e., 262.80 are termed unemployed and/or underemployed as has been shown in Table II. Thus by applying this 'poverty' or 'income criterion' the percentage of unemployed and/or underemployed has been worked out 33.41, 23.41, 17.57 and 26.36 percent on the marginal, small, medium and among all the size of holdings together respectively (see Table III).
TABLE – III: PERCENTAGE OF POOR/ UNEMPLOYED BY SIZE CLASS OF HOLDINGS ON THE BASIS OF PER CONSUMER UNIT PER MONTH FOOD EXPENDITURE AT 2002-2003 PRICES
S.No. Items Size Class of Holdings (Value in Rs.)
Marginal Holding Small Holding Medium Holding All Holdings
1 Total Number of Persons 308.30 277.70 153.70 739.70
2 Total Number of poor/unemployed Persons 103.00 65.00 27.00 195.00 3 Percentage of Poor/unemployed 33.41 23.41 17.57 26.36
While with the help of 'nutrition plus approach' the percentage of poor has been worked out 43.46, 29.89, 20.17 and 33.53 percent on the marginal, small, medium and among all the holdings groups together respectively (see Table – IV).
TABLE – IV: PERCENTAGE OF POOR/UNEMPLOYED BY SIZE CLASS OF HOLDINGS ON THE BASIS OF PER CONSUMER UNIT PER MONTH FOOD AND NON-FOOD EXPENDITURE AT 2002-03 PRICES
S.No. Items Size Class of Holdings (Value in Rs.)
Marginal Holding Small Holding Medium Holding All Holdings
1 Total Number of Persons 308.30 277.70 153.70 739.70
2 Total Number of poor/unemployed Persons 134.00 83.00 31.00 248.00 3 Percentage of Poor/unemployed 43.46 29.89 20.17 33.53
It is obvious from the given tables (i.e., III & IV) that the percentage of poor according to 'nutrition approach' is lower than the percentage of poor according to 'Nutrition Plus Approach'. The poverty or 'income criterion' of unemployment can be worked out by taking into account only the value of minimum food items providing 2400 calories per consumer unit per day (i.e. the 'nutrition approach') because it ignored the expenditure made on non-food items such as clothing, footwear, light, fuel, health, education, fairs and festivals etc. While calculating the value of poverty index which is equally important for the survival of human being. Therefore, from the policy point of view the 'Nutrition plus approach' is more reliable to work out the value of poverty index or income criterion of unemployment and thereby the percentage of poor and/ or unemployed.
CONCLUSION AND SUGGESTIONS
VOLUME NO. 3 (2013), ISSUE NO. 03 (MARCH) ISSN 2231-5756
INTERNATIONAL JOURNAL OF RESEARCH IN COMMERCE, IT & MANAGEMENT
A Monthly Double-Blind Peer Reviewed (Refereed/Juried) Open Access International e-Journal - Included in the International Serial Directories
4
of holdings. Uneconomic size of holdings, lack of regular and seasonal gainful employment opportunities, higher dependency and low literacy percentage, lack of irrigation facilities, uncertainty of rain and lack of awareness of the rural people etc. are the main causes of poverty/unemployment in the study area. In spite of various poverty alleviation programmes the desired objective of reducing rural poverty has not been achieved due to wrong identification of beneficiaries, administrative failures and poor delivery system, lack of adequate infrastructural facilities and lack of people's participation in effective implementation of these programmes. Thus in order to reduce the extent of poverty/unemployment emphasis should be laid down on the soil and water conservation, minor irrigation, rural roads and land reforms in the infrastructure sector; drinking water supply, general education, technical education and health in the social service sector; horticulture, animal husbandry, dairy development, forestry in the agricultural sector and small scale & cottage industries in the industrial sector etc.REFERENCES
1. Andre Beteille, "Poverty and Inequality", Economic and Political Weekly, Delhi, PP. 4455-4463.
2. Anirudh Krishna (2003), “Falling into Poverty: Other Side of Poverty Reduction”, Economic and Political Weekly, Delhi, PP.533-541. 3. Bardhan, P. K (1970), “On the Minimum Level of Living and the Rural Poor”, Indian Economic Review.
4. Bhalla, G. S. and Hazell Peter (2003), “Rural, Employment and Poverty: Strategies to Eliminate Rural Poverty Within a Generation”, Economic and Political Weekly, Delhi, PP.3473-3484.
5. Daaton Angus and Dreze Jean (2010), “Nutrition, Poverty and Calorie Fundamentalism: Response to Utsa Patnaik,” Economic and Political Weekly, Delhi, Vol., XLV, No. 14, PP.78-80.
6. Dandekar, V. M. and Rath, Nilkantha (1971): Poverty in India, Indian School of Political Economy.
7. Datta, K. L. (2008), “An Estimate of Poverty Reduction between 2004-05 and 2005-06,” Economic and Political Weekly, Delhi, Vol., XLIII, No. 43, PP. 61-67. 8. Department of Economic and Social Affairs, Poverty, Unemployment and Development Policy: A Case Study of Selected Issues with Reference to Kerala,
(United Nations, New Yourk, 1975), P.7.
9. Directorate of Economics and Statistics, Symposium on Social and Economic Problems of Hilly Areas, Simla, 1974, pp. 91 and 96.
10. Gopalan, C., Ramashastri, B. V. and Balasubramaniam, S.C. (1980), the Nutritive Value of Indian Foods, Indian Council of Medical Research, Hyderabad, P.10.
11. Government of India, Draft Fifth Five Year Plan 1978-83, Vol-II, Planning Commission, New Delhi, 1978, P.36. 12. Government of India, Planning Commission, Draft Eighth Five Year Plan 1992-97, New Delhi, 1992. 13. Government of India, Planning Commission, Draft Seventh Five Year Plan 1985-90, New Delhi, 1990. 14. Government of India, Tenth Five-Year Plan, 2002-07, Planning Commission, New Delhi, 2002.
15. Himanshu (2007), “Recent Trends in Poverty and Inequality: Some Preliminary Results,” Economic and Political Weekly, Delhi, Vol., XLII, No. 6, Feb.10, PP. 497-507.
16. Himanshu (2008), “What are These New Poverty Estimates and What Do They Imply ?” Economic and Political Weekly, Delhi, Vol., XLII, No. 43, PP.38-43. 17. Himanshu (2010),”Towards New Poverty Lines for India,” Economic and Political Weekly, Delhi, Vol., XLV, No. 1, PP.38-48.
18. Mahendra, S. Dev and Mahajan, Vijay (2003), “Employment and Unemployment”, Economic and Political Weekly, Delhi, PP.1252-1261.
19. Mahendradev,S. and Ravi, C. (2007), “Poverty and Inequality: All India and States, 1983-2005,” Economic and Political Weekly, Delhi, Vol., XLII, No. 6, Feb.10, PP. 509-521.
20. Minhas, B. S. (1970), “Rural Poverty, Land Redistribution and Development”, Indian Economic Review, Vol.V, No.1, April, reprinted in Sankhya, Series C, Vol. 36, 1974, pp.252-263 also see in B.S. Minhas: Planning and the Poor, S. Chand & Co., 1974, Chapter II, pp. 63-101.
21. Ojha, P. D. (1970), A Configuration of Indian Poverty: Inequality and Levels of Living, Reserve bank of India Bulletin, January.
22. Ramna and Sikander Kumar, (2008 ) “Measurement of Poverty and Income Inequality in the Mid-Hill Zone Agrarian Economy of Himachal Pradesh- Normative and Positive Approach,” Indian Journal of Economics, Allahabad, Vol.LXXXVIII, No. 351, PP. 611-632.
23. Ravallion Martin (2008), “A Global Perspective on Poverty in India,” Economic and Political Weekly, Delhi, Vol., XLII, No. 43, PP.31-37.
24. Sastry, S.A.R. and Suryanarayan, T. (1981), Optimum Diet and Poverty Line, in Employment, Poverty and Public Policy, (ed.) Sardar Patel Institute of Economic and Social Research, Allied Publishers, New Delhi, pp. 97-116.
25. Sharma, K. C. (1994), Poverty, Unemployment and Inequalities in Tribal India: With Special Reference to Himachal Pradesh, Reliance Publishing House, New Delhi, pp. 151-247.
26. Sharma, L. R. (1982), “Poverty and Inequality in the Rural Sector of Himachal Pradesh” Economic Affairs, Vol.27, No.7-9, Calcutta. 27. Sharma, Shiv Dyal (1997), Dimensions and Dynamics of Poverty in India, Mohit Publications, New Delhi, pp.168-193.
28. Singh, S. R. (1986), “How to Improve Rural Scenario Faster?”, Yojna, New Delhi.
VOLUME NO. 3 (2013), ISSUE NO. 03 (MARCH) ISSN 2231-5756
INTERNATIONAL JOURNAL OF RESEARCH IN COMMERCE, IT & MANAGEMENT
A Monthly Double-Blind Peer Reviewed (Refereed/Juried) Open Access International e-Journal - Included in the International Serial Directories
5
THE ENTREPRENEURSHIP CORE COMPETENCES FOR DISTRIBUTION SERVICE INDUSTRY
SU-CHANG CHEN
PROFESSOR
NATIONAL PENGHU UNIVERSITY OF SCIENCE & TECHNOLOGY
TAIWAN
HSI-CHI HSIAO
CHAIR PROFESSOR
CHENG SHIU UNIVERSITY
TAIWAN
JEN-CHIA CHANG
PROFESSOR
NATIONAL TAIPEI UNIVERSITY OF TECHNOLOGY
TAIWAN
CHUN-MEI CHOU
PROFESSOR
NATIONAL YUNLIN UNIVERSITY OF SCIENCE & TECHNOLOGY
TAIWAN
CHIN-PIN CHEN
ASSOCIATE PROFESSOR
NATIONAL CHANGHUA UNIVERSITY OF EDUCATION
TAIWAN
CHIEN-HUA SHEN
PROFESSOR
TRANSWORLD UNIVERSITY
TAIWAN
ABSTRACT
Entrepreneurship has emerged as the most potent economic force. The focus of economic development has shifted more heavily toward entrepreneurship. The distribution service industry is very important in Taiwan, so to explore the entrepreneurship core competency for distribution service industry is became an important issue. This study aims to understand the entrepreneurship core competencies for distribution service industry. This study used the in-depth interview techniques to interview with 6 successful entrepreneurs who established their own stores over 3 years. Then, this study conducted group discussion to confirm the domains, items and criteria of entrepreneurship core competences for distribution service industry. Base on the interview and group discussing results, this study summarized the 11 entrepreneurship core competencies including the cognitive of entrepreneurial processes, entrepreneurial traits/behaviors, business foundation skills, communication skills, digital skills, professional innovation, financial management, human resource management, marketing management, operations management and risk management, within three domains as entrepreneurial skills, ready skills, and business functions skills.
KEYWORDS
Distribution Service Industry, Entrepreneurship, Entrepreneurship Core Competences.
INTRODUCTION
ntrepreneurship has been recognized and accepted by economies the world over as the catalyst to boost innovation and growth for an economy (Biju & Vardhan, 2011). It has emerged as the most potent economic force. The focus of economic development has shifted more heavily toward entrepreneurship (Raposo & Paco, 2011).In other words, national incomes and change of unemployed population significantly and positively influence entrepreneur development (Hsiao et al., 2012a). The European Union (UN) considered that the entrepreneurship was one of the “new basic skills” in the economic life (European Commission, 2006). Nowadays, entrepreneurship has become the key word that attaches great attention by governments and workers (Liu & Hu, 2010).
The entrepreneurs are not inherent, the skills and knowledge of entrepreneurial abilities can be learned (Okudana & Rzasa, 2006). Rasmussen and Sorheim (2006) pointed out that it was possible to educate individuals to become entrepreneurs. According to the 2009 SME White Paper on SMEs in 2008, the business over 10 years was only 45.1% in Taiwan (Ministry of Economic Affairs, 2009). It seen entrepreneurship does have a high risk, not every entrepreneur can succeed. Headd (2003) indicated that the failure rates for starting a new business might be as high as 30% over the first 2 years of established. People can make higher survival of starting a business if they accepted well entrepreneurial education before starting a business (Shepherd, Douglas, & Shanley, 2000; Hsiao et al., 2012a, 2012b).
VOLUME NO. 3 (2013), ISSUE NO. 03 (MARCH) ISSN 2231-5756
INTERNATIONAL JOURNAL OF RESEARCH IN COMMERCE, IT & MANAGEMENT
A Monthly Double-Blind Peer Reviewed (Refereed/Juried) Open Access International e-Journal - Included in the International Serial Directories
6
value, wholesale and retail trade in 2000 amounted to US$ 0.3 trillion in 2011 reached US$ 0.475 trillion, the 10-year growth of 58.6% (Statistics Department, Ministry of Economic Affairs, 2012), this means that SMEs, especially for service, play an important role for Taiwan’s economics.Taiwan’s government announced “The Ministry of Economic Affairs and Services roadmap” in October 2012. It will promote the guiding blueprint for wholesale and retail, logistics services, that is expected to spend US$ 10 billion during the period to 2020. The service sector GDP annual growth rate will reach to 5.14% and the services sector will become to promote sustained economic growth engine in Taiwan (Ministry of Economic Affairs, 2012). The distribution service industry is very important service type in Taiwan (Chen, 2006), so to explore the entrepreneurship core competency for distribution service industry is became an important issue.
OBJECTIVE
The object of this study was to understand the entrepreneurship core competencies for distribution service industry.
REVIEW OF LITERATURE
DEFINITION OF ENTREPRENEURSHIP
The term of entrepreneurship was from the 12th
century French compound verb entreprendre (entre + prendre). In modern English, it means “to undertake” (Hoang & Huang, 2008; Hsiao et al., 2012a). The European Commission had defined in 2006 as: “Refers to an individual's ability to turn ideas into action” (European Commission, 2006). The European Commission made another definition in 2009 as “Entrepreneurship is an attitude that reflects an individual’s motivation and capacity to identify an opportunity and to pursue it in order to produce new value or economic success (European Commission, 2009). In the Oxford English Dictionary defined entrepreneurship as “A person who sets up a business or businesses, taking on financial risks in the hope of profit” (Soanes & Stevenson, 2006; Hsiao et al., 2012a).
Entrepreneurship is the act of creating a new business (Liu & Hsieh, 2006). It includes creativity, innovation and risk taking, as well as the competences to plan and manage projects in order to achieve target. Shane and Venkataraman (2000) said that entrepreneurship was entrepreneurs use entrepreneurship, discovery, assessment, or create opportunities. Lo, Wang and Hsu (2007) gave a definition of entrepreneurship as a process of creating profit. In this process, entrepreneurs can identify, and discover business opportunities. Ulhøi (2005) considered that the entrepreneurs were to take advantage and identify of starting a new business opportunities and willing to take risks. Entrepreneurship was not only in the creation of new business but also the source of personal and social development and innovation (Brush et al., 2004). General speaking, Hsiao et al. (2012b) aggregated entrepreneurship as a combination of production factors including labor, capital, technology, management and knowledge. It also included creativity, innovation and risk taking, as well as the competences to plan create, assess or discover business opportunities and manage projects in order to achieve object.
ENTREPRENEURIAL COMPETENCES
Competency can refer to the individual's effective implementation, it can play the role of a good job, qualified for the duties and tasks, and it can be observed. Competences usually contain knowledge, affective and skills (Tien, 2001).
The Consortium for Entrepreneurship Education designs a National Content Standards for entrepreneurial competences standards. There are fifteen major standards, which are divided into three major skills: entrepreneurial skills, ready skills and business functions skills (The Consortium for Entrepreneurship Education, 2004; Hsiao et al., 2012b). The entrepreneurial skills are the unique traits, behaviors and processes that differentiate an entrepreneur from an employee or manager. It includes entrepreneurial processes, entrepreneurial traits/behaviors. The ready skills are the business, or entrepreneurial, knowledge and skills that are prerequisites or co-requisites for the study of entrepreneurship. It includes business foundations, communications and interpersonal skills, digital skills, economics, financial literacy, professional development. Business functions skills are the business activities performed in starting and running a business. It includes financial management, human resource management, information management, marketing management, operations management, risk management, strategic management (The Consortium for Entrepreneurship Education, 2004). Townsend, Busenitz and Arthurs (2010) indicated that ability expectancies were a robust predictor of starting a business decision. Zhang (2008) believed that the entrepreneurs should have adventurous, entrepreneurial ability, independent operational capability, as well as technical, social and management capabilities.
The entrepreneurial competences should be able to distinguish into three competences that were the entrepreneurial professional competence, entrepreneurial basic capacity and entrepreneurial management capacity (Chang et al., 2012). Hindle (2007) proposed in the entrepreneurship program, the business plan course was required for covering the professional skills and the external environment of the wheel-like diagram. He considered that entrepreneurship education could not be off campus within the ivory tower of academia. Entrepreneurship education must link with external resources. In the most peripheral alliance partners, Internet, alumni and tutors to help students learn. In the second ring, the students must have entrepreneurial professional courses including marketing, sales, organizational behavior, strategy, business development, opportunity assessment, financial and accounting, creativity and other professional skills training. Schools may be developed their own characteristics courses. In the inner ring, it can integrate all knowledge and skills by business plan. Hood & Young (1993) survey 100 CEO, pointed out that marketing was the most important areas of entrepreneurship, leadership was entrepreneurial core skills, and creativity was the most important cognitive skills in the entrepreneurial. In Chandler and Jansen (1992) survey, they found that entrepreneurs should have five abilities that were organizational behavior, the ability to grasp the opportunities, the ability of the operational assets, professional and technical capabilities and knowing people ability. American Association of Business and Management in 2001 referred to the entrepreneurial abilities including the ability of entrepreneurs and entrepreneur’s opportunity, marketing capabilities, economics capabilities, financial capabilities, accounting capabilities, management capabilities, global market capabilities, legal capabilities and enterprise planning capabilities (Chou, 2005).
Sung (2008) pointed out that started a new business could be divided into six stages: new venture idea, screening, formal plans, financing, set up and start-up. The various stages of the required knowledge and skills are shown in table 1. It can be seen from table 1 that in the early days of the new venture idea stage, entrepreneurs should have creative thinking, innovation management ability and creativity commercialization assessment capabilities. In the screening stage, entrepreneurial vision assessment, evaluation of the investment is very important. In the planning stage, the entrepreneur must have a business plan writing and assessment capacity. In the financial stage, entrepreneurs need to have the ability to get funds and the ability to make financial planning and investment framework arrangement. In the set-up stage, entrepreneurs must clearly understand the knowledge of the Companies Act and the protection of intellectual property rights. In the start-up stage, knowledge and skills of production, service, finance, sales, control and management, strategic planning, leadership are needs.
TABLE 1: VARIOUS STAGES OF THE REQUIRED KNOWLEDGE AND SKILL FOR STARTING A NEW BUSINESS Stages required knowledge and skill
New Venture Idea creative thinking, innovation management ability, creativity commercialization assessment Screening assessment of entrepreneurial vision, investment assessment
Formal Plans prepare a business plan, venture proposal assessment Financing financial planning, how to arrange the investment framework
Set Up the protection of intellectual property rights, the legal form of the various companies
Start-Up produce, service, finance, sales, control and management, strategic planning, leadership knowledge and skills Source: Sung(2008), p.88。
VOLUME NO. 3 (2013), ISSUE NO. 03 (MARCH) ISSN 2231-5756
INTERNATIONAL JOURNAL OF RESEARCH IN COMMERCE, IT & MANAGEMENT
A Monthly Double-Blind Peer Reviewed (Refereed/Juried) Open Access International e-Journal - Included in the International Serial Directories
7
store shopping district operations, store customer service management, retail crisis handling eight (Central office of the Council of Labor Affairs, 2006). It can be regarded as the entrepreneurial professional competence s for the distribution service industry.RESEARCH METHODOLOGIES
The implementation of this study included two stages. First, six successful entrepreneurs were interviewed. Their stores all established over three years. The background of them is shown in table 2. The interview questionnaire is revised from The National Content Standards for Entrepreneurship Education (Consortium for Entrepreneurship Education, 2004). After collecting the interview data, the researchers used entrepreneurial skills, ready skills and business functions skills as the analytic domains. And in entrepreneurial skillsincludes entrepreneurial processes, entrepreneurial traits/behaviors two items; in ready skills includes business foundations, communications skills, digital skills, and professional innovation ability four items; in business functions skills includes financial management, human resource management, marketing management, operations management, and risk management five items. Subsequently, definitions for these domains and items were used as objective criteria for selection. When the sentence fitted the criteria, it was drawn to the corresponding item. After the assortment, the core competence for distribution service industry was established for further discussion.
Secondly, the researchers conducted group discussion to confirm the domains, items and criteria of entrepreneurship core competences for distribution service industry.
TABLE 2: THE BACKGROUND OF SUCCESSFUL ENTREPRENEURS No Sexual Education Experience Category A M junior college 9 yr. convenience store B M Senior vocational high school 10 yr. convenience store C M Senior vocational high school 23 yr. specialty store D F University 3 yr. beverages store E F University 3 yr. breakfast store F F Senior vocational high school 3 yr. beverages store
RESULTS
Table 3 is the summaries of the core competencies for distribution service industry entrepreneurs. The domains of entrepreneurship core competences for distribution service industry include entrepreneurial skills, ready skills and business functions skills.
There are 11 items in these domains. The entrepreneurial skills mean the unique traits, behaviors and processes that differentiate an entrepreneur from an employee or manager. Itincludes entrepreneurial processes, entrepreneurial traits/behaviors two items.
The ready skills mean the basic business knowledge and skills that are prerequisites or co-requisites for becoming a successful entrepreneur; it includes business foundations, communications skills, digital skills, and professional innovation ability four items.
The business functions skills mean the business activities performed in starting and running a business. It includes financial management, human resource management, marketing management, operations management, and risks management five items.
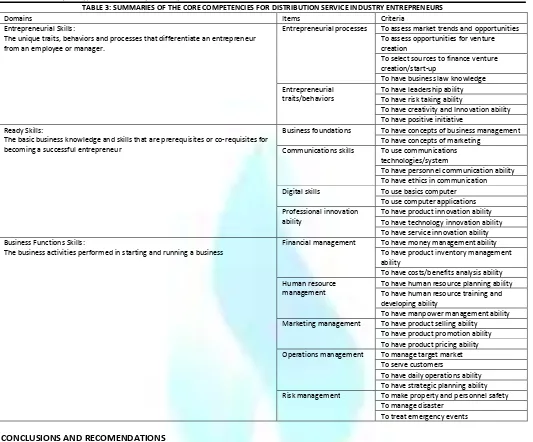
There are 34 criteria in these items. In entrepreneurial processes, there are 4 criteria that are to assess market trends and opportunities, to assess opportunities for venture creation, to select sources to finance venture creation/start-up, and to have business law knowledge.
In entrepreneurial traits/behaviors, there are 4 criteria that are to have leadership ability, to have risk taking ability, to have creativity and Innovation ability, and to have positive initiative.
In business foundations, there are 2 criteria that are to have concepts of business management and to have concepts of marketing.
In communications skills, there are 3 criteria that are to use communications technologies/system, to have personnel communication ability and to have ethics in communication.
In digital skills, there are 2 criteria that are to use basics computer and to use computer applications
In professional innovation ability, there are 3 criteria that are to have product innovation ability, to have technology innovation ability and to have technology innovation ability.
In financial management, there are 3 criteria that are to have money management ability, to have product inventory management ability and to have costs/benefits analysis ability
In human resource management, there are 3 criteria that are to have human resource planning ability, to have human resource training and developing ability and to have manpower management ability.
In marketing management, there are 3 criteria that are to have product selling ability, to have product promotion ability and to have product pricing ability. In operations management, there are 4 criteria that are to manage target market, to serve customers, to have daily operations ability and to have strategic planning ability.
VOLUME NO. 3 (2013), ISSUE NO. 03 (MARCH) ISSN 2231-5756
INTERNATIONAL JOURNAL OF RESEARCH IN COMMERCE, IT & MANAGEMENT
A Monthly Double-Blind Peer Reviewed (Refereed/Juried) Open Access International e-Journal - Included in the International Serial Directories
8
TABLE 3: SUMMARIES OF THE CORE COMPETENCIES FOR DISTRIBUTION SERVICE INDUSTRY ENTREPRENEURSDomains Items Criteria
Entrepreneurial Skills:
The unique traits, behaviors and processes that differentiate an entrepreneur from an employee or manager.
Entrepreneurial processes To assess market trends and opportunities To assess opportunities for venture creation
To select sources to finance venture creation/start-up
To have business law knowledge Entrepreneurial
traits/behaviors
To have leadership ability To have risk taking ability
To have creativity and Innovation ability To have positive initiative
Ready Skills:
The basic business knowledge and skills that are prerequisites or co-requisites for becoming a successful entrepreneur
Business foundations To have concepts of business management To have concepts of marketing
Communications skills To use communications technologies/system
To have personnel communication ability To have ethics in communication Digital skills To use basics computer
To use computer applications Professional innovation
ability
To have product innovation ability To have technology innovation ability To have service innovation ability Business Functions Skills:
The business activities performed in starting and running a business
Financial management To have money management ability To have product inventory management ability
To have costs/benefits analysis ability Human resource
management
To have human resource planning ability To have human resource training and developing ability
To have manpower management ability Marketing management To have product selling ability
To have product promotion ability To have product pricing ability Operations management To manage target market
To serve customers
To have daily operations ability To have strategic planning ability Risk management To make property and personnel safety
To manage disaster To treat emergency events
CONCLUSIONS AND RECOMENDATIONS
Base on the interview and group discussing, this study summarized the 11 entrepreneurship core competencies for the distribution service industry, including the cognitive of entrepreneurial processes, entrepreneurial traits/behaviors, business foundation skills, communication skills, digital skills, professional innovation, financial management, human resource management, marketing management, operations management and risk management, within 3 domains as entrepreneurial skills, ready skills, and business functions skills. In the planning of entrepreneurship education courses, the marketing and distribution management department of universities can reference these competences. If these entrepreneurship core competencies directory set into curriculum and to reinforce existing courses. It will be better able to meet the needs of future students towards entrepreneurial path.
This study explores on distribution service industry. It is recommended that future researchers can follow this research process to copy to other industries. It can make a comparison between industries, such like service industry and manufacture industry. It can find out what same or differences between them.
This study is focus on micro-enterprise entrepreneurs. It does not cover large distribution industry enterprises. The entrepreneurship