VOLUME NO. 3 (2013), ISSUE NO. 10 (OCTOBER) ISSN2231-5756
A Monthly Double-Blind Peer Reviewed (Refereed/Juried) Open Access International e-Journal - Included in the International Serial Directories
Indexed & Listed at:
VOLUME NO. 3 (2013), ISSUE NO. 10 (OCTOBER) ISSN2231-5756
INTERNATIONAL JOURNAL OF RESEARCH IN COMMERCE, IT & MANAGEMENT
A Monthly Double-Blind Peer Reviewed (Refereed/Juried) Open Access International e-Journal - Included in the International Serial Directories
http://ijrcm.org.in/
ii
CONTENTS
CONTENTS
CONTENTS
CONTENTS
Sr.No.
TITLE & NAME OF THE AUTHOR (S)
Page No. 1. MACHINE USAGE BASED ON PRODUCT MIX IN MANUFACTURING CLASSIFICATIONS
DR. SURESH TULSHIRAM SALUNKE & SHWETA SURESH TULSHIRAM SALUNKE
1
2. A STUDY ON THE CHALLENGES FACED BY TIRUPUR GARMENT EXPORTERS
DR. S. SARANANAN & S. MOHANRAJ
5
3. HEALTHCARE AND MEDICAL TOURISM: RETROSPECT AND PROSPECT
R. VEERAPPAN, J. SASIGANTH, FR. ANGELO JOSEPH & A. JOE ROBINSON
8
4. TRADE BETWEEN INDIA AND ASEAN COUNTRIES FOR AGRICULTURAL AND MINERAL PRODUCTS: EXPLORING COMPATIBILITY THROUGH REVEALED COMPARATIVE ADVANTAGE
DR. B. P. SARATH CHANDRAN
11
5. RELEVANCE OF ISLAMIC BANKING TO INDIAN ECONOMY
S. NAYAMATH BASHA & DR. BADIUDDIN AHMED
17
6. AXIOMATIZATION OF THE PREFERENCE CORE IN MULTICRITERIA COOPERATIVE GAMES
A. SUGUMARAN & P. VISHNU PRAKASH
21
7. CORPORATE GOVERNANCE & INFORMATION SECURITY: AN ANALYTICAL STUDY
DR. BADIUDDIN AHMED, SYED HAMID MOHIUDDIN QUADRI & IRFANUDDIN
25
8. RUPEE FALLING: DOLLAR IS ON HORSE RIDE
M. RAMU, M. S. K. VARMA & S.SUDHEER
28
9. AN ANALYSIS OF INDIAN AUTOMOBILE INDUSTRY: SLOWDOWN AS AN OPPORTUNITY FOR NEW DEVELOPMENT
DR. ANKUR KUMAR RASTOGI & NITIN GOPAL GUPTA
36
10. A PROPOSED THEORY OF NEURAL NETWORKS IN KNOWLEDGE MANAGEMENT FOR AN EXPERT SYSTEM
V. SUMALATHA
41
11. THE INFORMATION MANAGEMENT PRACTICES OF BHIRDAR UNIVERSITY
DR. MATEBE TAFERE
45
12. VEBLENIAN SOCIO-PSYCHOLOGICAL MODEL: AN ETHNOGRAPHIC STUDY
DR. K. ABRAHAM & DR. M. RAJASEKHAR
51
13. INNOVATIVE TEACHING AND LEARNING TO ENHANCE CRITICAL THINKING AND REFLECTIVE PRACTICE, FOR QUALITY AND RELEVANCE OF HEALTH EDUCATION
DR. BIRHANU MOGES ALEMU
56
14. A STATISTICAL ANALYSIS OF PHYSICALLY DISABLED POPULATION: DEVELOPMENT IN REHABILITATION SCHEMES
DR. CHINNA ASHAPPA
68
15. USE OF E-JOURNALS IN THE DISCIPLINES OF LIFE SCIENCE IN K.U.K: AN ANALYTICAL STUDY
ANIL KUMAR
72
16. ISLAMIC MICROFINANCE-FINANCING THE POOREST OF THE POOR
DILAWAR AHMAD BHAT
79
17. USE OF CLOUD COMPUTING IN MANUFACTURING COMPANIES
SHEETAL MAHENDHER & SUBASHREE
83
18. CLIMATE CHANGE AND VECTOR BORNE DISEASES: THE ROLE OF GIS & REMOTE SENSING
DIVYA GEORGE & DR. R. RAJKUMAR
88
19. FEASIBILITY STUDY FOR IMPLEMENTATION OF AN ACTIVITY- BASED COSTING SYSTEM (ABCS) IN ALLOY STEEL INDUSTRIES (ASI)
MAJID NILI AHMADABADI & ALI SOLEIMANI
96
20. AN IMPACT OF SERVICE QUALITY ON LOYAL CUSTOMER AND ITS SATISFACTION: A STUDY OF PRIVATE BANKS IN KANPUR CITY (INDIA)
RAVINDRA KUMAR KUSHWAHA, GURPREET SINGH, NEERAJ JOSHI & NEHA PUSHPAK
101
21. A STUDY ON EMPLOYEE PERFORMANCE APPRAISAL IN CEMENT INDUSTRY IN TAMILNADU
DR. M. RAGURAMAN, R. VEERAPPAN, S. ALBERT, M. SUGANYA & S. HEMAVATHY
107
22. DETERMINANTS OF MOBILE BANKING TECHNOLOGY ADOPTION OF COMMERCIAL BANKS IN ETHIOPIA
ZEMENU AYNADIS, TESFAYE ABATE & ABEBE TILAHUN
110
23. EVALUATION OF LIC’S EFFICIENCY IN GENERATING CAPITAL FUNDS UNDER ULIP’S SCHEMES
MANJUSHREE S
117
24. EVALUATION OF COST MANAGEMENT TOOLS: A STUDY ON MULTINATIONAL PHARMACEUTICAL COMPANIES OF BANGLADESH
TAHMINA AHMED
120
25. AN EVALUATION OF NEW ZEALAND’S EXPORT COMPETITIVENESS USING SHIFT-SHARE ANALYSIS
DR. SATYA GONUGUNTLA
126
26. INCREASING INTERNATIONAL COLLABORATIONS IN SCIENCE AND TECHNOLOGY AROUND THE WORLD, AND ITS PATTERNS IN INDIA WITH SPECIAL REFERENCE TO INDO-GERMAN COLLABORATION
MUNEEB HUSSAIN GATTOO & MUJEEB HUSSAIN GATTOO
131
27. A STUDY ON THE ETHICAL INVESTMENT DECISION MAKING IN INDIAN RELIGIOUS ORGANISATIONS
BINCY BABURAJ KALUVILLA
135
28. GREEN MARKETING MIX: A STRATEGY FOR SUSTAINABLE DEVELOPMENT
L. NANDA GOPAL
138
29. CONSIDERING RELATIONSHIP BETWEEN CASH WITH CAPITAL COST AND FINANCIAL FLEXIBILITY
AHMAD GHASEMI & DR. ROYA DARABI
140
30. UNDERSTANDING THE GREEKS AND THEIR USE TO MEASURE RISK
SANJANA JUNEJA
146
VOLUME NO. 3 (2013), ISSUE NO. 10 (OCTOBER) ISSN2231-5756
CHIEF PATRON
CHIEF PATRON
CHIEF PATRON
CHIEF PATRON
PROF. K. K. AGGARWAL
Chairman, Malaviya National Institute of Technology, Jaipur
(An institute of National Importance & fully funded by Ministry of Human Resource Development, Government of India)
Chancellor, K. R. Mangalam University, Gurgaon
Chancellor, Lingaya’s University, Faridabad
Founder Vice-Chancellor (1998-2008), Guru Gobind Singh Indraprastha University, Delhi
Ex. Pro Vice-Chancellor, Guru Jambheshwar University, Hisar
FOUNDER
FOUNDER
FOUNDER
FOUNDER PATRON
PATRON
PATRON
PATRON
LATE SH. RAM BHAJAN AGGARWAL
Former State Minister for Home & Tourism, Government of Haryana
Former Vice-President, Dadri Education Society, Charkhi Dadri
Former President, Chinar Syntex Ltd. (Textile Mills), Bhiwani
CO
CO
CO
CO----ORDINATOR
ORDINATOR
ORDINATOR
ORDINATOR
AMITA
Faculty, Government M. S., Mohali
ADVISORS
ADVISORS
ADVISORS
ADVISORS
DR. PRIYA RANJAN TRIVEDI
Chancellor, The Global Open University, Nagaland
PROF. M. S. SENAM RAJU
Director A. C. D., School of Management Studies, I.G.N.O.U., New Delhi
PROF. M. N. SHARMA
Chairman, M.B.A., Haryana College of Technology & Management, Kaithal
PROF. S. L. MAHANDRU
Principal (Retd.), Maharaja Agrasen College, Jagadhri
EDITOR
EDITOR
EDITOR
EDITOR
PROF. R. K. SHARMA
Professor, Bharti Vidyapeeth University Institute of Management & Research, New Delhi
CO
CO
CO
CO----EDITOR
EDITOR
EDITOR
EDITOR
DR. BHAVET
Faculty, Shree Ram Institute of Business & Management, Urjani
EDITORIAL ADVISORY BOARD
EDITORIAL ADVISORY BOARD
EDITORIAL ADVISORY BOARD
EDITORIAL ADVISORY BOARD
DR. RAJESH MODI
Faculty, Yanbu Industrial College, Kingdom of Saudi Arabia
PROF. SANJIV MITTAL
University School of Management Studies, Guru Gobind Singh I. P. University, Delhi
PROF. ANIL K. SAINI
VOLUME NO. 3 (2013), ISSUE NO. 10 (OCTOBER) ISSN2231-5756
INTERNATIONAL JOURNAL OF RESEARCH IN COMMERCE, IT & MANAGEMENT
A Monthly Double-Blind Peer Reviewed (Refereed/Juried) Open Access International e-Journal - Included in the International Serial Directories
http://ijrcm.org.in/
iv
DR. SAMBHAVNA
Faculty, I.I.T.M., Delhi
DR. MOHENDER KUMAR GUPTA
Associate Professor, P. J. L. N. Government College, Faridabad
DR. SHIVAKUMAR DEENE
Asst. Professor, Dept. of Commerce, School of Business Studies, Central University of Karnataka, Gulbarga
ASSOCIATE EDITORS
ASSOCIATE EDITORS
ASSOCIATE EDITORS
ASSOCIATE EDITORS
PROF. NAWAB ALI KHAN
Department of Commerce, Aligarh Muslim University, Aligarh, U.P.
PROF. ABHAY BANSAL
Head, Department of Information Technology, Amity School of Engineering & Technology, Amity
University, Noida
PROF. A. SURYANARAYANA
Department of Business Management, Osmania University, Hyderabad
DR. SAMBHAV GARG
Faculty, Shree Ram Institute of Business & Management, Urjani
PROF. V. SELVAM
SSL, VIT University, Vellore
DR. PARDEEP AHLAWAT
Associate Professor, Institute of Management Studies & Research, Maharshi Dayanand University, Rohtak
DR. S. TABASSUM SULTANA
Associate Professor, Department of Business Management, Matrusri Institute of P.G. Studies, Hyderabad
SURJEET SINGH
Asst. Professor, Department of Computer Science, G. M. N. (P.G.) College, Ambala Cantt.
TECHNICAL ADVISOR
TECHNICAL ADVISOR
TECHNICAL ADVISOR
TECHNICAL ADVISOR
AMITA
Faculty, Government M. S., Mohali
FINANCIAL ADVISORS
FINANCIAL ADVISORS
FINANCIAL ADVISORS
FINANCIAL ADVISORS
DICKIN GOYAL
Advocate & Tax Adviser, Panchkula
NEENA
Investment Consultant, Chambaghat, Solan, Himachal Pradesh
LEGAL ADVISORS
LEGAL ADVISORS
LEGAL ADVISORS
LEGAL ADVISORS
JITENDER S. CHAHAL
Advocate, Punjab & Haryana High Court, Chandigarh U.T.
CHANDER BHUSHAN SHARMA
Advocate & Consultant, District Courts, Yamunanagar at Jagadhri
SUPERINTENDENT
SUPERINTENDENT
SUPERINTENDENT
SUPERINTENDENT
VOLUME NO. 3 (2013), ISSUE NO. 10 (OCTOBER) ISSN2231-5756
CALL FOR MANUSCRIPTS
CALL FOR MANUSCRIPTS
CALL FOR MANUSCRIPTS
CALL FOR MANUSCRIPTS
We invite unpublished novel, original, empirical and high quality research work pertaining to recent developments & practices in the areas of Computer Science & Applications; Commerce; Business; Finance; Marketing; Human Resource Management; General Management; Banking; Economics; Tourism Administration & Management; Education; Law; Library & Information Science; Defence & Strategic Studies; Electronic Science; Corporate Governance; Industrial Relations; and emerging paradigms in allied subjects like Accounting; Accounting Information Systems; Accounting Theory & Practice; Auditing; Behavioral Accounting; Behavioral Economics; Corporate Finance; Cost Accounting; Econometrics; Economic Development; Economic History; Financial Institutions & Markets; Financial Services; Fiscal Policy; Government & Non Profit Accounting; Industrial Organization; International Economics & Trade; International Finance; Macro Economics; Micro Economics; Rural Economics; Co-operation; Demography: Development Planning; Development Studies; Applied Economics; Development Economics; Business Economics; Monetary Policy; Public Policy Economics; Real Estate; Regional Economics; Political Science; Continuing Education; Labour Welfare; Philosophy; Psychology; Sociology; Tax Accounting; Advertising & Promotion Management; Management Information Systems (MIS); Business Law; Public Responsibility & Ethics; Communication; Direct Marketing; E-Commerce; Global Business; Health Care Administration; Labour Relations & Human Resource Management; Marketing Research; Marketing Theory & Applications; Non-Profit Organizations; Office Administration/Management; Operations Research/Statistics; Organizational Behavior & Theory; Organizational Development; Production/Operations; International Relations; Human Rights & Duties; Public Administration; Population Studies; Purchasing/Materials Management; Retailing; Sales/Selling; Services; Small Business Entrepreneurship; Strategic Management Policy; Technology/Innovation; Tourism & Hospitality; Transportation Distribution; Algorithms; Artificial Intelligence; Compilers & Translation; Computer Aided Design (CAD); Computer Aided Manufacturing; Computer Graphics; Computer Organization & Architecture; Database Structures & Systems; Discrete Structures; Internet; Management Information Systems; Modeling & Simulation; Neural Systems/Neural Networks; Numerical Analysis/Scientific Computing; Object Oriented Programming; Operating Systems; Programming Languages; Robotics; Symbolic & Formal Logic; Web Design and emerging paradigms in allied subjects.
Anybody can submit the soft copy of unpublished novel; original; empirical and high quality research work/manuscriptanytime in M.S. Word format
after preparing the same as per our GUIDELINES FOR SUBMISSION; at our email address i.e. [email protected] or online by clicking the link online submission as given on our website (FOR ONLINE SUBMISSION, CLICK HERE).
GUIDELINES FOR SUBMISSION OF MANUSCRIPT
GUIDELINES FOR SUBMISSION OF MANUSCRIPT
GUIDELINES FOR SUBMISSION OF MANUSCRIPT
GUIDELINES FOR SUBMISSION OF MANUSCRIPT
1. COVERING LETTER FOR SUBMISSION:
DATED: _____________
THE EDITOR
IJRCM
Subject: SUBMISSION OF MANUSCRIPT IN THE AREA OF.
(e.g. Finance/Marketing/HRM/General Management/Economics/Psychology/Law/Computer/IT/Engineering/Mathematics/other, please specify)
DEAR SIR/MADAM
Please find my submission of manuscript entitled ‘___________________________________________’ for possible publication in your journals.
I hereby affirm that the contents of this manuscript are original. Furthermore, it has neither been published elsewhere in any language fully or partly, nor is it under review for publication elsewhere.
I affirm that all the author (s) have seen and agreed to the submitted version of the manuscript and their inclusion of name (s) as co-author (s).
Also, if my/our manuscript is accepted, I/We agree to comply with the formalities as given on the website of the journal & you are free to publish our contribution in any of your journals.
NAME OF CORRESPONDING AUTHOR: Designation:
Affiliation with full address, contact numbers & Pin Code: Residential address with Pin Code:
Mobile Number (s): Landline Number (s): E-mail Address: Alternate E-mail Address:
NOTES:
a) The whole manuscript is required to be in ONE MS WORD FILE only (pdf. version is liable to be rejected without any consideration), which will start from the covering letter, inside the manuscript.
b) The sender is required to mentionthe following in the SUBJECT COLUMN of the mail:
New Manuscript for Review in the area of (Finance/Marketing/HRM/General Management/Economics/Psychology/Law/Computer/IT/ Engineering/Mathematics/other, please specify)
c) There is no need to give any text in the body of mail, except the cases where the author wishes to give any specific message w.r.t. to the manuscript. d) The total size of the file containing the manuscript is required to be below 500 KB.
e) Abstract alone will not be considered for review, and the author is required to submit the complete manuscript in the first instance.
f) The journal gives acknowledgement w.r.t. the receipt of every email and in case of non-receipt of acknowledgment from the journal, w.r.t. the submission of manuscript, within two days of submission, the corresponding author is required to demand for the same by sending separate mail to the journal. 2. MANUSCRIPT TITLE: The title of the paper should be in a 12 point Calibri Font. It should be bold typed, centered and fully capitalised.
3. AUTHOR NAME (S) & AFFILIATIONS: The author (s) full name, designation, affiliation (s), address, mobile/landline numbers, and email/alternate email address should be in italic & 11-point Calibri Font. It must be centered underneath the title.
VOLUME NO. 3 (2013), ISSUE NO. 10 (OCTOBER) ISSN2231-5756
INTERNATIONAL JOURNAL OF RESEARCH IN COMMERCE, IT & MANAGEMENT
A Monthly Double-Blind Peer Reviewed (Refereed/Juried) Open Access International e-Journal - Included in the International Serial Directories
http://ijrcm.org.in/
vi
5. KEYWORDS: Abstract must be followed by a list of keywords, subject to the maximum of five. These should be arranged in alphabetic order separated by commas and full stops at the end.
6. MANUSCRIPT: Manuscript must be in BRITISH ENGLISH prepared on a standard A4 size PORTRAIT SETTING PAPER. It must be prepared on a single space and single column with 1” margin set for top, bottom, left and right. It should be typed in 8 point Calibri Font with page numbers at the bottom and centre of every page. It should be free from grammatical, spelling and punctuation errors and must be thoroughly edited.
7. HEADINGS: All the headings should be in a 10 point Calibri Font. These must be bold-faced, aligned left and fully capitalised. Leave a blank line before each heading.
8. SUB-HEADINGS: All the sub-headings should be in a 8 point Calibri Font. These must be bold-faced, aligned left and fully capitalised. 9. MAIN TEXT: The main text should follow the following sequence:
INTRODUCTION
REVIEW OF LITERATURE
NEED/IMPORTANCE OF THE STUDY
STATEMENT OF THE PROBLEM
OBJECTIVES
HYPOTHESES
RESEARCH METHODOLOGY
RESULTS & DISCUSSION
FINDINGS
RECOMMENDATIONS/SUGGESTIONS
CONCLUSIONS
SCOPE FOR FURTHER RESEARCH
ACKNOWLEDGMENTS
REFERENCES
APPENDIX/ANNEXURE
It should be in a 8 point Calibri Font, single spaced and justified. The manuscript should preferably not exceed 5000 WORDS.
10. FIGURES &TABLES: These should be simple, crystal clear, centered, separately numbered & self explained, and titles must be above the table/figure. Sources of data should be mentioned below the table/figure. It should be ensured that the tables/figures are referred to from the main text.
11. EQUATIONS:These should be consecutively numbered in parentheses, horizontally centered with equation number placed at the right.
12. REFERENCES: The list of all references should be alphabetically arranged. The author (s) should mention only the actually utilised references in the preparation of manuscript and they are supposed to follow Harvard Style of Referencing. The author (s) are supposed to follow the references as per the following:
•
All works cited in the text (including sources for tables and figures) should be listed alphabetically.•
Use (ed.) for one editor, and (ed.s) for multiple editors.•
When listing two or more works by one author, use --- (20xx), such as after Kohl (1997), use --- (2001), etc, in chronologically ascending order.•
Indicate (opening and closing) page numbers for articles in journals and for chapters in books.•
The title of books and journals should be in italics. Double quotation marks are used for titles of journal articles, book chapters, dissertations, reports, working papers, unpublished material, etc.•
For titles in a language other than English, provide an English translation in parentheses.•
The location of endnotes within the text should be indicated by superscript numbers.PLEASE USE THE FOLLOWING FOR STYLE AND PUNCTUATION IN REFERENCES: BOOKS
•
Bowersox, Donald J., Closs, David J., (1996), "Logistical Management." Tata McGraw, Hill, New Delhi.•
Hunker, H.L. and A.J. Wright (1963), "Factors of Industrial Location in Ohio" Ohio State University, Nigeria.CONTRIBUTIONS TO BOOKS
•
Sharma T., Kwatra, G. (2008) Effectiveness of Social Advertising: A Study of Selected Campaigns, Corporate Social Responsibility, Edited by David Crowther & Nicholas Capaldi, Ashgate Research Companion to Corporate Social Responsibility, Chapter 15, pp 287-303.JOURNAL AND OTHER ARTICLES
•
Schemenner, R.W., Huber, J.C. and Cook, R.L. (1987), "Geographic Differences and the Location of New Manufacturing Facilities," Journal of Urban Economics, Vol. 21, No. 1, pp. 83-104.CONFERENCE PAPERS
•
Garg, Sambhav (2011): "Business Ethics" Paper presented at the Annual International Conference for the All India Management Association, New Delhi, India, 19–22 June.UNPUBLISHED DISSERTATIONS AND THESES
•
Kumar S. (2011): "Customer Value: A Comparative Study of Rural and Urban Customers," Thesis, Kurukshetra University, Kurukshetra.ONLINE RESOURCES
•
Always indicate the date that the source was accessed, as online resources are frequently updated or removed.WEBSITES
VOLUME NO. 3 (2013), ISSUE NO. 10 (OCTOBER) ISSN2231-5756
CLIMATE CHANGE AND VECTOR BORNE DISEASES: THE ROLE OF GIS & REMOTE SENSING
DIVYA GEORGE
RESEARCH SCHOLAR
DEPARTMENT OF FUTURES STUDIES
SCHOOL OF EARTH & ATMOSPHERIC SCIENCES
MADURAI KAMARAJ UNIVERSITY
MADURAI
DR. R. RAJKUMAR
ASST. PROFESSOR
DEPARTMENT OF FUTURES STUDIES
SCHOOL OF EARTH & ATMOSPHERIC SCIENCES
MADURAI KAMARAJ UNIVERSITY
MADURAI
ABSTRACT
Epidemiologists are adopting new remote sensing techniques to study a variety of vector-borne diseases. Associations between satellite-derived environmental variables such as temperature, humidity, and land cover type and vector density are used to identify and characterize vector habitats. The convergence of factors such as the availability of multi-temporal satellite data and geo-referenced epidemiological data, collaboration between GIS, remote sensing scientists and biologists, and the availability of sophisticated, statistical geographic information system and image processing algorithms in a desktop environment creates a fertile research environment. The use of remote sensing techniques to map vector-borne diseases has evolved significantly over the past 25 years. This paper reviews about the vector borne diseases that are caused/ induced by the climate change and the application of Geographical information system and remote sensing for the control of the disease and vector which is the reason for some of the most prevalent diseases worldwide. Examples are also taken from studies involving animal diseases that have considerable adverse effects on human welfare. The current status of GIS and remote sensing in epidemiology is assessed and suggestions are made on how, in the future, the two fields might be most profitably combined.
KEYWORDS
GIS, Vector borne diseases, disease mapping, remote sensing, Climate change.
INTRODUCTION
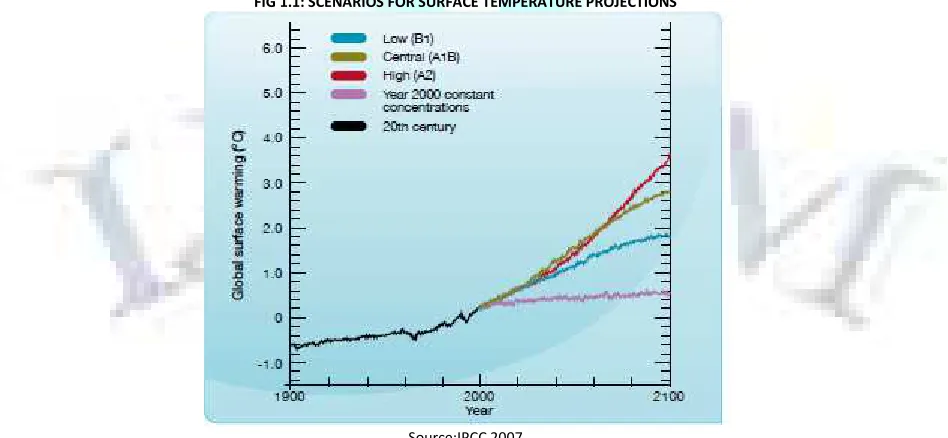
lobal change refers to the complex of environmental changes that is occurring around the world as a result of human activities. The United Nations Framework Convention on Climate Change (UNFCCC) defines climate change as a change of climate which is attributed directly or indirectly to human activity that alters the composition of the global atmosphere and which is in addition to natural climate variability observed over comparable time periods (IPCC 2001). The rise in global average temperature is thought to be a direct result of the build-up of human-generated greenhouse gases (GHGs) – primarily carbon dioxide (CO2) (IPCC 2001). Further average global temperature rises are predicted to take place during the 21st century between 1.1 and 6.4°C (2.0 and 11.5°F) depending on future GHG emissions and the Earth’s response to changing conditions (IPCC 2007) ( Figure1.1)The issue of human-induced climate change is a contentious one because it is difficult to detect a slight trend in average temperatures when it is masked by a large amount of annual variability. While the primary effect of global warming will be to increase the average temperature of the Earth, the features of climate change that deserve most attention in the context of vector-borne diseases are possible changes in the frequency and severity of extreme weather events and in climatic variability(Gill 1921).
FIG 1.1: SCENARIOS FOR SURFACE TEMPERATURE PROJECTIONS
Source:IPCC 2007
Current evidence suggests that inter-annual and inter-decadal climate variability have a direct influence on the epidemiology of vector-borne diseases (Githeko
VOLUME NO. 3 (2013), ISSUE NO. 10 (OCTOBER
INTERNATIONAL JOURNAL OF RESEARCH IN COMMERCE
A Monthly Double-Blind Peer Reviewed (Refereed
the likelihood of many vector-borne diseases in new areas (Watson
of between 2.5°C and 5°C, and an overall increase in the intensity of rainfall of between 1 mm and 4 mm/day, except for small many diseases these lie in the range 14–18oC at the lower end and about 35
take a shorter time to mature, consequently there is a greater capacity to produc
dengue fever are among the most important vector-borne diseases in the tropics and subtropics (Bouma
borne disease in the USA and Europe. Encephalitis is also becoming a public health concern. Health risks due to climatic changes will differ between that have developed health infrastructures and those that do not. The sensitivity of vector
borne diseases can serve as ‘the canary in the mine’ as a first alert of changes due to climate (Randolph, 2009). Although cl changes in the epidemiology of malaria (i.e. Githeko et al
2003; Patz et al., 1998), others have focused on the complexity of vector patterns of malaria (Lafferty, 2009; Reiter, 2001) and dengue (Gubler, 2002).
ClimaNc anomalies associated with the El Nin˜ o–Southern Oscillation phenomenon and resulting in drought and floods are expected to increase in frequency and intensity. They have been linked to outbreaks of malaria in Africa, Asia and South America. Climate change could worsen mosquito
where dengue fever and chikungunya fever have taken their toll, according to a leading expert. Dengue fever has increas than 1000 cases in 1973 to about 46 000 cases in 2007. When it comes to India, it is endemic for six major vector chikungunya, filariasis, Japanese encephalitis and visceral
1,173 deaths in 2007. Japanese encephalitis, dengue and visceral leishmaniasis (kala
VBDs cause morbidity of millions of persons resulting in loss of man days causing economic loss. Over the years, there has be almost all the diseases except chikungunya which has re
in India and research institutions and national authorities have initiated actions to assess the impacts. Studies undertaken climate change impact reveal that transmission windows in Punjab, Haryana, Jammu and Kashmir and north
3 months and in Orissa, Andhra Pradesh and Tamil Nadu there may be reduction in transmission windows. Impact of climate chang increase in transmission with 2˚C rise in temperature in northern India. Re
mainly in southern states of was a recent evidence for the effect of climate
Even if the variability of the climate relative to the average remains the same, there will be disproportionate changes in th fewer frosts and more floods (white 1989), that can have large effects on disease vectors. In Vector
and reproduce within certain optimal climatic conditions and changes in these conditions can modify greatly these properties ecology and epidemiology of vector-borne diseases can be described using the “disease triangle” of host
pathologists. Unfortunately, our understanding of the underlying mechanisms that influence vecto
vector-borne disease systems at all scales is rudimentary at best and hence forecasting the future of vector (Tabachnick, 1998; Tabachnick,2003).
TABLE 1 Disease Malaria Kala Dengue Chikungunya Japanese Encephalitis Filariasis Source a
Cases of 2007 as per report of National Filaria Control Programme Units; 508 million target population for Mass Drug Administration Episystems might occur at different levels of scale. For example, one
which may be a different episystem with different components and influences than the same pathogen defined at the countrywide global level. Climate has direct effects on the vector, pathogen and host, and their interactions with one another, yet climate also has di environmental factors that in turn may also directly influence vector
FIG.1.2 A HOST-PATHOGEN-VECTOR-ENVIRONMENT FRAMEWOR
CTOBER)
INTERNATIONAL JOURNAL OF RESEARCH IN COMMERCE, IT
Refereed/Juried) Open Access International e-Journal - Included in the International Serial Directories
http://ijrcm.org.in/
eases in new areas (Watson et al 1995). The projections on climate change indicate an increase in average temperature of between 2.5°C and 5°C, and an overall increase in the intensity of rainfall of between 1 mm and 4 mm/day, except for small
C at the lower end and about 35–40oC at the upper end (Watts et al 1987). If water temperature rises, the larvae take a shorter time to mature, consequently there is a greater capacity to produce more offspring during the transmission period (Reuda
borne diseases in the tropics and subtropics (Bouma et al 1996); Lyme disease is the most common vector A and Europe. Encephalitis is also becoming a public health concern. Health risks due to climatic changes will differ between that have developed health infrastructures and those that do not. The sensitivity of vector-borne disease cycles to climate has resulted in the view that vector borne diseases can serve as ‘the canary in the mine’ as a first alert of changes due to climate (Randolph, 2009). Although cl
changes in the epidemiology of malaria (i.e. Githeko et al., 2000; Pascual and Bouma, 2009; Watson and McMichael, 2001) and dengue (i.e. Benitez, 2009; Hales, 2003; Patz et al., 1998), others have focused on the complexity of vector-borne disease cycles and proposed alternative likely explanations for the observe patterns of malaria (Lafferty, 2009; Reiter, 2001) and dengue (Gubler, 2002).
Southern Oscillation phenomenon and resulting in drought and floods are expected to increase in frequency ave been linked to outbreaks of malaria in Africa, Asia and South America. Climate change could worsen mosquito
where dengue fever and chikungunya fever have taken their toll, according to a leading expert. Dengue fever has increas
than 1000 cases in 1973 to about 46 000 cases in 2007. When it comes to India, it is endemic for six major vector-borne diseases (VBD) namely malaria, dengue, chikungunya, filariasis, Japanese encephalitis and visceral leishmaniasis of which malaria ranks at number one with about 1.48 million cases annually and about 1,173 deaths in 2007. Japanese encephalitis, dengue and visceral leishmaniasis (kala-azar) also result in thousands of deaths annually. In addition to mort VBDs cause morbidity of millions of persons resulting in loss of man days causing economic loss. Over the years, there has be
almost all the diseases except chikungunya which has re-emerged since 2005. There is greater awareness about the potential impacts of climate change on VBDs in India and research institutions and national authorities have initiated actions to assess the impacts. Studies undertaken
l that transmission windows in Punjab, Haryana, Jammu and Kashmir and north-eastern states are likely to extend temporally by 2 3 months and in Orissa, Andhra Pradesh and Tamil Nadu there may be reduction in transmission windows. Impact of climate chang
˚C rise in temperature in northern India. Re-emergence of kala-azar in northern parts of India and reappearance of chikungunya mainly in southern states of was a recent evidence for the effect of climate change on the vector- borne diseases.
Even if the variability of the climate relative to the average remains the same, there will be disproportionate changes in th
ave large effects on disease vectors. In Vector-Borne Diseases, Vectors, pathogens, and hosts each survive and reproduce within certain optimal climatic conditions and changes in these conditions can modify greatly these properties
borne diseases can be described using the “disease triangle” of host-pathogen environment originally developed by plant pathologists. Unfortunately, our understanding of the underlying mechanisms that influence vectors, pathogens, hosts, interactions between all three, and borne disease systems at all scales is rudimentary at best and hence forecasting the future of vector-borne diseases is fraught with uncertainty
TABLE 1: MAJOR VECTOR BORNE DISEASES IN INDIA (2008) Disease Cases/annum Death
Malaria 1,524,939 935
Kala-azar 33,234 146
Dengue 12,561 80
Chikungunya 95,091 (suspected)
2,461(confirmed) 0
Japanese Encephalitis 3,839 684
Filariasis 26, 702 a -
Source: National Vector Borne Disease Control Programme Cases of 2007 as per report of National Filaria Control Programme
Units; 508 million target population for Mass Drug Administration
Episystems might occur at different levels of scale. For example, one might define the episystem for a specific pathogen at the local level of a village or town, which may be a different episystem with different components and influences than the same pathogen defined at the countrywide
Climate has direct effects on the vector, pathogen and host, and their interactions with one another, yet climate also has di environmental factors that in turn may also directly influence vector-borne disease transmission cycles.
ENVIRONMENT FRAMEWORK FOR THE ASSESSMENT OF RISKS TO HUMANS FROM VECTOR GLOBAL CHANGE
ISSN2231-5756
, IT & MANAGEMENT
Included in the International Serial Directories
89
1995). The projections on climate change indicate an increase in average temperature of between 2.5°C and 5°C, and an overall increase in the intensity of rainfall of between 1 mm and 4 mm/day, except for small areas in north-west India. For 1987). If water temperature rises, the larvae e more offspring during the transmission period (Reuda et al 1990). Malaria and 1996); Lyme disease is the most common vector-A and Europe. Encephalitis is also becoming a public health concern. Health risks due to climatic changes will differ between countries
ate has resulted in the view that vector-borne diseases can serve as ‘the canary in the mine’ as a first alert of changes due to climate (Randolph, 2009). Although climate change has been linked to
., 2000; Pascual and Bouma, 2009; Watson and McMichael, 2001) and dengue (i.e. Benitez, 2009; Hales, borne disease cycles and proposed alternative likely explanations for the observed
Southern Oscillation phenomenon and resulting in drought and floods are expected to increase in frequency ave been linked to outbreaks of malaria in Africa, Asia and South America. Climate change could worsen mosquito- borne diseases in Asia, where dengue fever and chikungunya fever have taken their toll, according to a leading expert. Dengue fever has increased dramatically in Malaysia from less borne diseases (VBD) namely malaria, dengue, leishmaniasis of which malaria ranks at number one with about 1.48 million cases annually and about azar) also result in thousands of deaths annually. In addition to mortality, VBDs cause morbidity of millions of persons resulting in loss of man days causing economic loss. Over the years, there has been reduction in the incidence of r awareness about the potential impacts of climate change on VBDs in India and research institutions and national authorities have initiated actions to assess the impacts. Studies undertaken in India on malaria in the context of eastern states are likely to extend temporally by 2– 3 months and in Orissa, Andhra Pradesh and Tamil Nadu there may be reduction in transmission windows. Impact of climate change on dengue also reveals azar in northern parts of India and reappearance of chikungunya
Even if the variability of the climate relative to the average remains the same, there will be disproportionate changes in the frequency of extreme events, such as Borne Diseases, Vectors, pathogens, and hosts each survive and reproduce within certain optimal climatic conditions and changes in these conditions can modify greatly these properties of disease transmission. The pathogen environment originally developed by plant rs, pathogens, hosts, interactions between all three, and borne diseases is fraught with uncertainty
might define the episystem for a specific pathogen at the local level of a village or town, which may be a different episystem with different components and influences than the same pathogen defined at the countrywide, continental wide or the Climate has direct effects on the vector, pathogen and host, and their interactions with one another, yet climate also has direct influence on other
VOLUME NO. 3 (2013), ISSUE NO. 10 (OCTOBER) ISSN2231-5756
Although climate in the form of rising temperature has been proposed to influence the surge of increased dengue in the world in recent years, there is also good reason to believe that this surge may be due to the increases in the size and distribution of urban human populations, continuing poverty in many parts of the tropical world and an erosion of public health infrastructure in many regions (Gubler, 2002; Gubler, 2008).
VECTOR-BORNE DISEASES
Emerging and resurging vector-borne diseases (VBDs) cause significant morbidity and mortality, especially in the developing world (Gratz 1999).Vector- borne diseases include, among others, malaria, with an estimated 247 million cases and nearly a million deaths in 2006, and dengue, with up to 50 million dengue infections and 500,000 cases of severe dengue hemorrhagic fever estimate to occur each year (WHO 2007, 2008). This burden is concentrated in the poorest regions of the World. For example, malaria alone is responsible for approximately 11% of the total disease burden in Africa, while all vector-borne diseases combined are responsible for less than 0.1% in Europe.
FIG. 1.3: THE VECTOR-BORNE DISEASE EPISYSTEM ILLUSTRATING INTERACTIONS BETWEEN SELECTED ENVIRONMENTAL FACTORS WITH EFFECTS ON THE VECTOR–PATHOGEN–HOST EPIDEMIOLOGIC CYCLE [MODIFIED FROM SUTHERST (SUTHERST, 2004)].
With approximately two billion people living in tropical and subtropical regions of the world, and an additional roughly 120 million people each year travelling to these regions, a large share of the world’s population is at risk of contracting dengue (UNWTO 2006). Two estimates have suggested that between 50 and 100 million cases of dengue fever (DF) occur annually( WHO 2006) corresponding to an incidence rate of 2.5–5.0% of the two billion people worldwide at risk. These cases result in hundreds of thousands of hospitalizations, and about 20 000 deaths each year. The spectrum of dengue infection ranges from asymptomatic infection to death. Although death occurs rarely in the febrile phase, it is most commonly the result of hypoperfusion after the development of DHF. Between 250 000 and 500 000 people develop severe dengue each year (Deen et al 2009). Demographic and societal changes, decreasing resources for vector-borne infectious disease prevention and control, and changes in public health policy have all contributed to increased epidemic dengue activity, the development of hyper endemicity, and the emergence of epidemic DHF.
Source : WHO 2006
VOLUME NO. 3 (2013), ISSUE NO. 10 (OCTOBER) ISSN2231-5756
INTERNATIONAL JOURNAL OF RESEARCH IN COMMERCE, IT & MANAGEMENT
A Monthly Double-Blind Peer Reviewed (Refereed/Juried) Open Access International e-Journal - Included in the International Serial Directories
http://ijrcm.org.in/
91
DENGUE INCIDENCE AND DEATH IN INDIA (1974-2002)
Incidence Death
India’s population is twice that of south-east Asia, the region that currently reports the most dengue-related deaths. Despite comparable environmental risk conditions, the number of reported cases and deaths in India is only a fraction of that reported in south-east Asia, In many regions of India, an increasing number of suspected cases of dengue are seropositive for IgM and IgG antibodies( Vijayakumar et al 2005).The existence of IgG antibodies in a patient demonstrates prior infection with dengue and an increased risk of the severe forms of the disease. Surveillance for dengue has been very limited in India and reporting to the central government has not been mandatory (WHO 1994). Although improvements are being made, the current gaps in epidemiological data and surveillance mean that the burden of dengue in India is uncertain.
MALARIA IN INDIA
In India the incidence of malaria during the past decade was between 20 and 30 lakh cases per year, with about 1000 reported deaths annually; this has shown no decline. The number of Plasmodium falciparum cases has also remained around 10 lakh per year. Many States had an Annual Parasite Index (API) of over 2/1000 in 2002; these include Arunachal Pradesh, Assam, Chhattisgarh, Goa, Jharkhand, Karnataka, Meghalaya, Mizoram, Orissa,Tripura, West Bengal, and Dadra and Nagar Haveli Vector-borne disease is not only an outcome but a cause of poverty. Countries with intensive malaria have income levels averaging only 33% of those without malaria, even after accounting for the effects of tropical location, geographic isolation, and colonial history (Gallup and Sachs 2001).
MALARIA INCIDENCE AND DEATH IN INDIA DURING 1961-2002
Incidence Death
IMPACT OF GLOBAL WARMING ON VBDS
VOLUME NO. 3 (2013), ISSUE NO. 10 (OCTOBER) ISSN2231-5756
body are affected by climatic conditions. The role of climatic factors on vector-borne diseases has been studied extensively in various studies to understand the importance of it, if it’s malaria the minimum temperature required for development of Plasmodium vivax parasite in anopheline mosquitoes is 14.5–16.5°C while for Plasmodium falciparum it is 16.5–18°C (Martens et al. 1995). At 16°C, it will take 55 days for completion of sporogony of P. vivax while at 28°C, the process can be completed in 7 days and at 18°C, it will take 29 days (WHO 1975). The duration of sporogony in Anopheles mosquitoes decreases with increase in temperature from 20°C to 25°C.
From 32°C to 39°C temperature, there is high mortality in mosquitoes (Craig et al. 1999) and at 40°C, their daily survival becomes zero (Martens 1997). The interplay between temperature and mosquitoes has recently been reviewed by (Dhiman et al. 2008). At increased temperatures, the rate of digestion of blood meal increases which in turn accelerates the ovarian development, egg laying, reduction in duration of the gonotrophic cycle and more frequency of feeding on hosts thus increases the probability of transmission (Martens et al. 1995). Reduction in duration of the gonotrophic cycle and the sporogony are related with increased rate of transmission (Macdonald 1957; Detinova 1962; Bruce-Chwatt 1980; Molineaux 1988). Rainfall helps in creation of mosquito breeding habitats and sometimes excessive rainfall causes flushing off the immature stages of mosquitoes. Excess rainfall can increase the breeding sites of mosquitoes and dry conditions can either eliminate or create several new breeding habitats in large water bodies such as lakes and rivers. The amount, intensity and duration of rainfall affect the population of mosquitoes (Russell et al. 1963). Rainfall also helps in increase in relative humidity (RH) and modifies temperature, which affects the longevity of mosquitoes, thus transmission of disease (Molineaux and Gramiccia 1980). If RH is below 60%, the life of mosquitoes is shortened which in turn reduces disease transmission. RH (60–80%) is considered to be optimum for effective transmission of malaria (Pampana 1969). Despite evidence that climatic patterns, including temperature and rainfall patterns, have direct effects on vector-borne diseases, there are reservations about the potential for predicting future effects of climate change on vector-borne diseases (Dobson, 2009; Fish, 2008; Gould and Higgs, 2009; Gould et al., 2006; Gubler, 2002; Gubler, 2008; Gubler et al., 2001; Lafferty, 2009; Randolph, 2009; Reiter, 2001; Reiter et al., 2004; Russell, 1998; Sutherst, 2004). These papers explore alternatives to climate-driven hypotheses for vector-borne disease epidemiology and generally point to the need for greater understanding of the ecology of vector-borne diseases in order to understand and predict the effects of future changes in the environment.
Thus, climatic conditions play important role in the distribution, degree of endemicity and epidemicity of diseases in an area. Some areas, which have most favourable conditions of temperature and rainfall, experience transmission of disease throughout the year while in areas experiencing colder months, transmission is seasonal and does not take place throughout the year. Many papers have explored the potential consequences of global climate change, particularly the impact of global warming, on vector-borne diseases (Dobson and Carper, 1992; Epstein, 2000; Epstein, 2007; Githeko et al., 2000; Greer et al., 2008; Hay et al., 2002; Kobayashi, 2008; Linthicum et al., 2008; Sutherst, 2004; Toussaint et al., 2006). The Intergovernmental Panel on Climate Change (IPCC, 2001; IPCC, 2007) lists vector-borne diseases among the most likely consequences to change due to changes in climate. Recent advances in Geographical information systems and new mapping techniques have paved the way for public health administrators to improve their planning, monitoring analysis and management of health systems.
In epidemiology with the association of GIS with RS (Remote Sensing) aids in visualizing and analyzing geographic distribution of disease with respect to time and space that is more difficult and impossible to perform in other way. The epidemiology of VBDs is complex and involves many factors. In this review, we focus on how advances in mapping, Geographic Information System (GIS), Remote Sensing (RS), and Decision Support System (DSS) technologies, and progress in the fields of spatial and space-time modelling, can be harnessed to reduce the burden that VBD inflict on humans.
REMOTE SENSING IN VBD
Mosquito borne diseases are prevalent throughout the world, and remote sensing applications in epidemiology have been most widely used to study mosquito-borne diseases. Remote sensing satellites provide continuous measurements of the earth and its environment, and offer a synoptic monitoring capability. Satellite remote sensing technology has shown promising results in assessing the risk of various vector-borne diseases at different spatial scales. Satellite measurements and other remote sensing techniques cannot identify the vectors themselves, but may be used to characterize the environment in which the vectors thrive, However, it is not possible to spot mosquitoes on satellite data, this is because of their relatively small size, which ranges from only 6 to 15 mm (average) whereas the highest resolution civilian satellite data available are at approximately one meter. Nevertheless, through the identification of habitat (which is a collection of soil, water, rocks, flora, fauna, and air) we can locate mosquitoes and their effects, such as malaria, with high accuracy.
Environmental variables such as land and sea surface temperature and amount, type, and health of vegetation can be identified and measured from space. The use of remote sensing techniques to map vector species distribution and disease risk has evolved considerably during the past two decades. The complexity of techniques range from using simple correlations between spectral signatures from different land use–land cover types and species abundance (Beck et al 1999) to complex techniques that link satellite-derived seasonal environmental variables to vector biology (Rogers et al 2002). Remote sensing data can be used at a regional scale to identify and monitor temporal and spatial vegetation characteristics, such as plant density, structure, biomass, and green leaf area which can then be used to infer attributes of larval habitats of disease vectors (Jovanovic, 1987).
Landsat data was used to determine green leaf area index (LAI) over 104 rice fields, and these measurements were compared to larval counts of Aedes freeborni at the edge of the fields and the minimum distance from the centre of each field to the nearest livestock pastures that provide the blood-meal source (Beck et al
1991) This analysis showed that fields that are near pastures that have high LAI and tiller density produce large numbers of mosquitoes, and fields with low LAI that are further from the pastures have lower numbers of mosquitoes. A combination of spectral measurements from the satellite data and distance measurements to pastures were used in discriminant analysis to identify high mosquito producing areas with 90% accuracy. Multispectral data from the SPOT (Satellite Probatoire d’Observation de la Terre) satellite was used to map the probability of mosquito presence in Belize (Roberts et al 1996). This study measured the distance of houses from waterways, altitude above specified waterways, and amount of forest between houses and waterways. This study measured the distance of houses from waterways, altitude above specified waterways, and amount of forest between houses and waterways. The use of RS in conjunction with GIS to predict areas of high mosquito density is illustrated in several studies from Central America. Rejmankova et al. (1995) used RS to estimate land-cover elements in Belize and then predict areas with high/low densities of An. albimanus.
Remote sensing data helps to identify and track environmental characteristics and changes useful to the study of the diseases. Satellite data can be used to monitor vegetation, land-use patterns, surface waters, soil moisture and quality, roads, build up areas and climatic changes. Remote sensing data allows the user to extrapolate local level measurements to a regional level and a discern spatial and temporal patterns that could not be otherwise seen. The potential of remote sensing has in principle been early recognised and adopted though. To facilitate the investigation of the Rift Valley fever, already in the 80’s the data of a meteorological satellite have been used to produce an indicator of potential viral activity in Kenia (Linthicum et al.,1987).
Jovanovic (1988, 1991) briefly reiterated the utility of satellite data for monitoring of diseases by identifying operational areas of RS for present and future applications in public health activities. These include: (a) assessment of air, soil and water pollution by chemical and physical or biological pollutants harmful to human needs; (b) comparative studies of environmental pollutants and prevalence of environmentally-related human diseases; (c) rapid detection of environmental conditions favouring the growth of disease pathogens; (d) identification of sources of various pathogenic agents and their environment; (e) improving the planning and logistics of environmentally-related public health programs; (f ) monitoring environmental changes during natural disaster; and (g) surveys of socioeconomic and more general situations related to human health.
VOLUME NO. 3 (2013), ISSUE NO. 10 (OCTOBER) ISSN2231-5756
INTERNATIONAL JOURNAL OF RESEARCH IN COMMERCE, IT & MANAGEMENT
A Monthly Double-Blind Peer Reviewed (Refereed/Juried) Open Access International e-Journal - Included in the International Serial Directories
http://ijrcm.org.in/
93
monitored using remotely sensed data, can be used to distinguish between high and low mosquito producing rice fields. New satellites and airborne systems will improve the precision, accuracy.
The combination of remotely sensed images with GIS provides extensive opportunities in the study of vector-borne disease and the following section details some studies of this type. Epstein (2000), in a recent article in Scientific American, examines global warming effects on the rise of diseases such as malaria, provides examples of risk maps, details some of the advantages of RS techniques for disease study, and encourages the research community to use satellite images for the monitoring of conditions which allow the vectors and diseases to proliferate.
GEOGRAPHICAL INFORMATION SYSTEM IN VBD (GIS)
Technological advances over the last decades with relevance to VBDs include the emergence of molecular techniques for vector species identification and pathogen detection and identification, and a rapid evolution in hardware and software options to support data collection, management, and analysis. These advances are now dramatically changing our capacity to predict, prevent, and control VBDs. The application of GIS to the health field is quite recent, but interest is growing among those involved in environmental and health research, and examples exist in the fields of geographical and environmental epidemiology, risk assessment, and public health (Trinca, 1998). Because of the ability to identify and map environmental factors associated with disease vectors, GIS are increasingly important in infectious and vector-borne surveillance. Examples include malaria (Kitron et al., 1994), Lyme Disease (Glass et al, 1995), and Onchocerciasis (Richards, 1993), among others.
A Geographical Information System (GIS) is a computer-supported system consisting of hardware, software, data and the corresponding applications (Bill 1999). By means of GIS, data can be digitally recorded and edited, stored and reorganised, shaped and analysed as well as presented in an alphanumerical and graphic mode. GIS has many applications to the study of vector-borne diseases, as many of the underlying processes influencing the distribution of insect vectors of disease are spatially heterogeneous. Recently, there has been interest in applying GIS to study the continental and global distribution of malaria and the mosquitoes that transmit malaria (Coetzee, Craig and Le Sueur 2000; Craig, Snow and Le Sueur 1999; Omumbo et al. 1998). These continent-scale studies have also been used to estimate the impact of global warming on the distribution of mosquitoes and malaria.
GIS, in combination with remote-sensing (RS) technology, has also been employed to predict areas of high productivity of mosquitoes and potential malaria epidemics based on the detection of proxy ecological variables (Hay et al. 2000; Thomson et al. 1996). Mapping of disease incidence in GIS can readily be converted into areas of disease risk and then associations made with any related ecological indicator that appears to be involved, for instance, malaria infection with water bodies and vegetation.
GIS has two different types of data: on one hand geometric data which are the co-ordinates of points defining also curves and areas and on the other hand the attribute data containing the factual information. The functionalities of GIS include, among other things, the following selected aspects (Scholten and de Lepper, 1991; Briggs and Elliot 1995; Clarke et al., 1996):
• Data capture: data input by user employing scanner, digitizer tablet, keyboard etc., or data import from digital sources. • Data check: plausibility, revision and completion.
• Data integration: transfer of data sets into a consistent geographic data structure by generalisation, co-ordinates transformation resp. Translation etc.. • Data storage: spatial data are stored as grid or vector data. Advanced GIS can process both types of data in hybrid systems. Normally, the data are stored in
intra system data bases.
• Data retrieval: basic functions for a user-defined query of data bases.
• Data analysis: GIS provides a broad range of tools to analyse the database. In this respect, all GIS functionalities can be used, in particular the visualisation methods.
• Data display: the most important display format of GIS are maps. But also tables and graphics are possible formats for the presentation of results. The value of GIS for VBD applications is its ability to seamlessly integrate disparate types of data and information such as environmental conditions, substance characteristics, fate and transport models, and spatio-temporal disease transmission characteristics. GIS supports multidisciplinary analysis using a systems approach and provides the ability to perform predictions of outbreaks based on available information. A number of issues must be considered when developing such a system including: (1) data quality; (2) personal confidentiality; and (3) methodological pitfalls (Albert, 2000). The currency and completeness of data incorporated into the system must be maintained. The scales of data used must be appropriate for the model or application they support. For example, 1 km imagery will not be appropriate for mapping wetlands and likewise, a 1:5000 land cover GIS is not necessary for performing climate modelling. RS could also be used as a tool for rapidly identifying potential vector breeding-sites to supplement a GIS approach to targeted vector control. The remote sensing data are increasingly used for investigations in the field of environmental health sciences for risk mapping, surveillance or monitoring, particularly of vector-borne diseases (Beck et al., 2000). Since the disease vectors make specific demands as to climate, vegetation, soil and other factors, remote sensing can be used to determine the habitat. Remote sensing is frequently applied on the investigation of the malaria risk. Anopheles lives, depending on species, in specific habitats. Thus in numerous studies, the habitat of Anopheles is analysed and compared with the incidence of malaria (Srivastava et al., 1999; Beck et al., 1994, 1997; Dale et al., 1998; Thomas et al., 2000; Hay et al., 1998). The advanced and technically improved conditions of the IKONOS satellite picture data performing a high geometric resolution are most suitable for investigations on a large scale (Meinel and Reder, 2001) and may open up new opportunities for innovations.
VBD SURVEILLANCE USING GIS
The development of GIS during the past 40 years provided the impetus for geographers to analyze large-scale spatial patterns (Glass et al., 1995), but the real GIS revolution began in the mid 1980s and has since spread to almost all countries of the world (Openshaw, 1996). Croner et al. (1996) identified GIS, a hardware and software configuration with digital geo-referenced data for analysis and display, as a much-awaited tool for professionals in the field of public health. Disease surveillance requires professional analysis and sophisticated judgement of data leading to recommendations for control activities. The ultimate objectives of surveillance is prevention of disease. Disease surveillance involves the mapping the disease in terms of (a) disease, (b) host, (c) vector and (d) parasite. It includes monitoring the disease in human populations, pattern of drug resistance in the vectors and parasites, and the intensity of transmission by the vector populations.
Mapping the disease - Maps provides the graphic representation of the health issues. Among the disease maps confined to the collection, description and presentation of spatial disease distribution, dot maps, diagram maps, choropleth maps and flow maps are to be distinguished. Within dot maps, each dot represents the coordinates of one or more health events. Choropleth maps display the prevalence or incidence of health events for defined areal units (e.g. administrative districts) by colouring, shading or hatching. Diagram maps include the presentation of quantitative data in diagrams. Flow maps display the distribution dynamics of health events in time and space. Disease maps translate information into a certain spatial structure, facilitate the handling of spatial dimensions (Cliff and Haggett, 1988) and help to communicate complex epidemiological coherences. The first geographer who devoted his attention to disease mapping was August Petermann (Diesfeld, 1995). When he recorded the cholera epidemics on the British Isles for the years between 1831-1833 (Petermann,1852), the map was a fundamental tool and featured a remarkable quality. The oldest examples known are a world map of diseases drawn up by Finke in 1792 (Barrett, 2000b) and a mapping of yellow fever occurrences in the harbour of New York issued in 1798 (Stevenson, 1965).
Mapping the host - GIS can be used to map the host communities. When different host are exposed to a same parasite, their susceptibility may range from negligible to fatal. GIS can be used to determine the population and also stratify the risk factors. It will give the better way of the host- parasite relationship by giving us the potential breeding sites of the vectors, their prevalence and mortality.
VOLUME NO. 3 (2013), ISSUE NO. 10 (OCTOBER) ISSN2231-5756
Mapping the parasite – Mapping the parasite is the most important task, because a particular species of parasite is responsible for various diseases and it is useful to make an ideal vaccine for that corresponding disease.
VECTOR BORNE DISEASE DECISION SUPPORT SYSTEM
A GIS-based decision support system (DSS), with a remote sensing component, could significantly improve the management of vector borne disease events by providing: (1) an improved prediction capability based on climate and environmental models; (2) improved remediation measures through efficient allocation of resources; and (3) improved methods of prevention by providing a capability to perform scenario evaluation. A GIS based decision support system comprised of 4 stages: (1) planning; (2) mitigation; (3) response; and (4) recovery/ preparedness. In the planning stage, the DSS provides the ability to monitor environmental conditions and habitats and perform environmental forecasts. If conditions are deemed likely to facilitate a VBD, the mitigationstage is entered where the DSS will perform a seriesof modeling activities based on the planning inputsand assist decision makers in developing mitigation plans for the pending outbreak. Note that theseplans include not only environmental and health forecasts, but also economic and resource forecasts as well. Based on these forecasts, a responsecan be formulated which reduces the impacts of the VBD. In this stage, the ill are tended to, destruction of the vector is performed, and the public is alerted to the presence of an outbreak. In the last stage of recovery/preparedness, environmental restoration is performed, potentially harmful material is removed (such as tires in the case of Rift Valley Fever), and hospital inventories are stocked with appropriate supplies. Through this four-stage process, lessons are learned, needed improvements to existing models can be identified, and ultimately improved management of VBD events will result.
CONCLUSION
Resurgence of vector-borne diseases in endemic areas and their introduction into new areas create havoc among health planners. As a result, they are searching for innovative technologies to control these ailments. One ideal solution for the monitoring of such diseases is satellite imagery which is critical for mapping and locating vector habitats, and GIS can be used to help understand the complex relationship between human and vector behavioral patterns (Corbley, 1999). Therefore, as reviewed in this paper, RS and GIS techniques offer significant potential for application to disease detection, monitoring, and prevention. The variety of analyses using different GIS tools demonstrates tremendous capabilities of the technology available to epidemiologists and researchers. Integration of GIS with remote sensing helped in identification, characterization, monitoring and surveillance of breeding habitats and mapping of malaria risk areas. GIS provides the necessary infrastructure for an end-to-end VBD decision support system for monitoring and responding to the critical phases of vector borne disease. Remote sensing can play an important role in this system by providing environmental information and supporting larger scale models. With the power of the tools of RS and GIS, geographic analysis of disease distributions, causes, and effects can be deducted. The VBD DSS could significantly enhance the ability of local communities and government organizations to conduct contingency planning for future outbreaks. A GIS based VBD decision support system would not only benefit the stakeholder community, but would also provide valuable analysis capabilities to other related domains such as bio-surveillance, health care forecasting, and national issues such as country’s stability and it is user- friendly and more affordable. Studies using RS in conjunction with GIS will help identify gaps in our knowledge of the characteristics of larval biology and may even be used as a predictor of areas of high disease transmission. In this review, it have been shown that RS and GIS techniques significantly contributed in the studies of vector-borne diseases and their role for the monitoring of these diseases cannot be further over-looked.
REFERENCES
1. Albert, D.P., Gesler, W.M., Levergood, B., editors, Spatial Analysis, GIS, and Remote Sensing Applications in the Health Sciences, Ann Arbor Press, Chelsea, Michigan, 2000.
2. Arambulo, P. V. and Astudillo, V. (1991) Perspectives on the application of remote sensing and geographic information system to disease control and health management. Preventive Veterinary Medicine, 11, 345-352.
3. Barrett, F. A.: Finke's 1792 map of human diseases: the first world disease map? Soc Sci Med 50, 915 ± 921 (2000b).
4. Beck LR, Lobitz BM, Wood BL (2000) Remote sensing and human health: New sensors and new opportunities. Emerg Infect Dis 6: 217–226.
5. Beck, L. R., Rodriguez, M. H., Dister, S. W., Rodriguez, A. D., Rejmankova, E., Ulloa, A., Meza, R. A., Roberts, D. R., Paris, J. F., Spanner, M. A. et al: Remote sensing as a landscape epidemiologic tool to identify villages at high risk for malaria transmission. Am J Trop Med Hyg 51, 271 ± 280 (1994).
6. Benitez, M. A. (2009). Climate change could affect mosquito-borne diseases in Asia. Lancet 373, 1070.
7. Bill, R.: Grundlagen der Geo-Informationssysteme. Band 1. Hardware, Software und Daten. Wichmann, Heidelberg. 4th ed. (1999).
8. Bouma MJ, Dye C, van der Kaay HJ. Falciparum malaria and climate change in the northwest frontier province of Pakistan. American Journal of Tropical Medicine and Hygiene, 1996, 55: 131–137.
9. Briggs, D. J., Elliott, P.: The use of geographical information systems in studies on environment and health. World Health Stat. Quarterly 48, 85 ± 94 (1995). 10. Clarke, K. C, Osleeb, J. R., Sherry, J. M., Meert, J. P. and Larsson, R. W. (1991) The use of Epstein, P. R. (2000) "Is Global Warming Harmful to Health",
Scientific American, 283(2).
11. Clarke, K. C., McLafferty, S. L. Tempalski, B. J.: On epidemiology and geographic information systems: a review and discussion of future directions. Emerg Infect Dis 2, 85 ± 92 (1996).
12. Cliff, A. D., Haggett: Atlas of disease distributions. Analytic approaches to epidemiological data. Blackwell, Oxford, New York (1988).
13. Coetzee, M., Craig, M. and Le Sueur, D., 2000. Distribution of African malaria mosquitoes belonging to the Anopheles gambiae complex. Parasitology Today, 16 (2), 74-77.
14. Craig, M.H., Snow, R.W. and Le Sueur, D., 1999. A climate-based distribution model of malaria transmission in sub-Saharan Africa. Parasitology Today, 15 (3), 105-111.
15. Croner, C. M., Sperling, J. and Broome, F. R. (1996) Geographic informations systems (GIS): New perspectives in understanding human health and environmental relationships.
16. Dale, P. E., Ritchie, S. A., Turrito, B. M., Morris, C. D., Muhar, A., Kay, B. H.: An overview of remote sensing and GIS for surveillance of mosquito vector habitats and risk assessment. J Vector Ecol 23, 54 ± 61 (1998).
17. Deen JL, et al.(2009). The WHO dengue classification and case definitions: time for a reassessment. Lancet 368: 170–173.
18. Detinova TS (1962) Age grouping methods in Diptera of medical importance with special reference to some vectors of malaria. Monograph series 47.World Health Organization, Geneva, pp 1–216.
19. Dhiman RC, Pahwa S, Dash AP (2008) Climate change and malaria in India: interplay between temperatures and mosquitoes. WHO Reg Forum 12:27–31. 20. Dhiman RC, Pahwa S, Dash AP (2008) Climate change and malaria in India: interplay between temperatures and mosquitoes. WHO Reg Forum 12:27–31. 21. Diesfeldt, H. J.: Geomedicine. In: Spezielle pathologische Anatomie. (W. Doerr, G. Seifert, eds.), pp. 25 ± 59. Springer, Heidelberg 1995 (_Tropical Pathology
Bd. 8).
22. Dobson, A. and Carper, R. (1992). Global warming and potential changes in host parasite and disease-vector relationships. In Global Warming and Biodiversity (eds R. L. Peters and T. E. Lovejoy), pp. 201-217. Yale University Press: New Haven, CT.
23. Gallup, J.L. and J.D. Sachs, 2001: The economic burden of malaria, American Journal of Tropical Medicine and Hygiene, 64, pp. 85–96. 24. Gatrell, A. and Loytonen, M., pp. 113-124. London: Taylor & Francis Ltd. and European
25. Gill CA. The role of meteorology in malaria. Indian J Med Res 1921; 8: 633–93.
VOLUME NO. 3 (2013), ISSUE NO. 10 (OCTOBER) ISSN2231-5756
INTERNATIONAL JOURNAL OF RESEARCH IN COMMERCE, IT & MANAGEMENT
A Monthly Double-Blind Peer Reviewed (Refereed/Juried) Open Access International e-Journal - Included in the International Serial Directories
http://ijrcm.org.in/
95
27. Gratz NG. 1999. Emerging and resurging vector-borne diseases. Annu. Rev. Entomol. 44:51–75.
28. Greer, A., Ng, V. and Fisman, D. (2008). Climate change and infectious diseases in North America: the road ahead. Can. Med. Assoc. J. 178, 715-722. 29. Hay, S. I., Snow, R. W., Rogers, D. J.: Predicting malaria seasons in Kenya using multitemporal meteorological satellite sensor data. Trans RSoc Trop Med
Hyg 92, 12 ± 20 (1998).
30. Hay, S.I., Omumbo, J.A., Craig, M.H., et al., 2000. Earth observation, geographic information systems and Plasmodium falciparum malaria in sub-Saharan Africa. In: Hay, S. I., Snow, R. W., Rogers, D. J.: Predicting malaria seasons in Kenya using multitemporal meteorological satellite sensor data. Trans RSoc Trop Med Hyg 92, 12 ± 20 (1998) .
31. Hugh-Jones, M. (1989) Applications of remote sensing to the identification of the habitats of Jovanovic, P. (1987) Remote sensing of environmental factors affecting health. Advanced Space Research,7, 11-18. In Emerging Infections (ed. R. M. Krause), pp. 411-429. New York: Academic Press.
32. Intergovernmental Panel on Climate Change (IPCC) (2007) Climate Change: The Physical Science Basis’ Contribution of Working Group I to the Fourth Assessment Report of the Intergovernmental Panel on Climate Change, Solomon, S. Et al. (eds.). Cambridge: Cambridge University Press.
33. Kitron, U., Pener, H. and Costen, C. (1994) Geographic information system in malaria
34. Lafferty, K. D. (2009). The ecology of climate change and infectious diseases. Ecology 90, 888-900.
35. Lindsay SW, Birley MH (1996) Climate change and malaria transmission. Ann Trop Med & Parasit 90:573–588
36. Linthicum, K. J., Bailey, C. L., Davies, F. G., Tucker, C. J.: Detection of Rift Valley fever activity in Kenya by satellite remote sensing imagery. Science 235 (4796), 1656 ± 1659 (1987).
37. MacDonald G (1957) The epidemiology and control of malaria Oxford University Press London, pp 201
38. Martens P (1997) Health impacts of climate change and ozone depletion. An Eco-epidemiological Modelling Approach 1–157 39. Martens P (
![FIG. 1.3: THE VECTOR-BORNE DISEASE EPISYSTEM ILLUSTRATING INTERACTIONS BETWEEN SELECTED ENVIRONMENTAL FACTORS WITH EFFECTS ON THE VECTOR–PATHOGEN–HOST EPIDEMIOLOGIC CYCLE [MODIFIED FROM SUTHERST (SUTHERST, 2004)]](https://thumb-us.123doks.com/thumbv2/123dok_us/209579.2015341/9.595.86.514.184.420/episystem-illustrating-interactions-environmental-pathogen-epidemiologic-modified-sutherst.webp)
