A b s t r a c t. The sprouting test consisted in placing a mono-layer formed from grains of the examined sample (120 g at 11.5 % moisture) between layers of filter blotting paper (29 g when dry) wetted with distilled water. Different degrees of sprouting, at constant period of duration (72 h), were achieved by the use of different amounts of water added (from 20 to 80 g), causing a wide range of moistening the grains (from 18.6 to 40.2 %). With the increase in the grain moisture content, the proceeding process of sprouting gradually produced a decrease in the falling number and the hardness index of single grains (SKCS). The permissible moistures of grain, at which the course of sprouting did not cause of significant changes in activities of a-amylase as well in the hardness of single grains has been determined.
K e y w o r d s: wheat grain, sprouting, falling number, hard-ness index, SKCS
INTRODUCTION
The technological hardness is one of most useful indices in the evaluation of wheat grain quality, especially in predicting its milling and baking potential [11,13]. It relates to a type of grain endosperm texture that is determined in a high degree by a genotype of a wheat cultivar [1].
To a lesser extent, the hardness is also influenced by the growing environment, mostly during grain development. Studies of Miœ and Geodecki [6] showed that a hardness in-dex value, measured by the SKCS technique, was influenced by the ripe stage at which wheat was harvested. It was noted that with a delay in the harvest date, a gradual decrease in the hardness index as successive rain falls occurred. That nega-tive effect of grain moistening has been also confirmed in laboratory studies [7,15] which indicate that with an increa-se in the moistening rate, the hardness decreaincrea-se is greater.
However, it needs further studies with use of the SKCS to allow one to know the effects of longer falling rains at the
wheat harvest period that enables the phenomenon of sprou-ting to occur, strongly worsening the baking potential of wheat [3,4,12,14]. Knowledge of the relation between the hardness index of a grain and its sprouting degree appears to be indispensable to the technological classification of this kind of raw material.
The subject of the present studies was to describe chan-ges in grain hardness as the sprouting degree successively increases in a wide range. With this in mind, a laboratory sprouting test was contrived that allows for the easy model-ling of conditions of grain sprouting to those in the field. The characterisics of the test as well as the dependence of the hardness index on the sprouting degree modified by the amount of added water used in the test has been presented in this paper.
MATERIAL AND METHODS
Characterisation of wheat grain
Grain samples of two Polish wheat cultivars: Roma (winter) and Igna (spring) grown on the field at the Experi-mental Station of Agricultural University in Lublin were taken to this study. The grain of cv. Roma, in relation to the hardness index (HI), was classified [10] as soft (HI=39), while the one of cv. Igna – as hard (HI=74). Besides, cv. Roma was characterised by heavier and slightly thicker grains. Mean values of the grain weight and thickness for cv. Roma were 41 mg and 2.9 mm, and for cv. Igna – 36 mg and 2.8 mm, respectively. Within these features, the heteroge-neity degree of single grains of both cultivars was measured at the same level (lack of significant differences).
Wheat grain hardness modified by the laboratory sprouting test
A. Miœ and S. Grundas
Institute of Agrophysics, Polish Academy of Sciences, Doœwiadczalna 4, P.O. Box 201, 20-290 Lublin 27, Poland
Received March 4, 2002; accepted September 30, 2002
© 2002 Institute of Agrophysics, Polish Academy of Sciences
*Corresponding author’s e-mail: [email protected]
A
A
Agggrrroooppphhyhyysssiiicccsss
w
w
Description of sprouting test
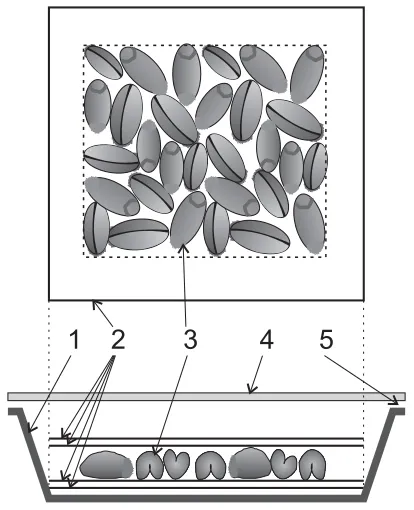
Sprouting tests of wheat grains were conducted under model conditions using a newly worked out laboratory set (Fig. 1). It consisted of a plastic tray of 2 cm depth, top edge of which was shaped in the form of a horizontal collar of 1 cm width, and of a glass plate covering this tray. On the bottom of the tray, two layers of filter blotting paper of 38x28 cm each were placed. Then, a weighed sample of grain (120 ± 0.1 g) at fixed moisture (11.5 ± 0.5%) was uniformly spread on the entire surface of blotting paper within the limits of the edges of a flat frame box (33x23 cm). The frame box was then taken off, and the grain monolayer was covered with two layers of filter blotting paper. The ratio of total weight of dry blotting paper of all 4 layers (29 ± 0.3 g) to the weight of grain monolayer (~ 1:4) was assumed from the proportion between the weights of the husks and grains in mature wheat heads.
An exact addition of distilled water (22.5 ± 0.5°C) was quickly poured on the surface of the external blotting paper layer, and immediately the tray was covered with the glass plate. Between that plate and the edge of tray, a gap (1.2 mm) for holding up ventilation during sprouting was left. The time of adding the water was noted as the beginning of the test of sprouting. The sprouting test was conducted in a room with stabilised temperature at 22.5 ± 0.5°C. The time of its duration was constant and equal 72 h (3 days). It was selected on the basis of literature data [3,8,14], which
indicate that the assumed time of sprouting is sufficient to cause large changes in grain properties. After the test was finished, grains were spread on dry blotting paper and dried at room temperature to obtain the same grain moisture as before sprouting (11.5%).
Using the above-described test, the experiment on the influence of the amount of water addition on thea-amylase activity of wheat grain and its hardness was made. The amount of added water in a range of 20 to 55 g was dif-ferentiated by 2.5 g, while in a range of 55 to 80 g by 5.0 g. Twenty levels of the factor were given assuring a wide diffe-rentiation of the degree of wheat grain sprouting.
Methods for evaluation of the test for sprouting and its effects
The functionality of the sprouting test was evaluated by determining the distribution in utilisation of the water addi-tion at the end of test. Quantities of water absorbed by the grain and blotting paper were calculated on the basis of their increased weights at the end of each test. The quantity of water loss as a result of evaporation was calculated by the subtraction of the water addition weight and the weight of water absorbed by both grain and blotting paper.
Measurements of thea-amylase activity as well as the grain hardness were made on wheat grain samples after long storage (3 months) next to sprouting and at a fixed moisture (11.5 ± 0.5%). Changes ina-amylase activity in the grain were determined measuring falling number (FN) values in accordance with standard ICC No. 107/1 [2], and by the visual inspection of morphological symptoms of sprouting grains as well.
The hardness of wheat grain was determined using a SKCS 4100 device, Perten Instruments AB [5,9]. This de-vice automatically singulates grains and determines indi-vidual grain weight, moisture, thickness and crushing force profiles. The hardness index (HI) is calculated using an algo-rithm developed by the USDA. In these studies, the mean va-lues of grain features and the standard deviation as a measure of heterogeneity degree of each feature within 100 randomly taken grains were determined. To assure correct working of the SKCS 4100 device, grains before measurement were subjected to visual inspection in respect of the presence of sprouts. The sprouts were removed by hand if they had occurred.
All measurements were repeated 3 times. Within the statistical analysis of results, 95% confidence intervals for means (LSD) were calculated. The LSD values were used for determinating the allowable amounts of water addition or in turn the grain moisture contents, which did not yet cause significant changes, i.e., greater than LSD intervals, in the falling number and hardness index values in relation to those for the grain not subjected to sprouting (the control).
1
2
3
4
5
RESULTS
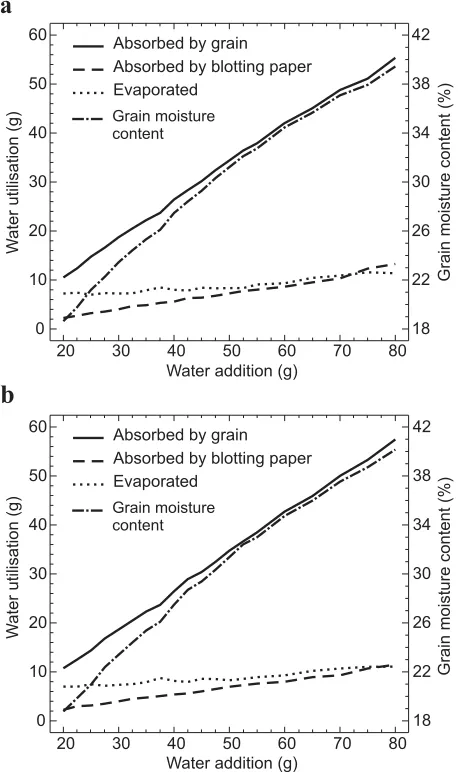
Functionality of the test for sprouting of wheat Characterisation of the use of water addition in the sprouting test is shown in Fig. 2a and b, respectively for cv. Roma and Igna. With the increasing amount of water addi-tion, sorption of water by grain was linearly increasing from 10.5 g at the 20 g addition, for both studied cultivars, to 55.5 g for cv. Roma, and to 57.5 for cv. Igna, at the maximum water addition (80 g). As a result, a moisture content of the grain varied in wide intervals, from 18.6 to 39.4% for cv. Roma, and from 18.8 to 40.2% for cv. Igna.
The quantity of water stored in blotting paper layers, wrapping up the grain monolayer, increased considerably less, from 2 g to 11 and 13 g for cv. Igna and Roma,
respecti-vely. Whereas the increase in the water addition from 20 to 80 g influenced to the least extent losses of water evapo-rated. The losses ranged from 7 to 11 g, the same for both cultivars.
Above results show that cv. Igna, characterised as har-der in grain endosperm texture (HI) than cv. Roma, showed at the same time a greater ability of water sorption by its grain.
Changes in the falling number
The dependence of falling number values on the water addition used in the sprouting test is presented on Fig. 3. FN values did not change, in relation to the control, only in an initial range of water additions, from 20 to 27.5 g, for both cultivars. Then the FN values from 350 s (Roma) and 540 s (Igna) came down to 62 s (the limit of the measuring scale), which for both cultivars was reached at the 47.5 g addition of water. Morphological symptoms of sprouting, i.e., appea-rance of sprouts, were observed only after 50 g addition of water, for both cultivars. Further increasing water until 80 g influenced the successive development and growth in length of sprouts.
Making the comparison of changes in falling number (Fig. 3) with readings of grain moisture content at the end of sprouting (Fig. 2a and b), more useful information may be drawn. It indicates that moistening grains to about 22% moisture content did not cause significant changes in the enzymatic activity (FN). More intensive moistening contri-buted already to the significant increase in activity of
a-amylase. When the moisture of grains exceeded 33%, besides the increased enzymatic activity, the sprouts started to develop.
20 30 40 50 60 70 80 0 10 20 30 40 50 60 18 22 26 30 34 38 42
Water addition (g)
W ater utilisation (g) Grain moisture content (%)
Absorbed by grain Absorbed by blotting paper Evaporated
Grain moisture content
Water addition (g)
W ater utilisation (g) Grain moisture content (%)
Absorbed by grain Absorbed by blotting paper Evaporated
Grain moisture content
20 30 40 50 60 70 80 0 10 20 30 40 50 60 18 22 26 30 34 38 42
a
b
Fig. 2. Distribution in of water addition utilisation in test for sprouting of wheat of cv. Roma (a) and Igna (b) as a result of evaporation and absorption of water by grains and blotting paper.
Control 20 30 40 50 60 70 80 Water addition (g)
Falling number (s) 0 100 200 300 400 500 600 LSD
62 s - limit of measuring scale
Appearance of sprouts
ROMA
IGNA
Influence of sprouting on grain hardness
The statistical analysis of data obtained using of SKCS did not show significant differences in the weight and thickness of grains as a result of the used sprouting test within the whole range of water additions. The maximum differences noted between the mean values of the grain weight did not exceeded 2 mg, and in the case of thickness – 0.1 mm, and were placed inside of the 95% confidence intervals for means. It indicates that 3 day (72 h) process of sprouting, even at the maximum addition of water, did not yet cause such changes in the grain weight and thickness, which would be perceptible by SKCS 4100 device.
Statistical analysis of above mentioned features as well as the hardness index did not confirm significant differences in the heterogeneity degree of grains, measured as the stan-dard deviation value, within grain samples modified by sprouting. In other words, the sprouting test did not influ-ence an increase as well as a decrease in the heterogeneity of grains with regards to the studied features. It can show that the worked out laboratory set guarantees all grains in the monolayer identical conditions during the sprouting test.
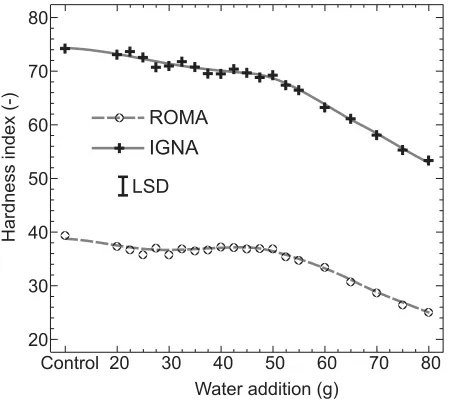
Among the SKCS features, only the hardness index (HI) was subjected to significant changes under the influence of the sprouting of wheat grain (Fig. 4). The course of depen-dence of the HI values on the amount of water addition had the same character for both studied cultivars of wheat. With an increase in the amount of the water addition, the values of the hardness index gradually decreased. Initially, the HI de-creases were little (Igna) or were almost on a constant level (Roma). Only after use of the water additions above 50 g, were the decreases much more intensive. For cv. Roma, the HI values decreased from 39 (the control) to 25 (the 80 g addition), and for cv. Igna from 74 to 53, respectively.
The range of allowable water additions, which did not cause significant decreases in the HI value, for cv. Roma was from 20 to 50 g (Table 1). While cv. Igna displayed a nar-rower interval from 20 to 35 g. Allowable moisture contents to which the grain may be moistened without negative effects reached 31% for cv. Roma, and 25%, for cv. Igna.
The obtained results show that the wheat grain with a harder endosperm texture (cv. Igna) is subjected to greater hardness decreases as a result of sprouting and the first significant HI decreases are observed at much lower sprouting degrees.
DISCUSSION
Sprouting is a natural phenomenon induced by weather conditions in the pre-harvest period, when wheat grains have reached maturity. Longer falls of rain in this period cause moistening of grains in wheat heads. After the grains reach a certain, not too high moisture content, the sprouting begins. The present studies have shown that moistening grains to the moisture content higher than 22.5% initiated the sprouting process, observed as a significant increase in activity ofa-amylase (FN). Whereas development of first sprouts was initiated at moisture of the grains higher than 33%. The similar relations were also reported by Nakatsu [8]. He stated that the 24 or 72 h incubation of grain with moisture below 25% did not cause the rise in a-amylase activity. At a moisture content in the range of 25 to 30%, the activity of this enzyme was high at a simultaneous absence of external symptoms of germination (sprouts). Grains sprouted only when their moisture was higher than 30%.
To study the course of the sprouting process and its ef-fects on the technological quality of wheat grain, laboratory tests are mostly used. They are composed of two separate stages: soaking of grains, and then germination (incubation) [3,4,12,14]. If the stage of soaking is a dipping of grains in water for a long period, i.e., from several to a dozen hours or so, it may become a source of incorrect results. That is be-cause the entire dipping of grains in water cuts off the inflow of air. When imbibed grains stop respiring, the stirred enzy-matic activity is inhibited. Used in the present studies, the simple laboratory test eliminates these kind of errors. Layers of blotting paper, adhering from both sides to the grain surface, perform similar functions as the husks in a mature wheat head. The exact addition of water, corresponding to 20
30 40 50 60 70 80
Control 20 30 40 50 60 70 80 Water addition (g)
Hardness
index
(-)
LSD ROMA
IGNA
Fig. 4.Effect of water addition used in test for sprouting of wheat cultivars on hardness index of single grains.
Grain features Water addition (g) Moisture content (%)
Roma Igna Roma Igna
Falling number Hardness index
27.5 50.0
27.5 35.0
22.3 31.2
rainfall, is applied on the surface of the blotting paper. The ventilating gap makes the respiration of imbibed grains possible and regulates the rate of drying of blotting paper and grains. This kind of test therefore guarantees more reliable results are obtained.
As it has been shown in the present studies, one of the negative effects of sprouting is the decrease in hardness of the wheat grain. When interpreting reasons for the hardness decrease, it should be considered that both physical and biochemical processes are taking place during sprouting. Within the physical ones, the moistening process contribu-tes to a mechanical damage (cracking) of grain endosperm. The cracking is a result of faster imbibing of external endos-perm layers than the deeper ones, which transversely crack [16]. This kind of damage leads to weakening the grain hard-ness (HI), as has been previously proved by Miœet al. [7], and WoŸniak [15].
Results of the present studies showed that the signi-ficant HI decreases occurred only when first symptoms of sprouting, measured as the decrease in the FN, were noted. This proves that the gentle way of moistening had much less influence on the hardness decreases than the biochemical processes undergoing during sprouting. So it must be accep-ted that the biochemical processes were an important reason for the HI decreases as observed, especially at higher de-grees of sprouting. These processes are mostly characterised by an increase in enzymatic activity ofa-amylase and pro-teases, which catalyse the hydrolysis of starch and protein stored in grain endosperm [3,4,12]. As a sprouting degree increases, the degradation of endosperm structural compo-nent is more progressive. In consequence, the mechanical strength of the grain endosperm weakens as shown in the present studies. A similar tendency to weakening hardness of grains, but as a result of the lengthening duration of sprou-ting was previously observed by Leelavathiet al. [3].
CONCLUSIONS
The presented studies with use of the SKCS technique and the laboratory test for sprouting of wheat grain allowed one to draw the fallowing conclusions:
1. The assumed amounts of the water addition used in the sprouting test influenced widely differing moistening levels of wheat grain, from 18.6 to 40.2% moisture content. The grain of cv. Igna with hard endosperm absorbed water with greater power than the one of cv. Roma with soft en-dosperm.
2. The allowable grain moisture, which did not jet change significantly thea-amylase activity was about 22%. When the moisture content exceeded that level, falling num-ber values began to decrease. Thus the growth of initial spro-uts was observed when the moisture content exceeded 33%.
3. Within features determined by means of the SKCS, the grain hardness only was significantly changed as a result of the used sprouting test. The wheat cultivars differed
clear-ly in the moisture content to which the grain could be moiste-ned without significant influence on its hardness. These moisture contents amounted to about 25 and 31% for cv. Igna and Roma, respectively.
4. The sprouting process undergoing at higher moiste-ning levels caused decreases in the hardness index (HI) values, even by 21. The noted HI decreases were distinctly higher for cv. Igna with hard grain than for cv. Roma with the soft one.
REFERENCES
1. Hoseney R.C., 1987.Wheat hardness. Cereal Foods World, 32, 320–322.
2. International Association for Cereal Science and Technology: ICC Standard No. 107/1,1995.Determination of the ‘falling number’ according to Hagberg-Perten as a measure of the degree of alpha-amylase activity in grain and flour.
3. Leelavathi K., Vetrimani R., and Haridas-Rao P., 1990. Changes in the functional characteristics of wheat during soaking and subsequent germination. Journal of Food Science and Technology, India, 27, 349–354.
4. Lukow O.M. and Bushuk W., 1984.Influence of germination on wheat quality. I. Functional (breadmaking) and bioche-mical properties. Cereal Chem. 61, 336–339.
5. Martin C.R., Rousser R., and Brabec D.L., 1993. Develop-ment of a single - grain characterization system. Transactions of the ASAE, 36, 1399–1404.
6. Miœ A. and Geodecki M., 2000.Changes in wheat grain hard-ness during ripening and harvest (in Polish). Acta Agrophy-sica, 37, 119–129.
7. Miœ A., Grundas S., and Geodecki M., 2000.Changes in hardness and thickness of wheat grain as a result of its moistening. Int. Agrophysics, 14, 203–206.
8. Nakatsu S., 1998.Effects of wetting treatment period and moisture content on water uptake by wheat grain during germination and alpha-amylase activity. Japanese Journal of Crop Science, 67, 165–169.
9. Osborne B.G., Kotwal Z., Blakeney A.B., O'Brien L., Shah S., and Tearn T., 1997.Application of the single-grain cha-racterization system to wheat receiving testing and quality prediction. Cereal Chem., 74, 467–470.
10. Perten Instruments North America: SKCS 4100 Single Grain Characterization System,1995. Instruction Manual, Perten Instruments North America, Reno, NV.
11. Pomeranz Y., Bolling H., and Zwingelberg H., 1984.Wheat hardness and baking properties of wheat flour. J. Cereal Sci., 2, 137–143.
12. Preston K.R., Dexter J.E., and Kruger J.E., 1978. Rela-tionship of exoproteolytic and endoproteolytic activity to storage protein hydrolysis in germinating durum and hard red spring wheat. Cereal Chem., 55, 877–888.
13. Satumbaga R., Martin C., Eustace D., and Deyoe C.W., 1995. Relation of physical and milling properties hard red winter wheat using the single kernel wheat characterization system. Association of Operative Millers - Bulletin, January, 6487–6496.
15.WoŸniak W., 2001.Effect of moisture treatment of wheat grains on technological hardness (in Polish). Acta Agrophy-sica, 46, 227– 233.