I
I
I
N
N
N
T
T
T
E
E
E
R
R
R
N
N
N
A
A
A
T
T
T
I
I
I
O
O
O
N
N
N
A
A
A
L
L
L
J
J
J
O
O
O
U
U
U
R
R
R
N
N
N
A
A
A
L
L
L
O
O
O
F
F
F
R
R
R
E
E
E
S
S
S
E
E
E
A
A
A
R
R
R
C
C
C
H
H
H
I
I
I
N
N
N
C
C
C
O
O
O
M
M
M
M
M
M
E
E
E
R
R
R
C
C
C
E
E
E
,
,
,
I
I
I
T
T
T
A
A
A
N
N
N
D
D
D
M
M
M
A
A
A
N
N
N
A
A
A
G
G
G
E
E
E
M
M
M
E
E
E
N
N
N
T
T
T
A Monthly Double-Blind Peer Reviewed Refereed Open Access International e-Journal - Included in the International Serial Directories
Indexed & Listed at: Ulrich's Periodicals Directory ©, ProQuest, U.S.A., Index Copernicus Publishers Panel, Poland, Open J-Gage, India
C
C
C
CONTENTS
ONTENTS
ONTENTS
ONTENTS
Sr.
No.
TITLE & NAME OF THE AUTHOR (S)
Page No.
1
.
CONFLICT MANAGEMENT AND LEADERSHIP STYLE AS PREDICTORS OF ORGANISATIONAL LEARNINGARUNA B. BHAT, DR. SANTOSH RANGNEKAR & DR. MUKESH BARUA
1
2
.
A STUDY ON TRAINING FACTORS AND ITS IMPACT ON TRAINING EFFECTIVENESS IN KEDAH STATE DEVELOPMENT CORPORATION, KEDAH, MALAYSIADR. VIMALA SANJEEVKUMAR & HU YANAN
8
3
.
EDUCATIONAL HYPERMEDIA - IMPACTS ON TEACHING AND LEARNING PROCESSESDR. SALAH ALKHAFAJI. & B.SRIRAM.
16
4
.
TECHNOLOGICAL ‘CATCHING UP’ IN BANGLADESH-EPZS: A PERFORMANCE APPRAISALDR. TAIMUR SHARIF & DR. JAMAL UDDIN AHMED
21
5
.
APPRAISING ICT RELEVANCE IN POLITICAL ADVERTISINGDR. CHINENYE NWABUEZE, RITA OKEKE & FESTINUS OKOYE
32
6
.
EFFECTIVE MAINTENANCE MANAGEMENT IN PETROCHEMICAL INDUSTRIESN. K. K. PRASANNA & TUSHAR N. DESAI
36
7
.
IMPACT OF BUSINESS TYPES ON THE PROBLEMS FACED BY SHG WOMEN ENTREPRENEURSDR. M. R. VANITHAMANI & DR. S. SANDHYA MENON
41
8
.
MORALE AND MOTIVATION OF PUBLIC SECTOR BANK EMPLOYEES (A CASE STUDY OF KURNOOL CITY IN A.P.)DR. G. RAMA KRISHNA, P. BASAIAH, DR. A. HARI HARA NATH REDDY & K. VENU GOPAL RAO
45
9
.
HIDDEN MOTIVATORS OF TELECOM EMPLOYEESDR. PRATIMA VERMA
50
10
.
MICROFINANCE IN INDIAR. RAJENDRAKUMAR & DR. S. ASOKKUMAR
55
11
.
IDENTIFICATION OF IT GOVERNANCE PRACTICES & HUMAN RESOURCES IMPACTING BUSINESS - IT ALIGNMENT IN THE INDIAN IT CONTEXTLAKSHMI VISHNU MURTHY TUNUGUNTLA & DR. MU.SUBRAHMANIAN
57
12
.
CONSUMER’S PERCEPTION AND PURCHASE INTENTIONS TOWARDS GREEN PRODUCTSDASARI.PANDURANGARAO, SHAIK.CHAND BASHA & K.V.R.SATYAKUMAR
63
13
.
ROUGH SET THEORY IN ANALYSING THE CONSUMER AWARENESS ABOUT FACE WASH PRODUCTS IN CHENNAI CITYC.R.SENTHILNATHAN
67
14
.
A STUDY ON BRAND PREFERENCE OF MOBILE PHONE CUSTOMERS WITH REFERENCE TO ERODE CITYDR. P. KARTHIKEYAN
72
15
.
RELATIONSHIP BETWEEN WORKING CAPITAL AND PROFITABILITY: AN EMPIRICAL ANALYSISM. SUMAN KUMAR, S. MD. AZASH & N. VENKATA RAMANA
77
16
.
FEMALE WORKFORCE - A MISSING PILLAR OF HUMAN RESOURCE DEVELOPMENT IN THE GLOBALIZATION ERAFIONA JEELANI, ZEENAZ ELIZABETH & DR. PARVEZ A. MIR
81
17
.
AN ANALYSIS ON IMPACT OF MOBILE PHONES ON INDIAN CONSUMER - A COMPARATIVE STUDYSHEETAL SINGLA & DR. SANJIV BANSAL
86
18
.
‘SOFT SKILLS’- AN ESSENTIALITY IN TODAY’S BUSINESS ENGLISHJAYATEE CHAKRABORTY
96
19
.
ROLE OF RFID TECHNOLOGY IN HOSPITALSDR. L. KALYAN VISWANATH REDDY & RAMAIAH ITUMALLA
100
20
.
A COMPARATIVE STUDY OF CORPORATE GOVERNANCE DISCLOSURE PRACTICE OF ELECON AND GMMJAIMIN H. TRIVEDI & DIVYANG V. BHRAMBHATT
106
21
.
A STUDY ON WORKING CAPITAL MANAGEMENT IN TAMILNADU SUGAR CORPORATION LIMITED (TASCO)DR. P. KANAGARAJU
109
22
.
PERFORMANCE EVALUATION AND BARRIERS OF CRM PRACTICES IN HIGHER EDUCATIONDR. NARINDER TANWAR
113
23
.
SERVICE QUALITY GAP IN PRIVATE HOSPITALSVANISHREE
119
24
.
MEASURING IMPACT OF TRAINING ON DEVELOPMENT: A STATISTICAL APPROACHS. AMOLAK SINGH
122
25
.
IMPACT OF STRESS ON WORK-LIFE-BALANCE OF WOMEN EMPLOYEES WITH REFERENCE TO BPO AND EDUCATION SECTORS IN BANGALOREK. THRIVENI KUMARI
129
CHIEF PATRON
CHIEF PATRON
CHIEF PATRON
CHIEF PATRON
PROF. K. K. AGGARWAL
Chancellor, Lingaya’s University, Delhi
Founder Vice-Chancellor, Guru Gobind Singh Indraprastha University, Delhi
Ex. Pro Vice-Chancellor, Guru Jambheshwar University, Hisar
PATRON
PATRON
PATRON
PATRON
SH. RAM BHAJAN AGGARWAL
Ex. State Minister for Home & Tourism, Government of Haryana
Vice-President, Dadri Education Society, Charkhi Dadri
President, Chinar Syntex Ltd. (Textile Mills), Bhiwani
CO
CO
CO
CO----ORDINATOR
ORDINATOR
ORDINATOR
ORDINATOR
AMITA
Faculty, Government M. S., Mohali
ADVISORS
ADVISORS
ADVISORS
ADVISORS
DR. PRIYA RANJAN TRIVEDI
Chancellor, The Global Open University, Nagaland
PROF. M. S. SENAM RAJU
Director A. C. D., School of Management Studies, I.G.N.O.U., New Delhi
PROF. M. N. SHARMA
Chairman, M.B.A., Haryana College of Technology & Management, Kaithal
PROF. S. L. MAHANDRU
Principal (Retd.), Maharaja Agrasen College, Jagadhri
EDITOR
EDITOR
EDITOR
EDITOR
PROF. R. K. SHARMA
Professor, Bharti Vidyapeeth University Institute of Management & Research, New Delhi
CO
CO
CO
CO----EDITOR
EDITOR
EDITOR
EDITOR
DR. BHAVET
Faculty, M. M. Institute of Management, Maharishi Markandeshwar University, Mullana, Ambala, Haryana
EDITORIAL ADVISORY BOARD
EDITORIAL ADVISORY BOARD
EDITORIAL ADVISORY BOARD
EDITORIAL ADVISORY BOARD
DR. RAJESH MODI
Faculty, Yanbu Industrial College, Kingdom of Saudi Arabia
PROF. SANJIV MITTAL
University School of Management Studies, Guru Gobind Singh I. P. University, Delhi
PROF. ANIL K. SAINI
Chairperson (CRC), Guru Gobind Singh I. P. University, Delhi
DR. SAMBHAVNA
Faculty, I.I.T.M., Delhi
DR. MOHENDER KUMAR GUPTA
DR. SHIVAKUMAR DEENE
Asst. Professor, Government F. G. College Chitguppa, Bidar, Karnataka
MOHITA
Faculty, Yamuna Institute of Engineering & Technology, Village Gadholi, P. O. Gadhola, Yamunanagar
ASSOCIATE EDITORS
ASSOCIATE EDITORS
ASSOCIATE EDITORS
ASSOCIATE EDITORS
PROF. NAWAB ALI KHAN
Department of Commerce, Aligarh Muslim University, Aligarh, U.P.
PROF. ABHAY BANSAL
Head, Department of Information Technology, Amity School of Engineering & Technology, Amity University, Noida
PROF. A. SURYANARAYANA
Department of Business Management, Osmania University, Hyderabad
DR. ASHOK KUMAR
Head, Department of Electronics, D. A. V. College (Lahore), Ambala City
DR. SAMBHAV GARG
Faculty, M. M. Institute of Management, Maharishi Markandeshwar University, Mullana, Ambala, Haryana
DR. V. SELVAM
Divisional Leader – Commerce SSL, VIT University, Vellore
DR. PARDEEP AHLAWAT
Reader, Institute of Management Studies & Research, Maharshi Dayanand University, Rohtak
S. TABASSUM SULTANA
Asst. Professor, Department of Business Management, Matrusri Institute of P.G. Studies, Hyderabad
SURJEET SINGH
Asst. Professor, Department of Computer Science, G. M. N. (P.G.) College, Ambala Cantt.
TECHNICAL ADVISOR
TECHNICAL ADVISOR
TECHNICAL ADVISOR
TECHNICAL ADVISOR
AMITA
Faculty, Government H. S., Mohali
MOHITA
Faculty, Yamuna Institute of Engineering & Technology, Village Gadholi, P. O. Gadhola, Yamunanagar
FINANCIAL ADVISORS
FINANCIAL ADVISORS
FINANCIAL ADVISORS
FINANCIAL ADVISORS
DICKIN GOYAL
Advocate & Tax Adviser, Panchkula
NEENA
Investment Consultant, Chambaghat, Solan, Himachal Pradesh
LEGAL ADVISORS
LEGAL ADVISORS
LEGAL ADVISORS
LEGAL ADVISORS
JITENDER S. CHAHAL
Advocate, Punjab & Haryana High Court, Chandigarh U.T.
CHANDER BHUSHAN SHARMA
Advocate & Consultant, District Courts, Yamunanagar at Jagadhri
SUPERINTENDENT
SUPERINTENDENT
SUPERINTENDENT
SUPERINTENDENT
CALL FOR MANUSCRIPTS
CALL FOR MANUSCRIPTS
CALL FOR MANUSCRIPTS
CALL FOR MANUSCRIPTS
Weinvite unpublished novel, original, empirical and high quality research work pertaining to recent developments & practices in the area of Computer, Business, Finance, Marketing, Human Resource Management, General Management, Banking, Insurance, Corporate Governance and emerging paradigms in allied subjects like Accounting Education; Accounting Information Systems; Accounting Theory & Practice; Auditing; Behavioral Accounting; Behavioral Economics; Corporate Finance; Cost Accounting; Econometrics; Economic Development; Economic History; Financial Institutions & Markets; Financial Services; Fiscal Policy; Government & Non Profit Accounting; Industrial Organization; International Economics & Trade; International Finance; Macro Economics; Micro Economics; Monetary Policy; Portfolio & Security Analysis; Public Policy Economics; Real Estate; Regional Economics; Tax Accounting; Advertising & Promotion Management; Business Education; Business Information Systems (MIS); Business Law, Public Responsibility & Ethics; Communication; Direct Marketing; E-Commerce; Global Business; Health Care Administration; Labor Relations & Human Resource Management; Marketing Research; Marketing Theory & Applications; Non-Profit Organizations; Office Administration/Management; Operations Research/Statistics; Organizational Behavior & Theory; Organizational Development; Production/Operations; Public Administration; Purchasing/Materials Management; Retailing; Sales/Selling; Services; Small Business Entrepreneurship; Strategic Management Policy; Technology/Innovation; Tourism, Hospitality & Leisure; Transportation/Physical Distribution; Algorithms; Artificial Intelligence; Compilers & Translation; Computer Aided Design (CAD); Computer Aided Manufacturing; Computer Graphics; Computer Organization & Architecture; Database Structures & Systems; Digital Logic; Discrete Structures; Internet; Management Information Systems; Modeling & Simulation; Multimedia; Neural Systems/Neural Networks; Numerical Analysis/Scientific Computing; Object Oriented Programming; Operating Systems; Programming Languages; Robotics; Symbolic & Formal Logic and Web Design. The above mentioned tracks are only indicative, and not exhaustive.
Anybody can submit the soft copy of his/her manuscript anytime in M.S. Word format after preparing the same as per our submission guidelines duly available on our website under the heading guidelines for submission, at the email addresses: [email protected]or
GUIDELINES FOR SUBMISSION OF MANUSCRIPT
GUIDELINES FOR SUBMISSION OF MANUSCRIPT
GUIDELINES FOR SUBMISSION OF MANUSCRIPT
GUIDELINES FOR SUBMISSION OF MANUSCRIPT
1. COVERING LETTER FOR SUBMISSION:
DATED: _____________
THE EDITOR
IJRCM
Subject:SUBMISSION OF MANUSCRIPT IN THE AREA OF .
(e.g. Computer/IT/Engineering/Finance/Marketing/HRM/General Management/other, please specify).
DEAR SIR/MADAM
Please find my submission of manuscript titled ‘___________________________________________’ for possible publication in your journals.
I hereby affirm that the contents of this manuscript are original. Furthermore, it has neither been published elsewhere in any language fully or partly, nor is it under review for publication anywhere.
I affirm that all author (s) have seen and agreed to the submitted version of the manuscript and their inclusion of name (s) as co-author (s).
Also, if my/our manuscript is accepted, I/We agree to comply with the formalities as given on the website of journal & you are free to publish our contribution in any of your journals.
NAME OF CORRESPONDING AUTHOR:
Designation:
Affiliation with full address, contact numbers & Pin Code:
Residential address with Pin Code:
Mobile Number (s):
Landline Number (s):
E-mail Address:
Alternate E-mail Address:
2. MANUSCRIPT TITLE: The title of the paper should be in a 12 point Calibri Font. It should be bold typed, centered and fully capitalised.
3. AUTHOR NAME (S) & AFFILIATIONS: The author (s) full name, designation, affiliation (s), address, mobile/landline numbers, and email/alternate email address should be in italic & 11-point Calibri Font. It must be centered underneath the title.
4. ABSTRACT: Abstract should be in fully italicized text, not exceeding 250 words. The abstract must be informative and explain the background, aims, methods,
5. KEYWORDS: Abstract must be followed by list of keywords, subject to the maximum of five. These should be arranged in alphabetic order separated by commas and full stops at the end.
6. MANUSCRIPT: Manuscript must be in BRITISH ENGLISH prepared on a standard A4 size PORTRAIT SETTING PAPER. It must be prepared on a single space and
single column with 1” margin set for top, bottom, left and right. It should be typed in 8 point Calibri Font with page numbers at the bottom and centre of the every page. It should be free from grammatical, spelling and punctuation errors and must be thoroughly edited.
7. HEADINGS: All the headings should be in a 10 point Calibri Font. These must be bold-faced, aligned left and fully capitalised. Leave a blank line before each
heading.
8. SUB-HEADINGS: All the sub-headings should be in a 8 point Calibri Font. These must be bold-faced, aligned left and fully capitalised.
9. MAIN TEXT: The main text should follow the following sequence:
INTRODUCTION
REVIEW OF LITERATURE
NEED/IMPORTANCE OF THE STUDY
STATEMENT OF THE PROBLEM
OBJECTIVES
HYPOTHESES
RESEARCH METHODOLOGY
RESULTS & DISCUSSION
FINDINGS
RECOMMENDATIONS/SUGGESTIONS
CONCLUSIONS
SCOPE FOR FURTHER RESEARCH
ACKNOWLEDGMENTS
REFERENCES
APPENDIX/ANNEXURE
It should be in a 8 point Calibri Font, single spaced and justified. The manuscript should preferably not exceed 5000 words.
10. FIGURES &TABLES: These should be simple, centered, separately numbered & self explained, and titles must be above the table/figure. Sources of data should be mentioned below the table/figure. It should be ensured that the tables/figures are referred to from the main text.
11. EQUATIONS: These should be consecutively numbered in parentheses, horizontally centered with equation number placed at the right.
12. REFERENCES: The list of all references should be alphabetically arranged. The author (s) should mention only the actually utilised references in the preparation
of manuscript and they are supposed to follow Harvard Style of Referencing. The author (s) are supposed to follow the references as per following:
•
All works cited in the text (including sources for tables and figures) should be listed alphabetically.•
Use (ed.) for one editor, and (ed.s) for multiple editors.•
When listing two or more works by one author, use --- (20xx), such as after Kohl (1997), use --- (2001), etc, in chronologically ascending order.•
Indicate (opening and closing) page numbers for articles in journals and for chapters in books.•
The title of books and journals should be in italics. Double quotation marks are used for titles of journal articles, book chapters, dissertations, reports, working papers, unpublished material, etc.•
For titles in a language other than English, provide an English translation in parentheses.•
The location of endnotes within the text should be indicated by superscript numbers.PLEASE USE THE FOLLOWING FOR STYLE AND PUNCTUATION IN REFERENCES: BOOKS
•
Bowersox, Donald J., Closs, David J., (1996), "Logistical Management." Tata McGraw, Hill, New Delhi.•
Hunker, H.L. and A.J. Wright (1963), "Factors of Industrial Location in Ohio," Ohio State University.CONTRIBUTIONS TO BOOKS
•
Sharma T., Kwatra, G. (2008) Effectiveness of Social Advertising: A Study of Selected Campaigns, Corporate Social Responsibility, Edited by David Crowther & Nicholas Capaldi, Ashgate Research Companion to Corporate Social Responsibility, Chapter 15, pp 287-303.JOURNAL AND OTHER ARTICLES
•
Schemenner, R.W., Huber, J.C. and Cook, R.L. (1987), "Geographic Differences and the Location of New Manufacturing Facilities," Journal of Urban Economics, Vol. 21, No. 1, pp. 83-104.CONFERENCE PAPERS
•
Garg Sambhav (2011): "Business Ethics" Paper presented at the Annual International Conference for the All India Management Association, New Delhi, India, 19–22 June.UNPUBLISHED DISSERTATIONS AND THESES
•
Kumar S. (2011): "Customer Value: A Comparative Study of Rural and Urban Customers," Thesis, Kurukshetra University, Kurukshetra.ONLINE RESOURCES
•
Always indicate the date that the source was accessed, as online resources are frequently updated or removed.WEBSITE
A STUDY ON BRAND PREFERENCE OF MOBILE PHONE CUSTOMERS WITH REFERENCE TO ERODE CITY
DR. P. KARTHIKEYAN
ASSOCIATE PROFESSOR
DEPARTMENT OF MBA
VELALAR COLLEGE OF ENGINEERING AND TECHNOLOGY
ERODE
ABSTRACT
Economic development of a country is usually measured in terms of rise in standard of living of its people. An increase in standard of living revealed by an increase in consumptions of items of comforts and luxuries and not merely use of items meeting the base minimum necessities of life what was considered as luxuries a decade ago, has become necessity now- Television, two wheelers, refrigerators, washing machines and the like have become indispensable items in every house. Out of the listed domestic appliances, television releases the family member and their exertion. In this research paper, the Researcher made an attempt to analyse the mobile phone brand preference among the customers in Erode city of Tamil nadu, India.
KEYWORDS
Economic development, Standard of living, Brand, Customer, Product.
INTRODUCTION
he study of any subject is made easier by examining it in an organized manner. Therefore, we should determine the general classes of variables influencing consumers behaviour understand the nature of these variables, and hear how to make inferences based on this knowledge. Knowledge of consumer behaviour would render immense help for planning and implementing marketing strategies. A modern marketer first tries to understand the consumers and their response, and then he studies the basic characteristic of their behaviour. It can be said that the consumer is the pivot around which the whole marketing system revolves. The selection on choice of products or services by consumers greatly – determine the fate of the producers. The marketer must know the consumer more and more in order to manufacture the products which give them satisfaction in the way consumers need. The marketer is always interest to know how consumer respond to various marketing stimuli, such as product price, place and promotion and other stimuli, i.e., buyer environment such as economic, technical, political and cultural. The factors that influence the consumer behaviour are internal and external, internals and need, motives, perception and attitude, external factors are family, social, groups, culture, business etc. “The whole behaviour of a person while making purchase may be termed as consumer behaviour”. “Consumer behaviour may be defined as that behaviours exhibited by people in planning, purchasing and using economic goods and services”.
According to Webster “Buying Behaviour is all psychological, social and physical behaviour of potential consumers as they become aware of evaluate, purchase, consumer and tell other people about products and services”. In today’s highly competitive environments, improving consumer’s brand preference permits marketers to maintain a comfortable and lasting position in the market place. The new millennium is not just a new beginning, it is a continuation of trends in human behaviour that have been following cyclical patterns throughout our country’s history. Just because we have entered a new era does not mean we have to start from scratch when it comes to interpreting why certain consumers are loyal to certain brands, and what type of factors influence these allegiances. Brand preference is the consumer’s taste to consume a particular product or service expressed through their intention or behaviour, to repurchase a brand continually. It occurs because the consumer perceives that the brand offers the right product features, image or level of quality at the right price. Consumer behaviour is habitual because habits are safe and familiar. It order to create brand preference the advertisers must meet consumers’ tastes and analyse their habits, help them to acquire new habits, and reinforce those habits by reminding consumers of the value of their purchase and encourage them to continue purchasing those products in future.
OBJECTIVES OF THE STUDY
• To analyse the brand preference of consumers towards Mobile products with special reference to Erode.
• To study the customer opinion and their level of satisfaction towards the usage of the company products.
• To identify the various factors influencing the purchase of Mobile products in the study area.
• To give few suggestions for the betterment of the product based on the major findings.
RESEARCH METHODOLOGY
SAMPLING TECHNIQUE
The sampling procedure adopted for this study is convenience sampling. TOOLS USED FOR ANALYSIS OF DATA
• Simple percentage method
• Weighted average method
• Chi-square test
SCOPE OF THE STUDY
The most vital function of management in an organization is to minimize risk and uncertainty through systematic decision-making. Better decisions result from the effective and timely utilization of right information about the consumers, dealers, competitors and others. Marketing as a functional area of management is becoming increasingly important as compared to other fields viz. production, finance, personnel and others. A substantial proportion of all marketing research involves the direct study of people. The kinds of people studied are extremely varied including such individuals as housewife, children, and executive of large corporations and managers of small business. Consumer attitudes and preference from one of the foundation stones for research. Attitudes are among the most complex least understand, but most used social, psychological concepts in marketing. The researcher has made an attempt to study the consumer brand preference and how for the consumers using the old brand. Every business handles the goods and services. While producers are interested in heavy process and huge profit every producer is also a consumer.
LIMITATIONS OF THE STUDY
1. Sample size has been restricted to 300 samples due to time constraints and the researcher cannot do in-depth analysis.
2. The study is confined to the respondents at Erode alone, this is not applicable to other district.
3. The study was conducted with short span of time and therefore it was based on the available respondents.
4. The details given by the respondents are considered as true and the study results are based on this assumption.
DATA ANALYSIS AND INTERPRETATION
TABLE NO.1: AGE OF THE RESPONDENTS
S. No. Age (in Years) No. of Respondents Percentage (%)
1. Less than 20 80 26.7
2. 20-30 104 34.7
3. 31-50 84 28.0
4. Above 50 32 10.6
Total 300 100.0
It is identified from the analysis that 26.7% of the respondents fall in the age group of less than 20 years, 34.7% of the respondents fall in the age group of 20-30 years, 28.0% of the respondents fall in the age group of less than 20 years and 10.6% of the respondents fall in the age group of above 50 years. It is concluded from the above analysis that majority of the respondents fall in the age group of 20-30 years.
It is concluded that most of the respondents (104) respondents fall in the age group of between 20 – 30 years.
TABLE NO. 2: MARITAL STATUS OF THE RESPONDENTS S. No. Marital Status No. of Respondents Percentage (%)
1. Married 198 66.0
2. Single 102 34.0
Total 300 100.0
It is noted from the analysis that 66.0% of the respondents are married and 34.0% of the respondents are single. It is concluded from the above analysis that majority of the respondents are married.
It is concluded that most of the respondents (198) are married.
TABLE NO. 3: EDUCATIONAL QUALIFICATION OF THE RESPONDENTS S. No. Educational Qualification No. of Respondents Percentage (%)
1. Illiterate 45 15.0
2. School level 128 42.7
3. Diploma or ITI 75 25.0
4. Degree level 36 12.0
5. Others 16 5.3
Total 300 100.0
It is identified from the analysis that 15.0% of the respondents are illiterates, 42.7% of the respondents are educated till school level, 25.0% of the respondents are educated till diploma (or) ITI, 12.0% of the respondents are educated till degree level and remaining 5.3% of the respondents are having some educational qualification. It is concluded from the above analysis that majority of the respondents are educated till school level.
It is concluded that most of the respondents (128) are illiterates.
TABLE NO. 4: FAMILY MEMBERS OF THE RESPONDENTS S. No. Family Members No. of Respondents Percentage (%)
1. Upto 3 106 35.3
2. 4 82 27.3
3. 5 98 32.7
4. Above 5 14 4.7
Total 300 100.0
It is highlighted from the analysis that 35.3% of the respondents are having upto three members, 27.3% of the respondents are having four members, 32.7% of the respondents are having upto five members and 4.7% of the respondents are having above five members. It is concluded from the above analysis that majority of the respondents are having upto three members.
It is concluded that most of the respondents (106) are having upto three members in their family.
TABLE NO. 5: SOURCES OF INFORMATION
S. No. Sources No. of Respondents Percentage (%)
1. Advertisement 129 43.0
2. Friends & Relatives 102 34.0
3. Shop owners and retailers 69 23.0
Total 300 100.0
It is observed from the analysis that 43.0% of the respondents are getting information about the Mobile products through advertisement, 34.0% of the respondents are getting information about the Mobile products through friends and relatives and 23.0% of the respondents are getting information about the Mobile products through shop owners and retailers. It is concluded from the above analysis that majority of the respondents are getting information about the Mobile products through advertisement.
It is concluded that most of the respondents (129) are getting information about the Mobile products through advertisement.
TABLE NO. 6: BUYING THE MOBILE PRODUCTS S. No. Opinion No. of Respondents Percentage (%)
1. Showroom 223 74.3
2. Retailers 55 18.3
3. Traders 22 7.3
Total 300 100.0
It is analysed from the analysis that 74.3% of the respondents are buying Mobile products through showroom, 18.3% of the respondents are buying Mobile products through retailers and 7.3% of the respondents are buying Mobile products through traders. It is concluded from the above analysis that majority of the respondents are buying Mobile products through showroom.
TABLE NO. 7: OPINION ABOUT THE PRICE OF MOBILE PRODUCTS S. No. Opinion No.of Respondents Percentage (%)
1. Highly satisfied 112 37.3
2. Satisfied 142 47.3
3. Neutral 25 8.3
4. Dissatisfied 16 5.3
5. Highly satisfied 5 1.7
Total 300 100.0
It is analysed from the analysis that 37.3% of the respondents are highly satisfied with the price of the Mobile products, 47.3% of the respondents are satisfied with the price of the Mobile products, 8.3% of the respondents are neutrally satisfied with the price of the Mobile products, 5.3% of the respondents are dissatisfied with the price of the Mobile products and 1.7% of the respondents are highly dissatisfied with the price of the Mobile products. It is concluded from the above analysis that majority of the respondents are satisfied with the price of the Mobile products.
It is concluded that most of the respondents (142) respondents are highly satisfied with the price of the Mobile products.
TABLE NO. 8: FACTORS AFFECTING TOWARDS SALES OF MOBILE S. No. Factors No.of Respondents Percentage (%)
1. Competitors 68 22.7
2. Price 102 34.0
3. Poor Advertisement 79 26.3
4. Bad Quality 51 17.0
Total 300 100.0
It is observed from the analysis that 22.7% of the respondents are opined that the sales of Mobile products was affected by the competitors, 34.0% of the respondents are opined that the sales of Mobile products was affected by the price factor, 26.3% of the respondents are opined that the sales of Mobile products was affected by the poor advertisement and 17.0% of the respondents are opined that the sales of Mobile products was affected by the bad quality. It is concluded from the above analysis that majority of the respondents are opined that the sales of Mobile products was affected by the price factor.
It is concluded that most of the respondents (102) respondents are opined that the sales of Mobile products was affected by the competitors
TABLE NO. 9: OPINION ABOUT THE AVAILABILITY OF MOBILE PRODUCT S. No. Opinion No.of Respondents Percentage (%)
1. Available 252 84.0
2. Not available 48 16.0
Total 300 100.0
It reveals from the analysis that 84.0% of the respondents are opined that the Mobile products easily available in the market and remaining 16.0% of the respondents are opined that the Mobile products not easily available in the market. It is concluded from the above analysis that majority of the respondents are opined that the Mobile products easily available in the market.
It is concluded that most of the respondents (252) are opined that the Mobile products easily available in the market and remaining.
TABLE NO. 10: CHOOSING THE PRICE LEVEL
S. No. Price No. of Respondents Percentage (%)
1 High price 70 23.3
2 Medium price 140 46.7
3 Low price 90 30.0
Total 300 100.0
It is noted from the analysis that 23.3% of the respondents are choosing high price level products, 46.7% of the respondents are choosing medium price level products and 30.0% of the respondents are choosing low price level products. It is concluded from the above analysis that majority of the respondents are choosing medium price level products.
It is concluded that most of the respondents (140) are choosing high price level products.
TABLE NO. 11: OPINION ABOUT THE MOBILE ADVERTISEMENTS S. No. Opinion No. of Respondents Percentage (%)
1. Highly satisfied 33 11.0
2. Satisfied 145 48.3
3. Neutral 103 34.3
4. Dissatisfied 12 4.0
5. Highly dissatisfied 7 2.3
Total 300 100.0
It is identified from the analysis that 11.0% of the respondents are highly satisfied with the Mobile advertisement, 48.3% of the respondents are satisfied with the Mobile advertisement, 34.3% of the respondents are neutrally satisfied with the Mobile advertisement, 4.0% of the respondents are dissatisfied with the Mobile advertisement and 2.3% of the respondents are highly dissatisfied with the Mobile advertisement. It is concluded from the above analysis that majority of the respondents are satisfied with the Mobile advertisement.
It is concluded that most of the respondents (145) are highly satisfied with the Mobile advertisement.
TABLE NO. 12: RESPONDENTS OPINION ON MEDIA OF ADVERTISEMENT S. No. Media No. of Respondents Percentage (%)
1 Television 188 62.7
2 Newspaper 85 28.3
3 Radio 27 9.0
4 Others 0 0
Total 300 100.0
Mobile products. It is concluded from the above analysis that majority of the respondents are preferred television media is best media for advertise Mobile products.
It is concluded that most of the respondents (188) are preferred television media is best media for advertise Mobile products.
TABLE NO. 13: OPINION ABOUT THE SALESMAN RELATIONSHIP WITH CUSTOMERS S. No. Opinion No. of Respondents Percentage (%)
1. Highly satisfied 123 41.0
2. Satisfied 94 31.3
3. Neutral 54 18.0
4. Dissatisfied 21 7.0
5. Highly dissatisfied 8 2.7
Total 300 100.0
It shows from the analysis that 41.0% of the respondents are highly satisfied with the salesman relationship, 31.3% of the respondents are satisfied with the salesman relationship, 18.0% of the respondents are neutrally satisfied with the salesman relationship, 7.0% of the respondents are dissatisfied with the salesman relationship and 2.7% of the respondents are highly dissatisfied with the salesman relationship. It is concluded from the above analysis that majority of the respondents are highly satisfied with the salesman relationship.
It is concluded that most of the respondents (123) are highly satisfied with the salesman relationship.
II. WEIGHTED AVERAGE METHOD
TABLE NO. 14: REASON FOR SELECTING THE MOBILE PROUCTS S. No. Factors Weighted Score Rank
1. Price 1063 II
2. Quality 1079 I
3. Colour 1021 III
4. Style 816 IV
5. Availability 687 V
The above table shows the reasons for selecting the Mobile products. It is identified from the analysis that most of the respondents are selected the reason of its quality which influenced to select the products with scored as 1079 points. It is followed from the second and third reasons are ‘price’ and ‘colour’ with scored as 1063 points and 1021 points. The fourth and fifth reasons are ‘Style’ and ‘Availability’ with scored as 816 points and 687 points.
It is concluded from the above analysis that majority of the respondents are selecting the Mobile products for the reason of its ‘high quality’ and ‘Price’.
III. CHI-SQUARE ANALYSIS
TABLE NO. 15: GENDER AND BUYING MODE OF THE MOBILE PRODUCTS (TWO-WAY TABLE)
S.No. Gender Buying the Mobile products Total %
Showroom % Retailers % Traders %
1 Male 104 47 33 160 16 73 153 551
2 Female 119 53 22 40 6 27 147 449
Total 223 100 55 100 22 100 300 1100
From the above table it is observed that 153 (51%) respondents come under the male category among male with the medium and high level of satisfaction. 147 respondents come under the female category with the medium level of satisfaction.
Null Hypothesis (H0) : There is no significant relationship between gender of the respondents and buying factors mode of the Mobile products.
Alternative Hypothesis (H) : There is a close significant relationship between gender of the respondents and buying factors of the Mobile products.
CHI-SQUARE RESULT :
Calculated χ2 Value = 7.637
Degree of Freedom = 2
Table value = 5.991
Significant level = 5% level
It is identified from the above analysis that the calculated chi-square value is greater than the table value and the Null hypothesis rejected. Hence, there is a close significant relationship between gender of the respondents and buying mode the Mobile products.
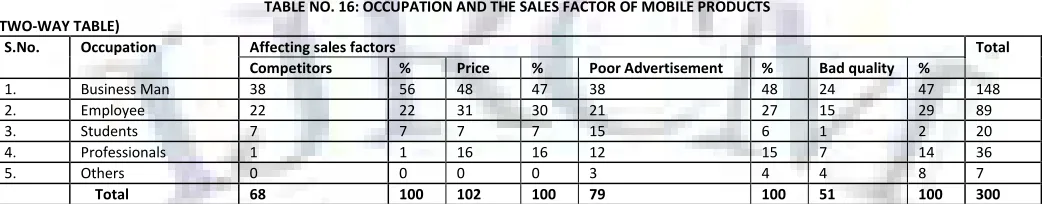
TABLE NO. 16: OCCUPATION AND THE SALES FACTOR OF MOBILE PRODUCTS (TWO-WAY TABLE)
S.No. Occupation Affecting sales factors Total
Competitors % Price % Poor Advertisement % Bad quality %
1. Business Man 38 56 48 47 38 48 24 47 148
2. Employee 22 22 31 30 21 27 15 29 89
3. Students 7 7 7 7 15 6 1 2 20
4. Professionals 1 1 16 16 12 15 7 14 36
5. Others 0 0 0 0 3 4 4 8 7
Total 68 100 102 100 79 100 51 100 300
From the above table it is observed that 148 respondents belong to the Business Man with the medium level of satisfaction. 89 respondents belong to the Employee with the high level of satisfaction.36 respondents belong to the Professionals with the medium level of satisfaction.20 respondents belong to the Students with the high level of satisfaction.7 respondents belong to the others with the medium level of satisfaction.
Null Hypothesis (H0) : There is no significant relationship between occupation and affect the sales factor of Mobile products.
Alternative Hypothesis (H1) : There is a close significant relationship between occupation and affect the sales factor of Mobile products.
CHI-SQUARE RESULT
Calculated χ2 Value = 23.831
Degree of Freedom = 12
Table value = 21.026
It is identified from the above analysis that the calculated chi-square value is greater than the table value and the Null hypothesis rejected. Hence, there is a close significant relationship between occupation and affect the sales factor of Mobile products.
TABLE NO. 17: MONTHLY INCOME AND BUYING FACTORS OF THE MOBILE PRODUCTS (TWO-WAY TABLE) S.No. Monthly income Buying factors of the Mobile products Total %
Showroom % Retailers % Traders %
1. Upto 5000 49 22 12 22 1 5 62 21
2. Between 5001-10000 100 44 20 36 6 27 126 42
3. Between 10001-15000 55 25 18 33 7 32 80 27
4. Above 15000 19 8 5 9 8 36 32 10
Total 223 100 55 100 22 100 300 100
From the above table it is observed that 126 respondents buying factors of the Mobile products belong to the between 5001-10000 of monthly income with the medium level of satisfaction. 80 respondents buying factors of the Mobile products belong to the between 10001-15000 of monthly income with the medium level of satisfaction. 62 respondents buying factors of the Mobile products belong to the upto 5000 of monthly income with the high level of satisfaction. 32 respondents buying factors of the Mobile products belong to Above 15000 of monthly income with the medium level of satisfaction.
Null Hypothesis (H0) : There is no significant relationship between monthly income of the respondents and buying factors of the Mobile products.
Alternative Hypothesis (H0) : There is a close significant relationship between monthly income of the respondents and buying factors of the Mobile
products.
CHI-SQUARE RESULT
Calculated χ2 Value = 20.990
Degree of Freedom = 6
Table value = 12.592
Significant level = 5% level
It is identified from the above analysis that the calculated chi-square value is greater than the table value and the Null hypothesis rejected. Hence, there is a close significant relationship between monthly income of the respondents and buying factors of the Mobile products.
SUMMARY OF FINDINGS, SUGGESTIONS & CONCLUSION
FINDINGS
1. It is revealed from the analysis that majority of the respondents are getting information about the Mobile products through advertisement.
2. It is obvious from the analysis that majority of the respondents are buying Mobile products through showroom.
3. It is noted from the analysis that majority of the respondents are opined that the sales of Mobile products was affected by the price factor.
4. It is identified from the analysis that majority of the respondents are opined that the Mobile products easily available in the market.
5. It is stated from the analysis that majority of the respondents are preferred television media is best media for advertise Mobile products.
6. It is noted from the analysis that majority of the respondents are highly satisfied with the salesman relationship.
7. There is a close significant relationship between gender of the respondents and buying factors of the Mobile products.
8. There is a close significant relationship between occupation and affect the sales factor of Mobile products.
9. There is a close significant relationship between monthly income of the respondents and buying factors of the Mobile products.
SUGGESTIONS
1. The company also take promotional measures of festival offer like exchange offer, discount etc.
2. The respondents feel that the picture after few years is not satisfactory. So the company should concentrate on this feature.
3. Through the study it was suggested that the company should concentrate on the capture of dealers and canvas them to increase their sales.
4. In order to cover the middle income group people, the company should consider the power consumption factor in their products.
CONCLUSION
Marketing plays an important role in the modern world. Therefore the development of marketing has always kept pace with economic growth of the country. Now, the consumer is the king of the market. Hence there is a need to fulfill the needs of the consumer by the marketer. Competition is to the order of the day. Businessmen have started realizing it. Earning profit is possible through consumer’s satisfaction. In order to create a satisfaction, the marketer should give more quality products with apt price. That’s why our modern marketing is a consumer oriented marketing. It begins with consumer and ends with consumer. The design of the study reveals about the consumers brand preference on Mobile products. Comparatively Mobile has a high brand preference among the consumer than other company products in respect of quality, price, technology and durability. Therefore the company which satisfies the consumer’s need in the competitive market has high preference on brand among the consumers.
BIBLIOGRAPHY
1. Rajan Nair, N. “Marketing”, Sultan Chand & Sons, New Delhi.
2. Philip Kotler, Gary Armstrong, “Principles of Marketing”, Prentice Hall of India, New Delhi, 1997.
3. Memoria, C.B., Joshi, R.L. “Principles and Practice of Marketing” in India, Kitab Mohal, 15, Thornhile Road, Allahabad.
4. Gupta, S.P. “Statistical Methods”, Sultan Chand & Sons Publishers, 1995.
5. Walter, C.G., Paul, G.W. “Consumers Behaviour”, an integrated frame work, Home wood III Richard, D. Irwill, 1970.
6. Sharma, D.D. “Marketing Research”, Sultan Chand and Sons, 1995.
7. Ramasamy V.S., Namakumari, N. “Marketing Management”, Macmillan and Publications, 1990.
8. Kothari, C.R. “Research Methods”, Wishwa Prakashan, Second Edition, 1998.
9. Pillai, R.S.N., & Bagavathi, “Statistics”, Sultan and Sons, 1998.
10. Thomas Exter, “Looking for Brand Loyalty”, American Demographics, April 1986.
11. S.P. Raj, “Strinking a Balance between Brand Popularity and Brand Loyalty”, Journal of Marketing Vol.49, Winter 1985.
REQUEST FOR FEEDBACK
Dear Readers
At the very outset, International Journal of Research in Commerce, IT and Management (IJRCM)
acknowledges & appreciates your efforts in showing interest in our present issue under your kind perusal.
I would like to request you to supply your critical comments and suggestions about the material published
in this issue as well as on the journal as a whole, on our E-mails i.e.
or
for further improvements in the interest of research.
If you have any queries please feel free to contact us on our E-mail
.
I am sure that your feedback and deliberations would make future issues better – a result of our joint
effort.
Looking forward an appropriate consideration.
With sincere regards
Thanking you profoundly
Academically yours
Sd/-