A Monthly Double-Blind Peer Reviewed (Refereed/Juried) Open Access International e-Journal - Included in the International Serial Directories
Indexed & Listed at:
VOLUME NO.5(2015),ISSUE NO.05(MAY) ISSN 2231-5756
INTERNATIONAL JOURNAL OF RESEARCH IN COMMERCE, IT & MANAGEMENT
CONTENTS
Sr.
No.
TITLE & NAME OF THE AUTHOR (S)
Page
No.
1
.
MARKETING STRATEGIES FOR THE VIETNAMESE GEOSYNTHETICS MARKET: A CASE STUDY OF
L.COMPANY PROSPECTS
KEMO BADIANE & CHARLES S. CHIEN
1
2
.
MILLENNIUM DEVELOPMENT GOALS IN AFRICA, POLICIES AND ACHIEVEMENT STRATEGIES: AN
APPRAISAL AND WAYS FORWARD
DR. CHUKS P. MADUABUM & DR. ONYEMAECHI J. ONWE
9
3
.
EMOTIONAL INTELLIGENCE AMONG COLLEGE TEACHERS: AN EMPIRICAL ANALYSIS
M. SURYA KUMAR
18
4
.
IMPACT OF ADVERTISEMENTS ON CONSUMPTION PATTERN OF SOFT DRINKS: A STUDY OF SELECT
RESPONDENTS
DR. S. V. RAMANA
21
5
.
BUYING BEHAVIOUR OF REFRIGERATOR BUYERS: A STUDY WITH SPECIAL REFERENCE TO CHITTOOR
DISTRICT IN ANDHRA PRADESH
G.NIRMALA & K.RAMAKRISHNAIAH
25
6
.
ANALYSIS OF ALCOHOL CONSUMPTION IN RAIPUR DISTRICT (CHHATTISGARH)
TANU ARORA & DR. G.D.S. BAGGA
29
7
.
A GAP ANALYSIS OF THE ACTUAL LEVEL OF PERFORMANCES AND THE STANDARD LEVEL OF
PERFORMANCES OF NEW GENERATION BANKS WITH SPECIAL REFERENCE TO HDFC BANK, AXIS BANK
AND INDUSIND BANK
DR. JEEMON JOSEPH
32
8
.
WHERE HAS ALL THE GOOD MARKETING GONE: ETHICS
DR. ANITA SUKHWAL
36
9
.
PARADIGM SHIFT IN CUSTOMER’S PREFERENCE REGARDING e-SHOPPING
TARANJIT SINGH VIJ & DR. AMRINDER SINGH
39
10
.
AN INTENSIVE RESEARCH ON CUSTOMER BEHAVIOUR IN HEALTH DRINKS MARKET IN TIRUPPUR CITY
THIYAGARAJ.V & DR. REVATHI MURALI
42
11
.
MONOGRAPH ON MATHEMATICAL MODELLING OF C-RAN
SARIKA SAINI
45
12
.
REGULATION AND DE-REGULATION OF COOPERATIVES IN CONTEXT OF LEGAL FRAMEWORK
DR. AMLANBRATA CHAKRABORTY
51
13
.
A STUDY ON ORGANIZED RETAILING AND ITS CHALLENGES
BEENA KUMARI
53
14
.
WORK LIFE BALANCE OF WOMEN IN UNORGANIZED SECTOR OF VAIKOM MUNICIPALITY
JITHIN JOY
56
15
.
IS CULTURAL SENSITIVITY REQUIRED BY POTENTIAL LEADERS: EMPIRICAL INVESTIGATION FOR SALES
FUNCTION IN IT SECTOR
ANJU CHAWLA
58
16
.
CAREER MOTIVATION OF HIGH SCHOOL TEACHERS
VIDHYA THAKKAR
63
17
.
BEHAVIOURAL FINANCE: ITS BUILDING BLOCKS
DEEPIKA C
66
18
.
ANALYSIS OF INVESTMENT OPTIONS
DR. RAMA NAIK.M
68
19
.
IMPACT OF CULTURAL DIFFERENCES ON INTERNATIONAL BUSINESS: A REVIEW OF LITERATURE
RICHA GOEL
78
20
.
PAYMENTS BANKS: A NEW LANDSCAPE FOR INDIAN BANKING SECTOR
ANUSHA GOEL
82
CHIEF PATRON
PROF. K. K. AGGARWAL
Chairman, Malaviya National Institute of Technology, Jaipur
(An institute of National Importance & fully funded by Ministry of Human Resource Development, Government of India)
Chancellor, K. R. Mangalam University, Gurgaon
Chancellor, Lingaya’s University, Faridabad
Founder Vice-Chancellor (1998-2008), Guru Gobind Singh Indraprastha University, Delhi
Ex. Pro Vice-Chancellor, Guru Jambheshwar University, Hisar
FOUNDER PATRON
LATE SH. RAM BHAJAN AGGARWAL
Former State Minister for Home & Tourism, Government of Haryana
Former Vice-President, Dadri Education Society, Charkhi Dadri
Former President, Chinar Syntex Ltd. (Textile Mills), Bhiwani
CO-ORDINATOR
AMITA
Faculty, Government M. S., Mohali
ADVISORS
PROF. M. S. SENAM RAJU
Director A. C. D., School of Management Studies, I.G.N.O.U., New Delhi
PROF. M. N. SHARMA
Chairman, M.B.A., Haryana College of Technology & Management, Kaithal
PROF. S. L. MAHANDRU
Principal (Retd.), Maharaja Agrasen College, Jagadhri
EDITOR
PROF. R. K. SHARMA
Professor, Bharti Vidyapeeth University Institute of Management & Research, New Delhi
CO-EDITOR
DR. BHAVET
Faculty, Shree Ram Institute of Business & Management, Urjani
EDITORIAL ADVISORY BOARD
DR. RAJESH MODI
Faculty, Yanbu Industrial College, Kingdom of Saudi Arabia
PROF. SANJIV MITTAL
University School of Management Studies, Guru Gobind Singh I. P. University, Delhi
PROF. ANIL K. SAINI
Chairperson (CRC), Guru Gobind Singh I. P. University, Delhi
DR. SAMBHAVNA
VOLUME NO.5(2015),ISSUE NO.05(MAY) ISSN 2231-5756
INTERNATIONAL JOURNAL OF RESEARCH IN COMMERCE, IT & MANAGEMENT
DR. MOHENDER KUMAR GUPTA
Associate Professor, P. J. L. N. Government College, Faridabad
DR. SHIVAKUMAR DEENE
Asst. Professor, Dept. of Commerce, School of Business Studies, Central University of Karnataka, Gulbarga
ASSOCIATE EDITORS
PROF. NAWAB ALI KHAN
Department of Commerce, Aligarh Muslim University, Aligarh, U.P.
PROF. ABHAY BANSAL
Head, Department of Information Technology, Amity School of Engineering & Technology, Amity
University, Noida
PROF. A. SURYANARAYANA
Department of Business Management, Osmania University, Hyderabad
DR. SAMBHAV GARG
Faculty, Shree Ram Institute of Business & Management, Urjani
PROF. V. SELVAM
SSL, VIT University, Vellore
DR. PARDEEP AHLAWAT
Associate Professor, Institute of Management Studies & Research, Maharshi Dayanand University, Rohtak
DR. S. TABASSUM SULTANA
Associate Professor, Department of Business Management, Matrusri Institute of P.G. Studies, Hyderabad
SURJEET SINGH
Asst. Professor, Department of Computer Science, G. M. N. (P.G.) College, Ambala Cantt.
TECHNICAL ADVISOR
AMITA
Faculty, Government M. S., Mohali
FINANCIAL ADVISORS
DICKIN GOYAL
Advocate & Tax Adviser, Panchkula
NEENA
Investment Consultant, Chambaghat, Solan, Himachal Pradesh
LEGAL ADVISORS
JITENDER S. CHAHAL
Advocate, Punjab & Haryana High Court, Chandigarh U.T.
CHANDER BHUSHAN SHARMA
Advocate & Consultant, District Courts, Yamunanagar at Jagadhri
SUPERINTENDENT
CALL FOR MANUSCRIPTS
We invite unpublished novel, original, empirical and high quality research work pertaining to recent developments & practices in the areas of Computer Science & Applications; Commerce; Business; Finance; Marketing; Human Resource Management; General Management; Banking; Economics; Tourism Administration & Management; Education; Law; Library & Information Science; Defence & Strategic Studies; Electronic Science; Corporate Governance; Industrial Relations; and emerging paradigms in allied subjects like Accounting; Accounting Information Systems; Accounting Theory & Practice; Auditing; Behavioral Accounting; Behavioral Economics; Corporate Finance; Cost Accounting; Econometrics; Economic Development; Economic History; Financial Institutions & Markets; Financial Services; Fiscal Policy; Government & Non Profit Accounting; Industrial Organization; International Economics & Trade; International Finance; Macro Economics; Micro Economics; Rural Economics; Co-operation; Demography: Development Planning; Development Studies; Applied Economics; Development Economics; Business Economics; Monetary Policy; Public Policy Economics; Real Estate; Regional Economics; Political Science; Continuing Education; Labour Welfare; Philosophy; Psychology; Sociology; Tax Accounting; Advertising & Promotion Management; Management Information Systems (MIS); Business Law; Public Responsibility & Ethics; Communication; Direct Marketing; E-Commerce; Global Business; Health Care Administration; Labour Relations & Human Resource Management; Marketing Research; Marketing Theory & Applications; Non-Profit Organizations; Office Administration/Management; Operations Research/Statistics; Organizational Behavior & Theory; Organizational Development; Production/Operations; International Relations; Human Rights & Duties; Public Administration; Population Studies; Purchasing/Materials Management; Retailing; Sales/Selling; Services; Small Business Entrepreneurship; Strategic Management Policy; Technology/Innovation; Tourism & Hospitality; Transportation Distribution; Algorithms; Artificial Intelligence; Compilers & Translation; Computer Aided Design (CAD); Computer Aided Manufacturing; Computer Graphics; Computer Organization & Architecture; Database Structures & Systems; Discrete Structures; Internet; Management Information Systems; Modeling & Simulation; Neural Systems/Neural Networks; Numerical Analysis/Scientific Computing; Object Oriented Programming; Operating Systems; Programming Languages; Robotics; Symbolic & Formal Logic; Web Design and emerging paradigms in allied subjects.
Anybody can submit the soft copy of unpublished novel; original; empirical and high quality research work/manuscriptanytime in M.S. Word format
after preparing the same as per our GUIDELINES FOR SUBMISSION; at our email address i.e. [email protected] or online by clicking the link online submission as given on our website (FOR ONLINE SUBMISSION, CLICK HERE).
GUIDELINES FOR SUBMISSION OF MANUSCRIPT
1. COVERING LETTER FOR SUBMISSION:
DATED: _____________
THE EDITOR
IJRCM
Subject: SUBMISSION OF MANUSCRIPT IN THE AREA OF .
(e.g. Finance/Marketing/HRM/General Management/Economics/Psychology/Law/Computer/IT/Education/Engineering/Mathematics/other, please specify)
DEAR SIR/MADAM
Please find my submission of manuscript entitled ‘___________________________________________’ for possible publication in your journals.
I hereby affirm that the contents of this manuscript are original. Furthermore, it has neither been published elsewhere in any language fully or partly, nor is it under review for publication elsewhere.
I affirm that all the authors have seen and agreed to the submitted version of the manuscript and their inclusion of names as co-authors.
Also, if my/our manuscript is accepted, I/We agree to comply with the formalities as given on the website of the journal & you are free to publish our contribution in any of your journals.
NAME OF CORRESPONDING AUTHOR :
Designation :
Institution/College/University with full address & Pin Code :
Residential address with Pin Code :
Mobile Number (s) with country ISD code :
WhatsApp or Viber is active on your above noted Mobile Number (Yes/No) :
Landline Number (s) with country ISD code :
E-mail Address :
Alternate E-mail Address :
Nationality :
NOTES:
a) The whole manuscript is required to be in ONE MS WORD FILE only (pdf. version is liable to be rejected without any consideration), which will start from the covering letter, inside the manuscript.
b) The sender is required to mention the following in the SUBJECT COLUMN of the mail:
New Manuscript for Review in the area of (Finance/Marketing/HRM/General Management/Economics/Psychology/Law/Computer/IT/ Engineering/Mathematics/other, please specify)
c) There is no need to give any text in the body of mail, except the cases where the author wishes to give any specific message w.r.t. to the manuscript. d) The total size of the file containing the manuscript is required to be below 500 KB.
e) Abstract alone will not be considered for review, and the author is required to submit the complete manuscript in the first instance.
f) The journal gives acknowledgement w.r.t. the receipt of every email and in case of non-receipt of acknowledgment from the journal, w.r.t. the submission of manuscript, within two days of submission, the corresponding author is required to demand for the same by sending separate mail to the journal.
g) The author (s) name or details should not appear anywhere on the body of the manuscript, except the covering letter and cover page of the manuscript, in the manner as mentioned in the guidelines.
2. MANUSCRIPT TITLE: The title of the paper should be in a 12 point Calibri Font. It should be bold typed, centered and fully capitalised.
3. AUTHOR NAME (S) & AFFILIATIONS: The author (s) full name, designation, affiliation (s), address, mobile/landline numbers, and email/alternate email address should be in italic & 11-point Calibri Font. It must be centered underneath the title.
VOLUME NO.5(2015),ISSUE NO.05(MAY) ISSN 2231-5756
INTERNATIONAL JOURNAL OF RESEARCH IN COMMERCE, IT & MANAGEMENT
5. ABSTRACT: Abstract should be in fully italicized text, not exceeding 250 words. The abstract must be informative and explain the background, aims, methods, results &conclusion in a single para. Abbreviations must be mentioned in full.
6. JEL CODE: Provide the appropriate Journal of Economic Literature Classification System code (s). JEL codes are available at www.aeaweb.org/econlit/jelCodes.php
7. KEYWORDS: JEL Code must be followed by a list of keywords, subject to the maximum of five. These should be arranged in alphabetic order separated by commas and full stops at the end.
8. MANUSCRIPT: Manuscript must be in BRITISH ENGLISH prepared on a standard A4 size PORTRAIT SETTING PAPER. It must be prepared on a single space and single column with 1” margin set for top, bottom, left and right. It should be typed in 8 point Calibri Font with page numbers at the bottom and centre of every page. It should be free from grammatical, spelling and punctuation errors and must be thoroughly edited.
9. HEADINGS: All the headings should be in a 10 point Calibri Font. These must be bold-faced, aligned left and fully capitalised. Leave a blank line before each heading.
10. SUB-HEADINGS: All the sub-headings should be in a 8 point Calibri Font. These must be bold-faced, aligned left and fully capitalised.
11. MAIN TEXT: The main text should follow the following sequence:
INTRODUCTION REVIEW OF LITERATURE NEED/IMPORTANCE OF THE STUDY STATEMENT OF THE PROBLEM OBJECTIVES
HYPOTHESES
RESEARCH METHODOLOGY RESULTS & DISCUSSION FINDINGS
RECOMMENDATIONS/SUGGESTIONS CONCLUSIONS
LIMITATIONS
SCOPE FOR FURTHER RESEARCH REFERENCES
APPENDIX/ANNEXURE
It should be in a 8 point Calibri Font, single spaced and justified. The manuscript should preferably not exceed 5000 WORDS.
12. FIGURES & TABLES: These should be simple, crystal clear, centered, separately numbered & self explained, and titles must be above the table/figure. Sources of data should be mentioned below the table/figure. It should be ensured that the tables/figures are referred to from the main text.
13. EQUATIONS/FORMULAE: These should be consecutively numbered in parentheses, horizontally centered with equation/formulae number placed at the right. The equation editor provided with standard versions of Microsoft Word should be utilized. If any other equation editor is utilized, author must confirm that these equations may be viewed and edited in versions of Microsoft Office that do not have the editor.
14. ACRONYMS: These should not be used in the abstract. The use of acronyms is elsewhere is acceptable. Acronyms should be defined on first use in each section: Reserve Bank of India (RBI). Acronyms should be redefined on first use in subsequent sections.
15. REFERENCES: The list of all references should be alphabetically arranged. The author (s) should mention only the actually utilised references in the preparation of manuscript and they are supposed to follow Harvard Style of Referencing. Also check to make sure that everything that you are including in the reference section is cited in the paper. The author (s) are supposed to follow the references as per the following:
•
All works cited in the text (including sources for tables and figures) should be listed alphabetically.•
Use (ed.) for one editor, and (ed.s) for multiple editors.•
When listing two or more works by one author, use --- (20xx), such as after Kohl (1997), use --- (2001), etc, in chronologically ascending order.•
Indicate (opening and closing) page numbers for articles in journals and for chapters in books.•
The title of books and journals should be in italics. Double quotation marks are used for titles of journal articles, book chapters, dissertations, reports, working papers, unpublished material, etc.•
For titles in a language other than English, provide an English translation in parentheses.•
Headers, footers, endnotes and footnotes may not be used in the document, but in short succinct notes making a specific point, may be placed in number orders followingthe references.
PLEASE USE THE FOLLOWING FOR STYLE AND PUNCTUATION IN REFERENCES: BOOKS
•
Bowersox, Donald J., Closs, David J., (1996), "Logistical Management." Tata McGraw, Hill, New Delhi.•
Hunker, H.L. and A.J. Wright (1963), "Factors of Industrial Location in Ohio" Ohio State University, Nigeria.CONTRIBUTIONS TO BOOKS
•
Sharma T., Kwatra, G. (2008) Effectiveness of Social Advertising: A Study of Selected Campaigns, Corporate Social Responsibility, Edited by David Crowther & Nicholas Capaldi, Ashgate Research Companion to Corporate Social Responsibility, Chapter 15, pp 287-303.JOURNAL AND OTHER ARTICLES
•
Schemenner, R.W., Huber, J.C. and Cook, R.L. (1987), "Geographic Differences and the Location of New Manufacturing Facilities," Journal of Urban Economics, Vol. 21, No. 1, pp. 83-104.CONFERENCE PAPERS
•
Garg, Sambhav (2011): "Business Ethics" Paper presented at the Annual International Conference for the All India Management Association, New Delhi, India, 19–23UNPUBLISHED DISSERTATIONS
•
Kumar S. (2011): "Customer Value: A Comparative Study of Rural and Urban Customers," Thesis, Kurukshetra University, Kurukshetra.ONLINE RESOURCES
•
Always indicate the date that the source was accessed, as online resources are frequently updated or removed.WEBSITES
IMPACT OF ADVERTISEMENTS ON CONSUMPTION PATTERN OF SOFT DRINKS: A STUDY OF SELECT
RESPONDENTS
DR. S. V. RAMANA
PROFESSOR
DEPARTMENT OF MBA
VBIT
AUSHAPUR
ABSTRACT
Soft drinks industry, one of the leading beverage sectors is estimated to grow at 5% p.a, touching approximately 600 billion liters creating great opportunity to Indian market. India, having 1000 million potential customers since Indian middle class is growing rapidly in its strength, is displaying great potentiality in soft drinks turnover. Consumers are cautious about healthy beverages though there is hike in their income power and including soft drinks in their daily shopping menu. This study is about analyzing the consumption patterns of the soft drinks of select respondents and the impact of advertisements on the buying behavior of the consumers. The sample size of 410 was studied and analyzed in the areas of age wise behavioral pattern of the consumers with regard to different parameters and male – female comparison and as well correlation between educational professions. The findings of the study explored that there is a relationship between age and consumption pattern as well gender differences and education qualification differences exist.
KEYWORDS
Soft Drinks, Advertisements, Consumption pattern, Statistical tools.
INTRODUCTION
cross the globe, India is considered as the youngest nation as it has a majority of population of 120 crores falling in the age group of less than 35 years. They are mostly educated, tech savvy and having access to latest communication handsets with internet facility as well. No doubt they are constantly exposing to various advertisements of FMCG products, electronic goods, soft drinks etc., it is pertinent to note that no more soft drinks are summer special rather demanded irrespective of season. Be it children, teens, youth, middle aged and even old aged made soft drinks as part and parcel in their lives using in any situations like daily drinks, party, office, guest drinks etc., escalating the demand to the soft drinks time by time. The soft drinks can be called colas (Pepsi, Coke, Thumsup) or non- colas (Gold Spot, Fanta, Mirinda, Limca) and carbonated (Cola, Lemon, Orange) or
non- carbonated drinks (Mango Juices). Unlike earlier, soft drinks are not limited to urban only rather reached the rural market aggressively with 200ml and 300 ml pet bottles.
As per NIIR report (NPCC, 2012), Indian soft drink industry accounts for more than 50bn, growing at the rate of 7% per annum providing employment to around 1.25 lakh Indian youth. Its share is distributed among cola (62%) and non cola (38%). The report also claims that India is consuming 5-6 bottles per person per annum though lesser than America whose consumption is 800 bottles, 2bn worth exports and contributes Rs 12bn to the Indian exchequer. As per Business Maps India report (BMIR, 2011) Carbonated drinks contribute around 80% to the soft drink industry while non- carbonated around 20%. The report explores that 80% of the consumption is done at outdoor while only 20% of the consumption is taking place at homes. Advertisements are the influencers in this modern electronic era. These youngsters are constantly exposed to these advertisements. Youth in India are capturing high profiled work positions and have become effective earners that have led to increase in India’s spending calibre as well. All the advertisers aim to reach these youth. Soft drink brands are no exception to it. Advertisements of Pepsi, Coke, Thumsup, Sprite etc., are relentless in reaching these audiences through all available media including print, electronic and online media vehicles. Some are romantic advertisements like 7up, adventurous advertisements like Thumsup and Mountain Dew, seductive advertisements like Deo, energetic like Pepsi, yummy advertisements like Maaza.
Whatever is the mode of presentation of advertisements; their objective is to reach these audiences. This study explores the consumption patterns of the customers and influencing factors of different advertisements and their related parameters like favorite brands, reasons for favorite brands, remembering advertisements, reasons for remembrance the ads for long period, people preferred in the advertisements of their favorite brand advertisements and type of advertisements they prefer. The data thus collected is analyzed.
OBJECTIVES OF THE STUDY
1. To understand the consumption pattern of the soft drinks by select respondents. 2. To analyse the relation of age, gender and education with different parameters. 3. To compare male and female with respect to their preferences of their favourite brands.
METHODOLOGY
Sample Size:the sample size of this study is 407, taken on the basis of the statistical sampling method using stratified sampling technique.
Sampling Techniques:Stratified sampling technique is used. The size of the stratum is calculated proportionately to the size of the size stratum population.
Questionnaire: Structured questionnaire is used to collect the data from the respondents.
Data Collection:Primary data has been collected directly from the respondents carrying the questionnaire through researcher or researcher associates. Secondary data has been collected from different printed journals as well online journals, historical data from reports, research reports and business magazines
Tools Used:Basic descriptive statistical tools like mean, variance and standard deviation is used to find the age factor related to specified parameters and student –t test is used to compare the gender relations and correlation is used to find the relation between different educational qualifications related to parameters.
REVIEW OF LITERATURE
The term ‘Soft Drinks’ was originated as an opposite word to ‘Hard Drinks’ and it is existing from 17th Century (Branske, 2011). Though the non carbonated drinks exists from 17th Century, earlier there exists lemon juice with honey which led to De Limonadiers of Paris in 1676 who carry lemons and disposable glasses on their backs and sells.
Dr. Joseph Priestley made carbonated water in 1767 which was later added with Sulfuric Acid to it by Torbern Bergman. In 1810, the drink was patented to Simons and Rundell (Dr. Govind Shinde et al, 2013). It is found in a research that the soft drink consumers will also look for quality and as well value for the money which they pay. He also clarifies that the respondents will not detract any person from their favorite Brand Ambassador (D. GOUTAM, 2013). According to EUROMONITOR INTERNATIONAL, Soft drinks are growing in double digits especially in long summers and even though there is a tight competition between Pepsi and coke, the retailers are prioritizing equally which is creating the greater scope for the marketing of the soft drinks (EUROMONITOR INTERNATIONAL, 2013).
VOLUME NO.5(2015),ISSUE NO.05(MAY) ISSN 2231-5756
INTERNATIONAL JOURNAL OF RESEARCH IN COMMERCE, IT & MANAGEMENT
A researcher has identified that male students, male and female unmarried employees and female married employees will search for products online even in their offices in their leisure time and it is found that they click on food products including health and soft drinks (R. B.Kakumanu, 2013). Another researcher has explored in his study that 42% of the consumers prefer soft drinks than fruit juices though the weekly consumption is also lower than fruit juices, the consumers preferred soft drinks in parties and celebrations and taste and price is major factors to choose soft drinks and the study has found that 61% of the consumers are being attracted by advertisements (Dr. Simranjeet Kaur Sandhar et al, 2013). A study finds that 20% of advertisements which are aired in television belong to soft drinks especially in New Zealand and most of the advertisements aired by major players like Coco Cola and Pepsi (Jennifer Utter, 2005).
A study also confirmed that school children were trapped into soft drinks caused obesity and found that the usage of soft drinks by children were increased by 500% in last 50 years. Soda is mostly used by children. The study also concludes that the consumption of soft drinks is exceeding that of Milk especially in America. This has caused in increasing the size of the bottle as it is 6 ½ of inch in 1950s reached unto 12 inches at present (Joshua Berning. 2010). It is observed in a study that the children from 6-11 age groups has fascinated towards soft driks advertisements (Powell et al, 2010) and they use soft drinks largely in home, school and restaurants and hence this has caused majorly obesity in children (Collison et al, 2010).
It is found in a study that the consumption of soft drinks may lead to obesity hence the hike in tax levied may curtail the number of soft drink consumers so as the patients of obesity and diabetes (Rupali Mukherjee, 2014). Another study also proves that soft drinks leads to adverse health effects since soft drinks contains sugar since in a 32-ouce soda will contain approximately 26 tea spoons of sugar (Janet Renee, 2013).
ANALYSIS AND DISCUSSIONS
TABLE 1: DEMOGRAPHIC CHARACTERISTICS OF SAMPLES Frequency Percent Gender Male 187 46
Female 220 54
Age 7-12 33 8
12-20 44 11 20-35 165 41 35-50 121 30 >50 44 11 Education School 66 16 College 33 8
UG 99 24
PG 154 38
PG+ 55 14
It can be observed from the table No. 1 that the samples consists of 46% of male and 54% female which includes 19% of samples are drawn from less than 20 years age and 41% from 20-35 years and 41% from more than 35 years age. 16% of the samples are fallen in the school category while 8% in College, 24% in UG, 38% PG and 14% from PG+ categories. It explores that majority of samples are drawn from 20-35 years and PG qualified respondents. Female respondents are more than male.
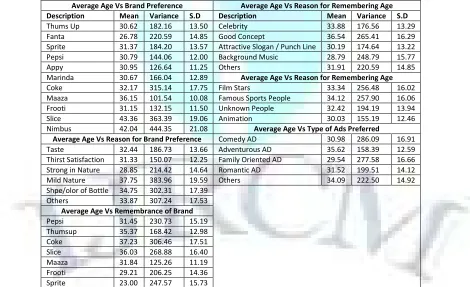
TABLE 2: AGE WISE RESPONSES TOWARDS DIFFERENT PARAMETERS
Average Age Vs Brand Preference Average Age Vs Reason for Remembering Age Description Mean Variance S.D Description Mean Variance S.D
Thums Up 30.62 182.16 13.50 Celebrity 33.88 176.56 13.29 Fanta 26.78 220.59 14.85 Good Concept 36.54 265.41 16.29 Sprite 31.37 184.20 13.57 Attractive Slogan / Punch Line 30.19 174.64 13.22 Pepsi 30.79 144.06 12.00 Background Music 28.79 248.79 15.77 Appy 30.95 126.64 11.25 Others 31.91 220.59 14.85 Marinda 30.67 166.04 12.89 Average Age Vs Reason for Remembering Age
Coke 32.17 315.14 17.75 Film Stars 33.34 256.48 16.02 Maaza 36.15 101.54 10.08 Famous Sports People 34.12 257.90 16.06 Frooti 31.15 132.15 11.50 Unknown People 32.42 194.19 13.94 Slice 43.36 363.39 19.06 Animation 30.03 155.19 12.46 Nimbus 42.04 444.35 21.08 Average Age Vs Type of Ads Preferred
Average Age Vs Reason for Brand Preference Comedy AD 30.98 286.09 16.91 Taste 32.44 186.73 13.66 Adventurous AD 35.62 158.39 12.59 Thirst Satisfaction 31.33 150.07 12.25 Family Oriented AD 29.54 277.58 16.66 Strong in Nature 28.85 214.42 14.64 Romantic AD 31.52 199.51 14.12 Mild Nature 37.75 383.96 19.59 Others 34.09 222.50 14.92 Shpe/olor of Bottle 34.75 302.31 17.39
Others 33.87 307.24 17.53
Average Age Vs Remembrance of Brand
Pepsi 31.45 230.73 15.19 Thumsup 35.37 168.42 12.98 Coke 37.23 306.46 17.51 Slice 36.03 268.88 16.40 Maaza 31.84 125.26 11.19 Frooti 29.21 206.25 14.36 Sprite 23.00 247.57 15.73
Table No. 2 describes the age wise responses towards different parameters. It is found that Thumsup, Pepsi, Appy and Miranda brands are favored by around 30 years (means=30.62,30.79,30.95 and 30.67) with deviation of 11-13 years while Sprite and Frooti are favored by around 31 years with deviation of 12-14 years. It is found that Fanta is favored by younger respondents with just mean age 27 years with the deviation of 15 years. Coke is favored by 32 years age with deviation of 17 years. Maaza, Slice and Nimbus brands are favored by elder people with 35-43 years with deviation of 20 years. It is analyzed that means after considered deviations projects that all the brands are preferred with almost similar age groups. It is observed that younger generation wants cool drinks to be strong in nature (28.85) while people in early 30s prefer the drinks to be thurst satisfactory (31.33) and tasty (32.44).
preferred good concept in the advertisement. Young people preferred animated advertisements while early 30s preferred unknown customers while others similar age group preferred film stars but elder people wants famous sports people in their advertisements. Young people want family oriented, comedy and romantic ads while elder respondents prefer adventurous ads and other advertisements.
TABLE 3: GENDER WISE COMPARISON REGARDING THEIR RESPONSES TOWARDS VARIOUS PARAMETERS Particulars Mean Variance t-value p-value
Male Female Male Female
Favorite Brand 17 20 210.2 68.4 2.12 0.56 Reason for Preference 31.16 36.66 613.66 2018.66 2.31 0.8 Mostly remembered Ad 26.71 31.42 965.57 142.95 2.3 0.72 Reason for remembrance 37.4 44 658.8 153.5 2.54 0.62 Preferred People in Ads 46.75 55 702.91 360 2.57 0.63 Type of Ads Preferred 37.4 44 524.3 174.5 2.45 0.57
Table No. 3 describes gender wise comparison with respect to their responses towards different parameters. It is observed that there is a clear difference between the preferences of male and female (t-2.12 p-0.56) with respect to their favorite brand. It is also found that the reasons for preferring a favorite brand are clearly differentiated between male and female (t-2.31 p-0.8). we can see the similar result in case of remembering the ad that there is a difference between male and female regarding ad remembrance (t-2.3, p-0.72). It is observed that reasons for remembering are different in case of male and female (t-2.54, p-0.62). The choices of people preferred in their favorite brand advertisements are also result the similar way that there is a difference between male and female respondents in this regard (t-2.57 p-0.63). Type of ads preferred differently by male and female. (T-2.54, p-0.57)
TABLE 4: EDUCATION VS RESPONSES TOWARDS DIFFERENT PARAMETERS – A CORRELATION ANALYSIS Favorite Brands Reason for Remembrance
School College UG PG PG+ School College UG PG PG+
School 1.00 School 1.00
College 0.28 1.00 College 0.52 1.00
UG 0.22 0.31 1.00 UG 0.15 0.56 1.00
PG 0.42 0.17 0.08 1.00 PG 0.22 0.51 0.22 1.00
PG + 0.25 0.12 0.50 0.29 1.00 PG + 0.10 0.31 0.08 0.00 1.00
Reasons for Favourite Brand Preferred People
School College UG PG PG+ School College UG PG PG+
School 1.00 School 1.00
College 0.80 1.00 College 0.79 1.00
UG 0.95 0.63 1.00 UG 0.11 0.41 1.00
PG 0.95 0.62 0.98 1.00 PG 0.33 0.83 0.66 1.00
PG + 0.97 0.67 1.00 0.97 1.00 PG + 0.01 0.22 0.98 0.49 1.00
Remembrance of Ads Type of Ad preferred
School College UG PG PG+ School College UG PG PG+
School 1.00 School 1.00
College 0.74 1.00 College 0.36 1.00
UG 0.38 0.11 1.00 UG 0.70 0.64 1.00
PG 0.62 0.44 0.85 1.00 PG 0.27 0.19 0.28 1.00
PG + 0.60 0.34 0.29 0.12 1.00 PG + 0.85 0.49 0.41 0.15 1.00
Table No. 4 observes that in case of preferring a brand, there is very less correlation between college level qualified respondents including UG,PG+ and school level literates (0.28) while there is average correlation between PG level and School level. There is a significant correlation between UG and college level, PG+ and PG respondents. In case of reasons for favorite choosing brand there is high level correlation between college to school, UG to school, PG to School, PG+ to school, UG to college, PG to college, PG + to college. There is high level correlation between PG to UG and PG+ to UG with respect to reasons for choosing their favorite brand.
With respect to remembrance of advertisements, there is high correlation between college to school, PG to UG while PG and PG+ to school level qualified respondents are moderate correlation. Rest of the combinations is found less correlated. But in case of reasons for remembering the ads, except college to school, UG to college and PG College which are average correlated, other combinations found less correlated. In case of preferred people in the advertisements of their favorite brands, PG to school, PG+ to college are not strongly correlated but in other combinations are moderately correlated in case of people preferred in their favorite brand ads. In case type of ads preferred by the respondents, UG to school, PG+ to school, UG to college are correlated and rest of the comparisons found less correlated.
FINDINGS
1. Thumsup, Pepsi, Appy and Miranda brands are favored by average of 30 years age group with deviation of 11-13 years. 2. Sprite and Frooti are favored by around 31 years with deviation of 12-14 years.
3. Fanta is favored by younger respondents with mean age 27 years with deviation of 15 years. 4. Coke is favored by 32 years age group with deviation of 17 years.
5. Maaza, Slice and Nimbus brands are favored by elder people with 35-43 years with deviation of 20 years. 6. Younger generation wants cool drinks to be strong in nature
7. Early 30s prefer the drinks to be thurst satisfactory and tasty.
8. People in near 35+ looks for other reasons including the color and shape of the bottle. 9. Elder people (37.75) preferred mild natured cool drinks.
10. Young people (23) remembered Sprite advertisements 11. Pepsi, Maaza and Frooti ads are remembered by nearly 30s 12. Thumsup, coke and slice ads are mostly remembered by elder people 13. Youngsters prefer background music
14. People in 30s prefer attractive slogan and punch line and other reasons. 15. Early elder people looks for celebrities in their favorite ads
VOLUME NO.5(2015),ISSUE NO.05(MAY) ISSN 2231-5756
INTERNATIONAL JOURNAL OF RESEARCH IN COMMERCE, IT & MANAGEMENT
19. Elder people wants famous sports people in their advertisements 20. Young people wants family oriented, comedy and romantic ads 21. Elder respondents prefer adventurous ads and other advertisements 22. There is a clear difference between the preferences of male and female 23. There is correlation among educational courses.
CONCLUSION
Soft drinks advertisers need to be cautious in case of Soft Drinks advertisements because the consumers are no more compromised users rather complex in choosing the brand. The contemporary Soft drink Advertisers are depending on exposure of the celebrities rather than conceptual advertisements. Emotional advertisements are aired rather than rational advertisements to explain how the product serves the customer. The consumers prefer simple and natural advertisements. In some cases, the family members are unable to watch together since these female exposed advertisements are aired in common times. Soft Drinks are mostly favored by middle aged group on an average while Fanta is attracted to young generation and Maaza, Slice and Nimbus brands are favored by elder people. Younger generation liked strong natured drinks while elders thirst satisfactory and tasty and older people mild natured cool drinks. Sprite is successful in attracting youth and Thumsup attracted all adults. Youngsters prefer background music and elder adults prefer attractive slogan and punch line old aged good concept in the advertisement. Animations are liked to Youth and also family oriented advertisements too.
REFERENCES
1. Branske, E. (2011), The origin of soft drinks, retrieved from on 15.05.2014 from http://www.helium.com/items/2136960- accessed 24/11/2012
2. Business Maps of India, 2011, “Top Soft Drink Brands in India”, retrieved from http://business.mapsofindia.com/top-brands-india/top-soft-drink-brands-in-india.html on 20.04.2014
3. Collison, K.S., Zaidi, M.Z., Subhani, S.N., et al., 2010. “Sugar-sweetened carbonated beverage consumption correlates with BMI, waist cir-cumference, and poor dietary choices in school children. BMC Public Health 10, 234
4. D. Gowtham, 2013, “Influence of Brand Ambassador on Buying Behavior of Soft Drinks”, IMPACT: International Journal of Research in Business Management (IMPACT: IJRBM), Vol. 1, Issue 4, page 9-18
5. Dr. Govind Shinde, Dr. Kumardatt Ganjre, 2013, Brand building strategies for Soft Drinks” ABHINAV, VOLUME NO.1, ISSUE NO. 3, Page 66
6. Dr. Simranjeet Kaur Sandhar, Dheeraj Nim, Shikha Agrawal, 2013, “Consumption Pattern of Soft Drinks and Fruit Juices: A Comparative Study”, SVIM e-Journal of Applied Management, Volume I, Issue I, Page 47
7. EUROMONITOR INTERNATIONAL, 2013, “Softdrinks In India” retrieved on 24,04.2014 from http://www.euromonitor.com/soft-drinks-in-india/report 8. Janet Renee, 2013, “What Are the Negative Effects of Soft Drinks?”, retrieved on 12.04.2014 from
http://www.livestrong.com/article/320544-what-are-the-negative-effects-of-soft-drinks/
9. Jennifer Utter, Robert Scragg and David Schaaf, 2005, “Associations between television viewing and consumption of commonly advertised foods among New Zealand children and young adolescents”, Public Health Nutrition: Volume 9 Issue 5, Page 608
10. Joshua Berning, 2010, “VOLUNTARY RESTRICTIONS ON TELEVISION ADVERTISING FOR CARBONATED SOFT DRINKS: THE IMPACT ON CONSUMER DEMAND”, Joint EAAE/AAEA Seminar, “The Economics of Food, Food Choice and Health” Freising, Germany.
11. NPCC, 2012, “Information, Soft Drinks Industry in India”, retrieved from http://www.niir.org/information/content.phtml?content=184 on 20.04.2014. 12. Powell, L.M., Szczypka, G., Chaloupka, F.J., 2010, “Trends in exposure to television food advertisements among children and adolescents in the United
States”, Arch. Pediatr. Adolesc. Med. 164, 794–802.
13. Ramesh Babu Kakumanu, 2013, “Impact of Online Advertisements on Students and Professional Employees: A Research on Consumer Behavior”, International Journal on Customer Relations, Volume 1, Issue 2, Page 27
14. Rupali Mukherjee, 2014, “Tax Beverages in India to curb rising obesity and diabetes, study suggests”, retrived on 25.05.2014 from http://timesofindia. indiatimes.com/city/mumbai/Tax-beverages-in-India-to-curb-rising-obesity-and-diabetes-study-suggests/articleshow/28525482.cms
REQUEST FOR FEEDBACK
Dear Readers
At the very outset, International Journal of Research in Commerce, IT & Management (IJRCM)
acknowledges & appreciates your efforts in showing interest in our present issue under your kind perusal.
I would like to request you tosupply your critical comments and suggestions about the material published
in this issue as well as on the journal as a whole, on our E-mail
for further
improvements in the interest of research.
If youhave any queries please feel free to contact us on our E-mail
.
I am sure that your feedback and deliberations would make future issues better – a result of our joint
effort.
Looking forward an appropriate consideration.
With sincere regards
Thanking you profoundly
Academically yours
Sd/-
Co-ordinator
DISCLAIMER
VOLUME NO.5(2015),ISSUE NO.05(MAY) ISSN 2231-5756