R E S E A R C H
Open Access
Identifying driver genes involving gene
dysregulated expression, tissue-specific
expression and gene-gene network
Junrong Song
1, Wei Peng
1*, Feng Wang
1and Jianxin Wang
2From14th International Symposium on Bioinformatics Research and Applications (ISBRA'18) Beijing, China. 8-11 June 2018
Abstract
Background:Cancer as a kind of genomic alteration disease each year deprives many people’s life. The biggest
challenge to overcome cancer is to identify driver genes that promote the cancer development from a huge amount of passenger mutations that have no effect on the selective growth advantage of cancer. In order to solve those problems, some researchers have started to focus on identification of driver genes by integrating networks with other biological information. However, more efforts should be needed to improve the prediction performance.
Methods:Considering the facts that driver genes have impact on expression of their downstream genes, they likely
interact with each other to form functional modules and those modules should tend to be expressed similarly in the same tissue. We proposed a novel model named by DyTidriver to identify driver genes through involving the gene dysregulated expression, tissue-specific expression and variation frequency into the human functional interaction network (e.g. human FIN).
Results:This method was applied on 974 breast, 316 prostate and 230 lung cancer patients. The consequence
shows our method outperformed other five existing methods in terms of Fscore, Precision and Recall values. The enrichment and cociter analysis illustrate DyTidriver can not only identifies the driver genes enriched in some significant pathways but also has the capability to figure out some unknown driver genes.
Conclusion:The final results imply that driver genes are those that impact more dysregulated genes and express
similarly in the same tissue.
Keywords:Driver genes, Dysregulated expression, Tissue-specific expression, Human functional interaction network,
Variation frequency
Background
Cancer as a kind of genomic alteration disease each year
deprives many people’s life [1–3]. It is acknowledged
that cancer arise is due to the accumulation of muta-tions in a subgroup of genes which conferring growth
advantage, allowing uncontrolled proliferation and
avoiding apoptosis [4,5]. With the development of
next-generation sequencing technology, several large-scale cancer projects have generated a large amount of cancer genomic data, such as The Cancer Genome Atlas (TCGA) [6], International Cancer Genome Consortium (ICGC) [7], which enable the detection of thousands of mutations. However, not all mutations contribute to the cancer initiation and progression. The mutations that are important to the cancer development and provide selective growth advantage are called driver mutations,
the opposite is termed as the passenger mutations [8,9].
Some researches show that the number of passenger mutations far beyond the number of driver mutations
© The Author(s). 2019Open AccessThis article is distributed under the terms of the Creative Commons Attribution 4.0 International License (http://creativecommons.org/licenses/by/4.0/), which permits unrestricted use, distribution, and reproduction in any medium, provided you give appropriate credit to the original author(s) and the source, provide a link to the Creative Commons license, and indicate if changes were made. The Creative Commons Public Domain Dedication waiver (http://creativecommons.org/publicdomain/zero/1.0/) applies to the data made available in this article, unless otherwise stated.
* Correspondence:[email protected] 1
Faculty of Management and Economics/Faculty of Information Engineering and Automation/Technology Application Key Lab of Yunnan Province, Kunming University of Science and Technology, Kunming, Yunnan 650500, People’s Republic of China
[9]. For example, from 11 cancer types, there are only 2 to 6 mutations have been regarded as the driver muta-tions among 200 somatic mutamuta-tions which including missense, nonsense, silent, coding, splice-site, non-stop mutations, frameshift insertions and deletions (indels) and inframe indels [9–12]. Besides, those im-portant alterations are not uniformly distributed across the genome and target to some specific genes associated with important cellular functions such as cell survival,
cell fate etc. [4, 13–15]. For example, the well-known
tumor suppressor TP53 participate in defense mecha-nisms against cancer and their inactivation by alteration can increase the selective growth advantage of the cell [16]. The alterations of ERBB2 [17] and KRAS [18] can lead to the acquisition of new properties that provide some selective growth advantage or spread to remote or-gans. Hence, the biggest challenge to overcome cancer is how to precisely discriminate those driver genes which harboring driver mutations and have the capability to promote cancer development from those irrelevant pas-senger genes [11]. This act is essential to understand the
tumor biology and designing precision therapies [4,19].
Traditional methods to identify cancer driver genes are based on the assumption that driver mutations con-fer a selective advantage to tumor growth and they occur more frequently than expected by random chance [20]. This kind of methods such as Mutsig [21] and MuSic [22] successfully pinpoints part of recurrence genes. However, in fact, only a small number of genes are al-tered in a high percentage of patient. Much larger num-ber of genes are altered infrequently [11]. Besides, due to the heterogeneity of cancer, it is so hard to properly esti-mate the background mutation rate that many errors may be introduced [23].
A promising angle to identify cancer driver genes is based on network since it is acknowledged that cancer genes are more closely related with each other within a group to perform a certain function [24]. HotNet [25] and HotNet2 [26] apply a propagation process that dif-fuse the score of mutation frequency through the whole gene-gene interaction network and extract significantly mutated subnetworks to identify driver genes. NBS [27] detects driver genes by taking the strategies similar to HotNet. However, NBS detects mutated subnetworks of each patient and uses a consensus clustering framework to merge subnetworks across all patients. Unlike previ-ous methods that use global network information, MUF-FINN [28] prioritizes the cancer driver genes by measuring the impact from all neighbors of mutated genes in the functional network. Although these network-based methods mentioned above proposed a new focus on the interacting relationship of cancer driver genes, most of them identified cancer driver genes only consider the patient-gene mutation profiles and
topology of networks. Besides, they are too much rely on the known network which may create some false positive data [23].
To overcome these limitations, some researchers focus on combining the cancer gene’s functional interactive re-lationship and other biological properties to improve the precision of detecting cancer driver genes. For example, DriverNet [29] identifies cancer driver genes by estimat-ing their effect on mRNA expression. Inspired by the ra-tionale that cancer driver genes may be determined by their impact on expressions of downstream genes, Dri-verNet firstly identifies the downstream genes (called outlying genes) with significantly differential expressions and then constructs a bi-graph where one side is mu-tated genes and the other side is outlying genes. It se-lects the driver genes that connect to the most nodes in the outlying gene side. Shi et al. [30] further improve DriverNet method by introducing diffusion process on the bi-graph. DawnRank [31] ranks potential cancer driver genes based on both their own expression differ-ence and their impact on the overall differential expres-sion of the downstream genes in the molecular interaction network. LNDriver [24] is also designed on the basis of bi-graph, while it incorporates the DNA length to filter mutated gene at the first step.
Above mentioned bi-graph-based methods to some degree improve the accuracy of identifying cancer driver genes by adding biology profiles to the gene itself. How-ever, the reliability of network still needs to do further improvement since most of known networks are built based on either or mix of large scale of computational and experimental data. This may directly impact the effi-ciency and precision of detecting novel driver genes [23]. Hence, the fundamental problem is to establish one model that can improve the reliability of network so as to improve the power of prediction. To achieve this, some researchers consider to incorporate specific bio-logical profiles to assign a weight for each interaction such as the impact of differential expression information [32]. However, seldom of them considered the facts that the majority of cancer genes interact with each other to form functional modules and those modules should tend to be expressed similarly in the same tissue. Ganegoda et.al [33] use the tissue-specific data to predict the new disease-gene associations by measuring the gene expres-sion in disease related tissues and achieved higher per-formance. Besides, previous studies found genetic disorders tend to manifest only in a single or a few tis-sues for a given disease [34]. Motivated by these, we want to refine the gene functional interaction network by considering expression similarity between each pair
of mutated genes in the cancer’s related one or two
mutated across a cohort of patients and also dysregulate
downstream genes’expression.
Based on the facts mentioned above, we proposed a model called DyTidriver to predict cancer driver genes by integrating dysregulated expression profiles, tissue-specific expression profiles, modularity of mutated genes and variation frequency into the gene functional inter-action network. In DyTidriver, considering the fact that cancer driver genes are likely dysregulate downstream
genes’expression, mutated genes were firstly filtered
ac-cording to their impact on the expression of
down-stream genes. After that, mutated genes’ interactive
network was weighted by considering gene-gene co-expression in specific tissues of each query disease and the relationship between mutated genes. Because the majority of cancer driver genes interact with each other to form functional modules and those modules tend to be expressed similarly in the same tissue. Finally, with respect to the facts that driver genes are more likely to be frequently mutated across a cohort of patients and
interact with each other to form functional modules, the mutated genes were ranked by summing up the weighted graph and multiplying itself variation fre-quency. We explored our method to detect cancer driver genes of lung cancer, breast cancer and prostate cancer. The result shows that our method significantly outper-forms other five existing methods [28–31] in terms of Fscore, Precision and Recall. Besides, the cociter analysis illustrates our method can not only identify some well-known cancer driver genes but also detects the unwell-known cancer driver genes with high co-occurrence ratio in some publications. Furthermore, the identified cancer driver genes also enrich in some significant pathways and biological functions.
Methods
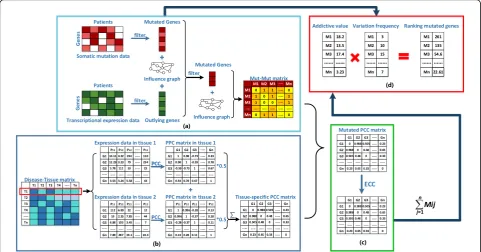
Our method consists of four steps (see Fig. 1). At first,
we filtered the mutated genes for each patient according to whether or not it influenced the expression of down-stream genes. Only the mutated genes that dysregualte
Fig. 1The workflow of Dytidriver. We divided our whole process of cancer driver gene identification into four steps and marked with‘a’,’b’,‘c’,
downstream genes’ expression will be included in our study. Then, the remaining mutated genes for all pa-tients were mapped to the human functional interaction network (human FIN) to construct the Mut-Mut matrix. Thirdly, the tissue-specific pearson correlation coeffi-cient (PCC) matrix was constructed by calculating the co-expression values of mutated genes derived from downloaded tissue expression information after search-ing the disease-tissue matrix. Finally, we calculated the edge clustering coefficient (ECC) values for the interac-tions in the network which established at the last step and assigned each mutated gene in the network a score by firstly summing up ECC values of its connected edges and then multiplying the addictive result to its corre-sponding variation frequency. According to the scores, the mutated genes were ranked in a descending order and those ranked at the top of the list were considered as potential cancer driver genes.
Experimental data
The datasets in this study derived from three places. The first part includes the somatic mutation data and their corresponding transcriptional expression data for each patient. Both of these datasets were downloaded from the TCGA website by utilizing the TCGA2STAT R packages. For our analysis, we focused on the somatic mutation and gene transcriptional expression data for 230 lung cancer patients, 974 breast cancer patients and 331 prostate cancer patients. The downloaded TCGA datasets include both tumor and normal patients: 58 of 230 lung, 110 of 974 breast and 52 of 331 prostate are normal patients.
The second part of dataset is the tissue-specific ex-pression profiles. In order to find the most related tis-sues for each cancer type, we searched the tissue-disease matrix which can be downloaded from the reference [34]. Each entry in the matrix represents the covariance of a disease with a tissue through the way of counting the number of publications co-appearing the disease and tissue, relative to the number of publications mentioning the disease or tissue alone. It is acknowledged that gen-etic disorders tend to manifest only in a single or few tis-sues for a given disease [34]. Hence, we chose one or two of the most relevant tissues for each cancer type. Fortunately, the directly related tissue can be found for most of cancer type e.g. the lung tissue for lung cancer, prostate tissue for prostate cancer. However, we cannot find the breast tissue in the disease-tissue matrix. In-stead, we chose the top two relevant tissues (e.g. pros-tate, ovary) with higher association score for breast cancer. In order to obtain the tissue-specific expression profiles, we used the Gene Expression Omnibus (GEO) database. Because GEO database is currently the largest and most famous expression data platform which stores
relatively complete expression data. According to the identified most related tissues for each cancer type, we downloaded the gene expression details of each tissue sample from the GEO website by querying dataset GSE7307. The database lists the transcriptional profile of both normal and disease human tissues representing over 90 distinct tissue types by using the Affymetrix hu-man U133 plus 2.0 array. At here, we used the R pack-age called GEOquery to download the corresponding
tissue expression information from the platform
GPL570. The downloaded data is the expression profile matrix with genes and patients as the columns and rows respectively.
The last part of the dataset comes from the currently release version (2016) of human functional interaction network (human FIN) in which involving 12,275 genes and 46,0434 edges [35]. This network is constructed by extending curated pathways with non-curated sources of information, including protein-protein interactions, gene co-expression, protein domain interaction, Gene Ontol-ogy (GO) annotations and text-mined protein interac-tions, which cover close to 50% of the human proteome. The benchmarking of driver genes was downloaded from the NCG 4.0 which included 537 known cancer genes from the Cancer Gene Census [36] and 1463 candidate cancer genes that were derived from the manual cur-ation of 77 whole genome or whole exome cancer-resequencing screenings [37] .
Filtering mutated genes and constructing Mut-Mut matrix
The somatic mutation data were downloaded from TCGA website where records the information of mu-tated gene across patients. The genes that were mumu-tated in at least one patient were kept and regarded as the mutated genes. Previous researches have pointed out that driver genes are more likely to regulate the expres-sion of downstream genes [29–31]. Those gene whose expression were impacted significantly are called outly-ing genes. In order to acquire the outlyoutly-ing genes, we downloaded the transcriptional expression information from the TCGA website and calculated their z-scores. More specifically, for each gene and each patient, a gene was regarded as the outlying gene for the patient if its
z-score > 2.0 or its z-z-score <−2.0. The setting of threshold
Assigning weight to Mut-Mut matrix by PCC values
Since the majority of disease genes forming a common functional module tend to be expressed similarly in the same tissue and there exist too much false positive con-nections in the gene networks, in this work, we use tissue-specific expression profile to assign weights for the interactions of genes in order to improve the reliabil-ity of genes interactive network. For each cancer type, at first, we chose the most related tissue according to its association score in the disease-tissue matrix [34]. If there is at least one tissue related with a cancer in the disease-tissue matrix, its corresponding tissue expression information across a cohort of patients can be down-loaded from the GEO website. After that, we calculated the gene-gene PCC values of downloaded tissue expres-sion matrix across the whole patients and then gener-ated the PCC matrix by keeping their absolute PCC values more than 0.3 while left setting to 0. The thresh-old setting was according to previous research [34]. At last, the average score of PCC matrix of each tissue was regarded as the final tissue-specific PCC matrix of the cancer type. We assigned a weight to values in the Mut-Mut matrix based on the tissue-specific PCC matrix. Specifically, if a mutated gene i connects to a mutated gene j in the Mut-Mut matrix (e.g. W(i,j) = 1), the PCC value of genes i and j was assigned to the corresponding entry of the Mut-Mut matrix otherwise the value was set to 0. Consequently, a weighted mutated PCC matrix de-noted by W is constructed.
Calculating the mutated gene score
Previous studies have found that cancer is the fact that genes act together in various signaling pathway and pro-tein complexes [25]. Hence, in order to highlight the modularity of cancer driver genes, we calculated the ECC values for each pair of mutated genes in the mu-tated PCC matrix. The ECC value was normally used to measure the degree of closeness between two nodes in a network, which has been widely applied in detecting net-work modules [38–40]. We calculated the ECC values for each pair of mutated genes in the weighted mutated
PCC matrix (denoted by Matrix W in Eq.1). The higher
ECC value means two genes are more likely to act to-gether in a common module. The definition of ECC is as
Eq. 1. After calculating the ECC score for each pair of
mutated genes in the weighted mutated PCC matrix, we assigned each mutated gene a score (Mi) by summing
up all ECC values of its connecting edges (see Eq.2). It
is known that cancer driver genes are more likely to be those frequently mutated in many patients. Hence, the final ranking score of each mutated gene was calculated by multiplying its variation frequency to its additive
score (see Eq. 3). After that, all mutated genes were
ranked in a descending order according to their ranking
scores and the genes with the higher rank are more likely to be the cancer driver genes.
ECC ið Þ ¼;j
Pn
k∈i∩jWikþWjk min di;dj
ð1Þ
Mi¼X
n
j∈Ni
ECC ið Þ;j ð2Þ
Fi¼Vi∙Mi ð3Þ
Where W denotes weighted mutated PCC matrix. k
denotes the common neighbors between mutated gene i
and gene j in the matrix W. Wik is the weight between
mutated gene i and gene k. diand dj are the degrees of
nodes i and j, respectively. Min (di,dj) represents the
maximal possible number of triangles that might include
the edge(i,j). Ni is the set of all neighbors of mutated
gene i. Videnotes variation frequency of gene i which is
measured by mutated times of gene i out of total patient counts.
Statistic evaluation metrics
In order to evaluate the performance of our method, top N of ranked genes were selected as potential cancer driver genes. The accuracy of prediction depends on how well the predicted cancer driver genes match the real ones, which was measured by three widely used stat-istic metrics, Precision, Recall and Fscore.
Precision¼ TP
TPþFP
Recall¼ TP
TPþFN
Fscore¼2∙ Precision∙Recall PrecisionþRecall
where TP (true positive) is the number of predicted driver genes matched by known driver genes in bench-marking dataset. TN (true negative) is the number of not predicted driver genes that are not matched by known ones. FP (False Positive) is the number of pre-dicted driver genes that are not matched by known driver genes. FN (false negative) is the number of known driver genes that are not matched by predicted ones.
Enrichment analysis
functional regions of protein (such as kinase domains and binding domains) to interrupt the major biological func-tions [41]. In this study, we leveraged the DAVID database to do the KEGG pathway enrichment analysis and GO en-richment analysis [42].
Results
In order to testify the effectiveness of our method, we applied our method and other four models:
DriverNet [29], DawnRank [31] and Diffusion algo-rithm [30], Muffinn [28] on the breast cancer, prostate cancer and lung cancer to identify their driver genes. Among them, the DriverNet, DawnRank and Shi’s Diffu-sion algorithm utilize the gene dysregulated expresDiffu-sion information to identify outlying genes and construct the bipartite graph. These methods ranked mutated genes according to their connections with the outlying genes. The Muffinn method leverages both the variation fre-quency of mutated genes and the impact of their neigh-bors to design the ranking scores. It was further classified into two models: Muf_max and Muf_sum, ac-cording to considering the impact of either the most fre-quently mutated neighbor or all direct neighbors [28]. Unlike the DriverNet, DawnRank and Shi’s diffusion method that use gene dysregulated expression to con-struct bipartite graph, our study only employs the dys-regulated expression profile to filter the mutated genes. Moreover, similar to the Muffinn method, we also con-sider the variation frequency of mutated genes and the impact of their direct neighbors. However, compared with other methods, our method not only integrates the features of dysregulated expression information, vari-ation frequency and human FIN but also considers the modularity of mutated genes and their co-expression in the same tissue.
Running DawnRank demands expression data with normal and tumor samples. From the three cancer data-sets, we can only download 110, 58, 52 tumor samples that have normal gene expression profiles for breast, lung and prostate respectively. Besides, we set the free parameter of DawnRank as three which was recom-mended by DawnRank authors [31].
Comparing performance
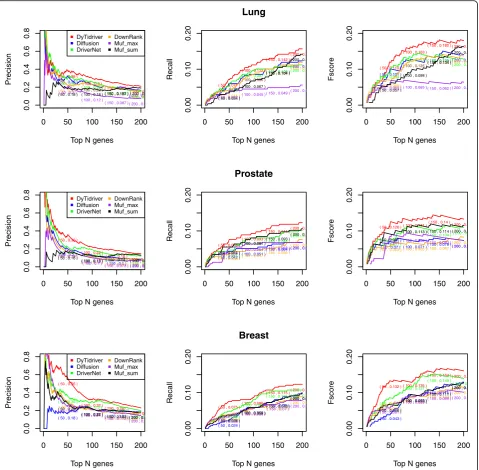
All the mutated genes were ranked in a descending order based on the scores assigned by each comparing method. After that, K of genes ranked in the top list were selected as candidate driver genes. According to the benchmark dataset, the Fscore, Recall, Precision values can be calculated to evaluate the performance of each method. With different values of K ranging from 1 to 200, the Fscore curve, Recall curve and Precision
curve is drawn. The results are shown in the Fig. 2. In
general, our results are superior to all of other four
methods on the lung, prostate and breast cancer data-sets. Compared with the other five methods, our model identifies the largest number of known drivers from NCG 4.0. For lung cancer, the Dytidriver and the other methods are tangled together when predicting small number of potential driver genes and then Dytidriver is significantly better than the other methods when the number of predicted driver genes increases from top 40 to 200. For prostate and breast cancer, our model dem-onstrated the best performance from beginning to the end. Similar to Muffinn, considering the variation fre-quency and the functional impact of direct neighbors, our method additionally takes advantage of the tissue-specific co-expression property and the modularity prop-erty which improve the precision of detecting driver genes to a higher level. Besides, the performance of Muf_max is worse than that of Muf_sum, which means it is inappropriate to judge a driver only based on the impact of single gene. DawnRank performed poorly among all comparing methods. The reason might be that only a limited number of cancer patients both have nor-mal and tumor expression data for DawnRank.
Enrichment analysis
We select the top 200 of cancer driver genes to do GO and pathway enrichment analysis. For lung cancer, in the biological process, the genes detected by our method enrich in the signal transduction, intracellular signaling cascade, transcription, metabolic process, regulation of cell death and apoptosis etc. In the cellular component, our results focus on the plasma membrane, organelle, cytoskeleton, lumen and cell fraction etc. In the molecu-lar function, our results enrich in ion binding, nucleotide binding, ATP binding, transcription regulator activity etc. From the pathway aspect, our identified cancer driver genes enrich in some important cancer pathway, such as calcium signaling pathway, PI3K-Akt signaling pathway, mTOR signaling pathway.
With respect to the breast cancer, in biological process, our results enrich in the intracellular signaling cascade, signal transduction, regulation of transcription, metabolic process, regulation of cell death, phosphoryl-ation, transcription, phosphorylation and cell prolifera-tion. In the cellular component, our results enrich in the plasma membrane, organelle, lumen and cell fraction. In the molecular function, our results mainly enrich in the nucleotide binding, ATP binding, DNA binding, tran-scription regulator activity and kinase activity. In path-way analysis, our results enrich in Calcium signaling pathway, MAPK signaling pathway, PI3K signaling path-way, p53 signaling pathway etc.
For cellular component, our results enrich in nucleus, plasma membrane, cytosol, intracellular, protein complex etc. For molecular function, our results focus on protein binding, ATP binding, DNA binding, protein kinase activity and so on. From pathway aspect, our results enrich in the Calcium signaling pathway, PI3K signaling pathway, cAMP signaling pathway, mTOR signaling pathway.
Cociter analysis
Because the benchmark cancer driver genes are incom-plete, to further prove the prediction capability of our
method in distinguishing potentially cancer driver genes, we adopted the literature mining method to figure out the co-citation times of the predicted driver genes with
the keywords ‘cancer type’(i.e. breast, prostate or lung),
‘driver’and ‘cancer’ in the cociter website [25]. The
lar-ger the number of times the gene co-appeared with the keywords, the stronger associations between them. In
this study, Tables1,2 and3show the cociter analysis of
top 30 of genes identified by our method for each cancer type. In order to illustrate the capability of our method to prioritize significant well-known cancer driver genes,
0 50 100 150 200
0.0
0.2
0.4
0.6
0.8
Top N genes
Precision
( 50 , 0.38 ) ( 100 , 0.3 )
( 150 , 0.253 ) ( 200 , 0.
( 50 , 0.32 )
( 100 , 0.23 ) ( 150 , 0.193 )
( 200 , 0.1
( 50 , 0.3 ) ( 100 , 0.26 )
( 150 , 0.193 ) ( 200 , 0. ( 50 , 0.22 )( 100 , 0.23 )
( 150 , 0.187 )( 200 , 0.
( 50 , 0.2 ) ( 100 , 0.12 )
( 150 , 0.087 ) ( 200 , 0.0
( 50 , 0.18 )( 100 , 0.18 ) ( 150 , 0.187 ) ( 200 , 0.
DyTidriver Diffusion DriverNet DownRank Muf_max Muf_sum
0 50 100 150 200
0.00
0.10
0.20
Top N genes
Recall
( 50 , 0.071 ) ( 100 , 0.112 )
( 150 , 0.142 ) ( 200 , 0.1
( 50 , 0.06 ) ( 100 , 0.086 )
( 150 , 0.108 ) ( 200 , 0.1
( 50 , 0.056 ) ( 100 , 0.097 )
( 150 , 0.108 ) ( 200 , 0.1
( 50 , 0.041 ) ( 100 , 0.086 )
( 150 , 0.104 ) ( 200 , 0.1
( 50 , 0.037 )( 100 , 0.045 ) ( 150 , 0.049 ) ( 200 , 0.0
( 50 , 0.034 ) ( 100 , 0.067 )
( 150 , 0.104 ) ( 200 , 0.1
Lung
0 50 100 150 200
0.00
0.10
0.20
Top N genes
Fscore
( 50 , 0.119 ) ( 100 , 0.163 )
( 150 , 0.182 ) ( 200 , 0.1
( 50 , 0.101 ) ( 100 , 0.125 )
( 150 , 0.139 ) ( 200 , 0.1
( 50 , 0.094 )
( 100 , 0.141 ) ( 150 , 0.139 ) ( 200 , 0.1
( 50 , 0.069 )
( 100 , 0.125 )( 150 , 0.134 ) ( 200 , 0.1
( 50 , 0.063 ) ( 100 , 0.065 ) ( 150 , 0.062 ) ( 200 , 0.0
( 50 , 0.057 ) ( 100 , 0.098 )
( 150 , 0.134 ) ( 200 , 0.1
0 50 100 150 200
0.0 0 .2 0.4 0.6 0.8
Top N genes Precision ( 50 , 0.36 )
( 100 , 0.22 ) ( 150 , 0.18 )
( 200 , 0.1
( 50 , 0.2 )
( 100 , 0.12 )( 150 , 0.1 ) ( 200 , 0.
( 50 , 0.22 ) ( 100 , 0.19 )
( 150 , 0.133 ) ( 200 , 0. ( 50 , 0.18 )
( 100 , 0.11 )( 150 , 0.087 ) ( 200 , 0.
( 50 , 0.18 ) ( 100 , 0.1 )
( 150 , 0.073 ) ( 200 , 0.
( 50 , 0.16 )
( 100 , 0.13 ) ( 150 , 0.14 ) ( 200 , 0.
DyTidriver Diffusion DriverNet DownRank Muf_max Muf_sum
0 50 100 150 200
0.00
0.10
0.20
Top N genes
Recall
( 50 , 0.076 ) ( 100 , 0.093 )
( 150 , 0.114 )( 200 , 0.1
( 50 , 0.042 )( 100 , 0.051 )
( 150 , 0.064 ) ( 200 , 0.0
( 50 , 0.047 )
( 100 , 0.081 ) ( 150 , 0.085 ) ( 200 , 0.1
( 50 , 0.038 )( 100 , 0.047 ) ( 150 , 0.055 )
( 200 , 0.0
( 50 , 0.051 )
( 100 , 0.064 ) ( 150 , 0.068 ) ( 200 , 0.0
( 50 , 0.055 ) ( 100 , 0.081 )
( 150 , 0.093 ) ( 200 , 0.1
Prostate
0 50 100 150 200
0.00
0.10
0.20
Top N genes
Fscore
( 50 , 0.126 )( 100 , 0.131 ) ( 150 , 0.14 )
( 200 , 0.1
( 50 , 0.07 ) ( 100 , 0.071 )( 150 , 0.078 )( 200 , 0.0
( 50 , 0.077 ) ( 100 , 0.113 )
( 150 , 0.104 )( 200 , 0.
( 50 , 0.063 ) ( 100 , 0.065 ) ( 150 , 0.067 ) ( 200 , 0.0
( 50 , 0.084 )( 100 , 0.089 )( 150 , 0.083 ) ( 200 , 0.0
( 50 , 0.091 )
( 100 , 0.113 ) ( 150 , 0.114 ) ( 200 , 0.1
0 50 100 150 200
0.0 0 .2 0.4 0 .6 0.8
Top N genes
Precision
( 50 , 0.56 )
( 100 , 0.32 ) ( 150 , 0.287 )
( 200 , 0.
( 50 , 0.18 ) ( 100 , 0.22 )
( 150 , 0.2 ) ( 200 , 0.1
( 50 , 0.36 ) ( 100 , 0.3 )
( 150 , 0.26 ) ( 200 , 0 ( 50 , 0.3 )
( 100 , 0.21 )
( 150 , 0.18 ) ( 200 , 0.1
( 50 , 0.26 ) ( 100 , 0.21 )
( 150 , 0.173 )( 200 , 0.1
( 50 , 0.28 ) ( 100 , 0.22 )
( 150 , 0.193 ) ( 200 , 0.1
DyTidriver Diffusion DriverNet DownRank Muf_max Muf_sum
0 50 100 150 200
0.00
0.10
0.20
Top N genes
Recall
( 50 , 0.075 ) ( 100 , 0.086 )
( 150 , 0.115 )( 200 , 0.1
( 50 , 0.024 ) ( 100 , 0.059 )
( 150 , 0.08 ) ( 200 , 0.0
( 50 , 0.048 ) ( 100 , 0.08 )
( 150 , 0.105 ) ( 200 , 0.1
( 50 , 0.04 ) ( 100 , 0.056 )
( 150 , 0.072 ) ( 200 , 0.0
( 50 , 0.035 ) ( 100 , 0.056 )
( 150 , 0.07 )( 200 , 0.0
( 50 , 0.038 ) ( 100 , 0.059 )
( 150 , 0.078 ) ( 200 , 0.0
Breast
0 50 100 150 200
0.00
0.10
0.20
Top N genes
Fscore
( 50 , 0.132 ) ( 100 , 0.135 )
( 150 , 0.164 ) ( 200 , 0.1
( 50 , 0.043 ) ( 100 , 0.093 )
( 150 , 0.115 ) ( 200 , 0.1
( 50 , 0.085 ) ( 100 , 0.127 )
( 150 , 0.149 ) ( 200 , 0.
( 50 , 0.071 ) ( 100 , 0.089 )
( 150 , 0.103 ) ( 200 , 0.1
( 50 , 0.061 )
( 100 , 0.089 )( 150 , 0.099 ) ( 200 , 0.1
( 50 , 0.066 ) ( 100 , 0.093 )
( 150 , 0.111 ) ( 200 , 0.1
we also listed genes ranking position in other five methods.
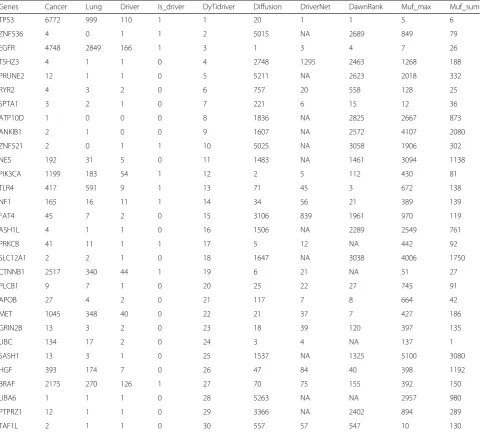
For lung cancer, Table1shows some well-studied
can-cer driver genes were ranked in the top 30 by our methods, but were put in the latter positions by other methods. For example, Phosphatidylinositol 3-kinases (PI3Ks) are well known regulators of cellular growth and proliferation. It was ranked 12th by our method while ranked 112th by Dawnrank, 430th by Muf_max, 81th by Muf_sum. Toll-like receptor-4 (TLR4) in human tumors often correlates with chemoresistance and metastasis [43] which was ranked 13th by our method, ranked 71th by Diffusion algorithm while ranked 672th by Muf_max
and 138th by Muf_sum. The oncogenic BRAF(V600E) mutation results in an active structural conformation characterized by greatly elevated ERK activity [44]. It was identified as the known cancer driver genes but ranked 70th, 75th, 155th, 392th and 150th by Diffusion, DriverNet and DawnRank, Muf_max and Muf_sum re-spectively. Our method can not only prioritize the sig-nificant cancer driver genes but also identify some potential cancer driver genes which were neglected by the NCG 4.0 such as the NES, MET and HGF. Especially for the MET, some researchers found that high MET gene copy number leads to shorter survival in patients with non-small cell lung cancer. MET co-existed with Table 1Cociter analysis of top 30 lung cancer driver genes identified by our method
Genes Cancer Lung Driver Is_driver DyTidriver Diffusion DriverNet DawnRank Muf_max Muf_sum
TP53 6772 999 110 1 1 20 1 1 5 6
ZNF536 4 0 1 1 2 5015 NA 2689 849 79
EGFR 4748 2849 166 1 3 1 3 4 7 26
TSHZ3 4 1 1 0 4 2748 1295 2463 1268 188
PRUNE2 12 1 1 0 5 5211 NA 2623 2018 332
RYR2 4 3 2 0 6 757 20 558 128 25
SPTA1 3 2 1 0 7 221 6 15 12 36
ATP10D 1 0 0 0 8 1836 NA 2825 2667 873
ANKIB1 2 1 0 0 9 1607 NA 2572 4107 2080
ZNF521 2 0 1 1 10 5025 NA 3058 1906 302
NES 192 31 5 0 11 1483 NA 1461 3094 1138
PIK3CA 1199 183 54 1 12 2 5 112 430 81
TLR4 417 591 9 1 13 71 45 3 672 138
NF1 165 16 11 1 14 34 56 21 389 139
FAT4 45 7 2 0 15 3106 839 1961 970 119
ASH1L 4 1 1 0 16 1506 NA 2289 2549 761
PRKCB 41 11 1 1 17 5 12 NA 442 92
SLC12A1 2 2 1 0 18 1647 NA 3038 4006 1750
CTNNB1 2517 340 44 1 19 6 21 NA 51 27
PLCB1 9 7 1 0 20 25 22 27 745 91
APOB 27 4 2 0 21 117 7 8 664 42
MET 1045 348 40 0 22 21 37 7 427 186
GRIN2B 13 3 2 0 23 18 39 120 397 135
UBC 134 17 2 0 24 3 4 NA 137 1
SASH1 13 3 1 0 25 1537 NA 1325 5100 3080
HGF 393 174 7 0 26 47 84 40 398 1192
BRAF 2175 270 126 1 27 70 75 155 392 150
UBA6 1 1 1 0 28 5263 NA NA 2957 980
PTPRZ1 12 1 1 0 29 3366 NA 2402 894 289
TAF1L 2 1 1 0 30 557 57 547 10 130
The second to the fourth column show the co-appeared times of top 30 identified genes with‘driver’,‘lung’and‘cancer’(from the left to the right). Is_Driver
key words, ‘cancer’, ‘lung’and ‘driver’ for 1045, 348 and 40 times.
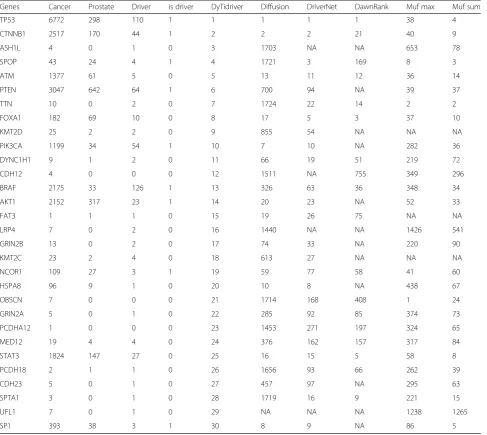
For the prostate cancer as shown in Table 2, our
method also identified some high-ranking significant driver genes, including TP53, CTNNB1, PTEN, PIK3CA and so on. What we want to mention is the famous tumor suppressor PTEN which is frequently inactivated in human prostate cancer [45]. It was ranked 6th by our method but strangely put in the 700th by Diffusion algo-rithm, 94th by DriverNet and even neglected by Dawn-Rank. Furthermore, the results show DawnRank missed more than one significant cancer driver genes including PTEN, PIK3CA and AKT1. BRAF which involves in
prostate related RAS/RAF/ERK signaling pathway [28] was ranked 13th by our methods while 326th by Diffu-sion algorithm, 63th by DriverNet, 36th by DawnRank, 348th by Muf_max and 34th by Muf_sum. Besides, some high associated genes ignored by NCG 4.0 are also ranked in the top list of our method. The ATM (ataxia telangiectasia mutated) kinase plays an essential role in maintaining genome integrity by coordinating cell cycle arrest, apoptosis, and DNA damage repair [46]. It was
missed by the NCG 4.0 but co-appeared with‘cancer’for
1377 times, with‘prostate’for 61 times and with ‘driver’
for 5 times. Forkhead box protein A1 (FOXA1) modulates the transactivation of steroid hormone receptors and thus Table 2Cociter analysis of top 30 prostate cancer driver genes identified by our method
Genes Cancer Prostate Driver is driver DyTidriver Diffusion DriverNet DawnRank Muf max Muf sum
TP53 6772 298 110 1 1 1 1 1 38 4
CTNNB1 2517 170 44 1 2 2 2 21 40 9
ASH1L 4 0 1 0 3 1703 NA NA 653 78
SPOP 43 24 4 1 4 1721 3 169 8 3
ATM 1377 61 5 0 5 13 11 12 36 14
PTEN 3047 642 64 1 6 700 94 NA 39 37
TTN 10 0 2 0 7 1724 22 14 2 2
FOXA1 182 69 10 0 8 17 5 3 37 10
KMT2D 25 2 2 0 9 855 54 NA NA NA
PIK3CA 1199 34 54 1 10 7 10 NA 282 36
DYNC1H1 9 1 2 0 11 66 19 51 219 72
CDH12 4 0 0 0 12 1511 NA 755 349 296
BRAF 2175 33 126 1 13 326 63 36 348 34
AKT1 2152 317 23 1 14 20 23 NA 52 33
FAT3 1 1 1 0 15 19 26 75 NA NA
LRP4 7 0 2 0 16 1440 NA NA 1426 541
GRIN2B 13 0 2 0 17 74 33 NA 220 90
KMT2C 23 2 4 0 18 613 27 NA NA NA
NCOR1 109 27 3 1 19 59 77 58 41 60
HSPA8 96 9 1 0 20 10 8 NA 438 67
OBSCN 7 0 0 0 21 1714 168 408 1 24
GRIN2A 5 0 1 0 22 285 92 85 374 73
PCDHA12 1 0 0 0 23 1453 271 197 324 65
MED12 19 4 4 0 24 376 162 157 317 84
STAT3 1824 147 27 0 25 16 15 5 58 8
PCDH18 2 1 1 0 26 1656 93 66 262 39
CDH23 5 0 1 0 27 457 97 NA 295 63
SPTA1 3 0 1 0 28 1719 16 9 221 15
UFL1 7 0 1 0 29 NA NA NA 1238 1265
SP1 393 38 3 1 30 8 9 NA 86 5
The second to the fourth column show the co-appeared times of top 30 identified genes with‘driver’,‘prostate’and‘cancer’(from the left to the right). Is_driver
may influences tumor growth and hormone responsive-ness in prostate cancer [47]. It was ranked 8th by our method while neglected by NCG 4.0. In addition, the tran-scription factors SP1 also has been missed by NCG 4.0.
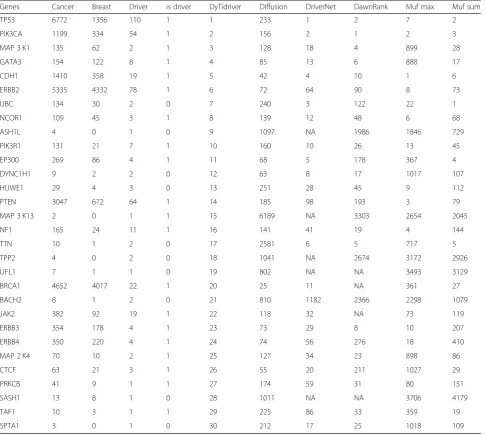
For breast cancer in Table 3, our method successfully
achieved a high precision in identifying the top 10 cancer driver genes with 8 out of 10 accuracy rates. The well-studied breast cancer driver genes including TP53, PIK3CA, MAP 3 K1, CDH1, ERBB2 and PTEN were also put in the top list of our method. Among those known breast cancer driver genes, the top three cancer driver genes (TP53, PIK3CA, MAP 3 K1) identified by our methods were ranked 233th, 156th and 128th respectively
by Diffusion algorithm. The HER2 (official name is ERBB2) gene encodes a membrane receptor in the epider-mal growth factor receptor family amplified and over expressed in adenocarcinoma [48]. It was regarded as the important cancer driver gene by many researchers and ranked 6th by our method while 72th, 64th, 90th, 73th by Diffusion algorithm, DriverNet, DawnRank and Muf_sum respectively. The breast cancer suppressor gene PTEN was ranked 14th by our method while 185th, 98th, 93th and 79th by Diffusion, DriverNet, DawnRank and Muf_ sum receptively. Besides, the BRCA1 and JAK2 that
co-cited with ‘cancer’ and ‘breast’ for many times were also
missed by the DawnRank. Table 3Co-citer analysis of top 30 breast cancer driver genes identified by our method
Genes Cancer Breast Driver is driver DyTidriver Diffusion DriverNet DawnRank Muf max Muf sum
TP53 6772 1356 110 1 1 233 1 2 7 2
PIK3CA 1199 334 54 1 2 156 2 1 2 3
MAP 3 K1 135 62 2 1 3 128 18 4 899 28
GATA3 154 122 8 1 4 85 13 6 888 17
CDH1 1410 358 19 1 5 42 4 10 1 6
ERBB2 5335 4332 78 1 6 72 64 90 8 73
UBC 134 30 2 0 7 240 3 122 22 1
NCOR1 109 45 3 1 8 139 12 48 6 68
ASH1L 4 0 1 0 9 1097 NA 1986 1846 729
PIK3R1 131 21 7 1 10 160 10 26 13 45
EP300 269 86 4 1 11 68 5 178 367 4
DYNC1H1 9 2 2 0 12 63 8 17 1017 107
HUWE1 29 4 3 0 13 251 28 45 9 112
PTEN 3047 672 64 1 14 185 98 193 3 79
MAP 3 K13 2 0 1 1 15 6189 NA 3303 2654 2045
NF1 165 24 11 1 16 141 41 19 4 144
TTN 10 1 2 0 17 2581 6 5 717 5
TPP2 4 0 2 0 18 1041 NA 2674 3172 2926
UFL1 7 1 1 0 19 802 NA NA 3493 3129
BRCA1 4652 4017 22 1 20 25 11 NA 361 27
BACH2 8 1 2 0 21 810 1182 2366 2298 1079
JAK2 382 92 19 1 22 118 32 NA 73 119
ERBB3 354 178 4 1 23 73 29 8 10 207
ERBB4 350 220 4 1 24 74 56 276 18 410
MAP 2 K4 70 10 2 1 25 127 34 23 898 86
CTCF 63 21 3 1 26 55 20 211 1027 29
PRKCB 41 9 1 1 27 174 59 31 80 151
SASH1 13 8 1 0 28 1011 NA NA 3706 4179
TAF1 10 3 1 1 29 225 86 33 359 19
SPTA1 3 0 1 0 30 212 17 25 1018 109
The second to the fourth column show the co-appeared times of top 30 identified genes with‘driver’,‘breast’and‘cancer’(from the left to the right). is_driver
Discussion
The core step to overcome cancer is to identify the cancer driver genes which can promote cancer evolvement and de-velopment. However, it is a hard task since cancer is hetero-geneous and there are too much irrelevant passenger genes. Recently, many methods try to shorten the distance to the truth. However, these methods still have some limitations. For example, they ignored many driver genes with low vari-ation frequency and highly depend on the error-prone net-work. Inspired by the fact that cancer genes forming functional modules tend to be expressed similarly in the same tissue, we considered to improve the reliability of the gene functional interaction network by incorporating the ex-pression similarity between mutated gene pairs in the
can-cers’ related tissues. In order to obtain the tissue-specific
expression profiles, we used the GEO database. Because GEO database is currently the largest and most famous pression data platform which stores relatively complete ex-pression data. The GEO dataset which we used in this work was consisted of a total of 677 patients, including cancer and normal patients, covered over 90 distinct tissue types and was created by the same organization using the same experi-mental technology. Although our model is superior to the other methods, it still has some limitations. For example, the datasets used in this work come from different projects: TCGA and GEO. Although, we just use the GEO dataset to calculate the co-expression values of mutated genes in a spe-cific tissue. The likelihood is that there exists ambiguous since the heterogeneous within different patients. Therefore, in order to release this concern, in the future, we consider to unify the dataset as far as possible.
Conclusion
In this work, we proposed a new method to identify cancer driver genes by integrating the gene dysregulated expres-sion, tissue-specific expression and variation frequency into the functional interaction network. Compared to other network-based methods, our method not only considered that driver genes have impact on the expression of down-stream genes, but also took advantage of the modularity property of driver genes, their co-expression in specific tis-sues and itself variation frequency. We compared our re-sults with other four similar methods and did cociter analysis and enrichment analysis. From the results, we can easily draw the conclusion that our method has the capabil-ity to identify the cancer driver genes with high precision and meanwhile detect some potential unknown cancer driver genes. Besides, the enrichment analysis also illus-trates that the top ranking cancer driver genes in our list enrich in some significant cancer-related pathways and im-plement important functions [48].
Abbreviations
ECC:edge clustering coefficient; GEO: Gene Expression Omnibus; human FIN: human functional interaction network; ICGC: Cancer Genome
Consortium; PCC: Pearson correlation coefficient; TCGA: The Cancer Genome Atlas
Acknowledgements
We appreciate Dr. Shi for providing the Diffusion algorithm’s source code and related datasets and the reviews for their helpful comments and constructive suggestions.
About this supplement
This article has been published as part of BMC Medical Genomics, Volume 12 Supplement 7, 2019: Selected articles from the 14th International Symposium on Bioinformatics Research and Applications (ISBRA-18): medical genomics. The full contents of the supplement are available athttps://
bmcmedgenomics.biomedcentral.com/articles/supplements/volume-12-supplement-7
Authors’contributions
JS collected the datasets of three cancers, human functional interaction network and tissue specific information. WP and JS designed the Dytidriver method and analyzed the result. JS, WP and FW discussed extensively about this study and drafted the manuscript together. JS, WP, FW and JW participated in revisiting and modifying the draft. All authors have read and approved the manuscript.
Funding
This work is supported in part by the National Natural Science Foundation of China under grant No.31560317, No.61972185, 61702122, No.61472133 and No.81560221. Natural Science Foundation of Yunnan Province of China (No. 2019FA024), Yunnan Ten Thousand Talents Plan young. The funders played roles in the design of study, collection, analysis and interpretation of data, writing the manuscript and will pay the publish fee of the manuscript.
Availability of data and materials
The source code and datasets used in this research can be downloaded fromhttps://github.com/weiba/DyTidriver.
Ethics approval and consent to participate
Not applicable.
Consent for publication
Not applicable.
Competing interests
The authors declare that they have no competing interests.
Author details
1Faculty of Management and Economics/Faculty of Information Engineering and Automation/Technology Application Key Lab of Yunnan Province, Kunming University of Science and Technology, Kunming, Yunnan 650500, People’s Republic of China.2School of Information Science and Engineering, Central South University, Changsha, Hunan 410083, People’s Republic of China.
Received: 6 November 2019 Accepted: 11 November 2019 Published: 30 December 2019
References
1. Baker SG. The questionable premises underlying the search for cancer driver mutations and cancer susceptibility genes. Organisms Journal of Biological Sciences. 2017;1(1):3–4.
2. Kumar S, Warrel J, Mcgillivray P, Meyerson W, Li S, Salichos L, et al. Passenger mutation landscape in cancer genomes. AACR. 2018:1279–9. 3. Yates LR, Campbell PJ. Evolution of the cancer genome. Nat Rev Genet.
2012;13(11):795.
4. Collier O, Stoven V, Vert J-P. LOTUS: a single-and multitask machine learning algorithm for the prediction of cancer driver genes. PLoS Comput Biol. 2019;15(9):e1007381.
6. Network CGAR. Comprehensive genomic characterization defines human glioblastoma genes and core pathways. Nature. 2008;455(7216):1061. 7. Consortium ICG. International network of cancer genome projects. Nature.
2010;464(7291):993.
8. Stratton MR, Campbell PJ, Futreal PA. The cancer genome. Nature. 2009; 458(7239):719.
9. Pon JR, Marra MA. Driver and passenger mutations in cancer. Annual Review of Pathology: Mechanisms of Disease. 2015;10:25–50. 10. Kandoth C, McLellan MD, Vandin F, Ye K, Niu B, Lu C, et al. Mutational
landscape and significance across 12 major cancer types. Nature. 2013; 502(7471):333.
11. Vogelstein B, Papadopoulos N, Velculescu VE, Zhou S, Diaz LA, Kinzler KW. Cancer genome landscapes. Science. 2013;339(6127):1546–58.
12. Network CGAR. Integrated genomic and molecular characterization of cervical cancer. Nature. 2017;543(7645):378.
13. Ding L, Getz G, Wheeler DA, Mardis ER, McLellan MD, Cibulskis K, et al. Somatic mutations affect key pathways in lung adenocarcinoma. Nature. 2008;455(7216):1069.
14. Morin RD, Mendez-Lago M, Mungall AJ, Goya R, Mungall KL, Corbett RD, et al. Frequent mutation of histone-modifying genes in non-Hodgkin lymphoma. Nature. 2011;476(7360):298.
15. Paez JG, Jänne PA, Lee JC, Tracy S, Greulich H, Gabriel S, et al. EGFR mutations in lung cancer: correlation with clinical response to gefitinib therapy. Science. 2004;304(5676):1497–500.
16. Chen P-L, Chen Y, Bookstein R, Lee W-H. Genetic mechanisms of tumor suppression by the human p53 gene. Science. 1990;250(4987):1576–80. 17. Gemignani ML, Schlaerth AC, Faina B, Barakat RR, Oscar L, Robert S, et al.
Role of KRAS and BRAF gene mutations in mucinous ovarian carcinoma. Gynecol Oncol. 2003;90(2):378–81.
18. Schechter AL, Stern DF, Vaidyanathan L, Decker SJ, Drebin JA, Greene MI, et al. The neu oncogene: an erb-B-related gene encoding a 185,000-Mr tumour antigen. Nature. 1984;312(5994):513.
19. Reimand J. Candidate non-coding driver mutations in super-enhancers and long-range chromatin interaction networks across 1,800 whole cancer genomes. AACR. 2018:2354–4.
20. Lawrence MS, Stojanov P, Polak P, Kryukov GV, Cibulskis K, Sivachenko A, et al. Mutational heterogeneity in cancer and the search for new cancer-associated genes. Nature. 2013;499(7457):214.
21. Banerji S, Cibulskis K, Rangel-Escareno C, Brown KK, Carter SL, Frederick AM, et al. Sequence analysis of mutations and translocations across breast cancer subtypes. Nature. 2012;486(7403):405.
22. Dees ND, Zhang Q, Kandoth C, Wendl MC, Schierding W, Koboldt DC, et al. MuSiC: identifying mutational significance in cancer genomes. Genome Res. 2012;22(8):1589.
23. Cheng F, Zhao J, Zhao Z. Advances in computational approaches for prioritizing driver mutations and significantly mutated genes in cancer genomes. Brief Bioinform. 2015;17(4):642–56.
24. Wei P-J, Zhang D, Xia J, Zheng C-H. LNDriver: identifying driver genes by integrating mutation and expression data based on gene-gene interaction network. BMC bioinformatics. 2016;17(17):467.
25. Vandin F, Upfal E, Raphael BJ. Algorithms for detecting significantly mutated pathways in cancer. J Comput Biol. 2011;18(3):507–22.
26. Leiserson MD, Vandin F, Wu H-T, Dobson JR, Eldridge JV, Thomas JL, et al. Pan-cancer network analysis identifies combinations of rare somatic mutations across pathways and protein complexes. Nat Genet. 2015;47(2):106. 27. Hofree M, Shen JP, Carter H, Gross A, Ideker T. Network-based stratification
of tumor mutations. Nat Methods. 2013;10(11):1108.
28. Cho A, Shim JE, Kim E, Supek F, Lehner B, Lee I. MUFFINN: cancer gene discovery via network analysis of somatic mutation data. Genome Biol. 2016;17(1):129. 29. Bashashati A, Haffari G, Ding J, Ha G, Lui K, Rosner J, et al. DriverNet: uncovering the impact of somatic driver mutations on transcriptional networks in cancer. Genome Biol. 2012;13(12):R124.
30. Shi K, Gao L, Wang B. Discovering potential cancer driver genes by an integrated network-based approach. Mol BioSyst. 2016;12(9):2921–31. 31. Hou JP, Ma J. DawnRank: discovering personalized driver genes in cancer.
Genome medicine. 2014;6(7):56.
32. Guo W-F, Zhang S-W, Liu L-L, Liu F, Shi Q-Q, Zhang L, et al. Discovering personalized driver mutation profiles of single samples in cancer by network control strategy. Bioinformatics. 2018;34(11):1893–903. 33. Ganegoda GU, Wang J, Wu F-X, Li M. Prediction of disease genes using
tissue-specified gene-gene network. BMC Syst Biol. 2014;8(3):S3.
34. Lage K, Hansen NT, Karlberg EO, Eklund AC, Roque FS, Donahoe PK, et al. A large-scale analysis of tissue-specific pathology and gene expression of human disease genes and complexes. Proc Natl Acad Sci. 2008;105(52):20870–5. 35. Wu G, Feng X, Stein L. A human functional protein interaction network and
its application to cancer data analysis. Genome Biol. 2010;11(5):R53. 36. Futreal PA, Coin L, Marshall M, Down T, Hubbard T, Wooster R, et al. A
census of human cancer genes. Nat Rev Cancer. 2004;4(3):177. 37. An O, Pendino V, D’Antonio M, Ratti E, Gentilini M, Ciccarelli FD: NCG 4.0:
the network of cancer genes in the era of massive mutational screenings of cancer genomes.Database. 2014;2014.
38. Wang J, Li M, Chen J, Pan Y. A fast hierarchical clustering algorithm for functional modules discovery in protein interaction networks. IEEE/ACM Transactions on Computational Biology and Bioinformatics (TCBB). 2011;8(3):607–20. 39. Peng W, Li M, Chen L, Wang L. Predicting protein functions by using
unbalanced random walk algorithm on three biological networks. IEEE/ACM transactions on computational biology and bioinformatics. 2017;14(2):360–9. 40. Peng W, Wang J, Zhao B, Wang L. Identification of protein complexes using weighted PageRank-nibble algorithm and core-attachment structure. IEEE/ ACM Transactions on Computational Biology and Bioinformatics (TCBB). 2015;12(1):179–92.
41. Song J, Peng W, Wang F: An Entropy-based method for identifying mutual exclusive driver genes in cancer.IEEE/ACM transactions on computational
biology and bioinformatics. 2019.2.7;https://doi.org/10.1109/TCBB.
42. Huang DW, Sherman BT, Lempicki RA. Systematic and integrative analysis of large gene lists using DAVID bioinformatics resources. Nat Protoc. 2008;4(1):44. 43. Rajput S, Volk-Draper LD, Ran S. TLR4 is a novel determinant of the
response to paclitaxel in breast cancer. Mol Cancer Ther. 2013;12(8):1676–87. 44. Lee MH, Lee SE, Kim DW, Ryu MJ, Kim SJ, Kim SJ, et al. Mitochondrial
localization and regulation of BRAFV600E in thyroid cancer: a clinically used RAF inhibitor is unable to block the mitochondrial activities of BRAFV600E. The Journal of Clinical Endocrinology & Metabolism. 2011;96(1):E19–30. 45. Kwak MK, Johnson DT, Zhu C, Lee SH, Ye D-W, Luong R, et al. Conditional
deletion of the Pten gene in the mouse prostate induces prostatic intraepithelial neoplasms at early ages but a slow progression to prostate tumors. PLoS One. 2013;8(1):e53476.
46. Fan C, Quan R, Feng X, Gillis A, He L, Matsumoto ED, et al. ATM activation is accompanied with earlier stages of prostate tumorigenesis. Biochimica et Biophysica Acta (BBA)-Molecular Cell Research. 2006;1763(10):1090–7. 47. Gerhardt J, Montani M, Wild P, Beer M, Huber F, Hermanns T, et al. FOXA1
promotes tumor progression in prostate cancer and represents a novel hallmark of castration-resistant prostate cancer. Am J Pathol. 2012;180(2):848–61. 48. Wen W, Xiao N, Bender R, Ghazalpour A, Tan Z, Swensen J, et al. Mutations
in the kinase domain of the HER2/ERBB2 gene identified in a wide variety of human cancers. The Journal of Molecular Diagnostics. 2015;17(5):487–95.
Publisher’s Note