www.geosci-instrum-method-data-syst.net/5/85/2016/ doi:10.5194/gi-5-85-2016
© Author(s) 2016. CC Attribution 3.0 License.
Arctic Snow Microstructure Experiment for the
development of snow emission modelling
William Maslanka1, Leena Leppänen2, Anna Kontu2, Mel Sandells3, Juha Lemmetyinen2, Martin Schneebeli4, Martin Proksch4, Margret Matzl4, Henna-Reetta Hannula2, and Robert Gurney1
1Department of Meteorology, University of Reading, Reading, UK
2Finnish Meteorological Institute, Arctic Research Centre, Sodankylä, Finland 3CORES Science and Engineering LTD, Burnopfield, UK
4WSL Institute of Snow and Avalanche Research, SLF, Davos, Switzerland Correspondence to: William Maslanka ([email protected])
Received: 27 November 2015 – Published in Geosci. Instrum. Method. Data Syst. Discuss.: 18 December 2015 Revised: 24 March 2016 – Accepted: 30 March 2016 – Published: 14 April 2016
Abstract. The Arctic Snow Microstructure Experiment (AS-MEx) took place in Sodankylä, Finland in the winters of 2013–2014 and 2014–2015. Radiometric, macro-, and mi-crostructure measurements were made under different ex-perimental conditions of homogenous snow slabs, extracted from the natural seasonal taiga snowpack. Traditional and modern measurement techniques were used for snow macro-and microstructure observations. Radiometric measurements of the microwave emission of snow on reflector and absorber bases were made at frequencies 18.7, 21.0, 36.5, 89.0, and 150.0 GHz, for both horizontal and vertical polarizations. Two measurement configurations were used for radiometric measurements: a reflecting surface and an absorbing base be-neath the snow slabs. Simulations of brightness temperatures using two microwave emission models, the Helsinki Univer-sity of Technology (HUT) snow emission model and Mi-crowave Emission Model of Layered Snowpacks (MEMLS), were compared to observed brightness temperatures. RMSE and bias were calculated; with the RMSE and bias values being smallest upon an absorbing base at vertical polariza-tion. Simulations overestimated the brightness temperatures on absorbing base cases at horizontal polarization. With the other experimental conditions, the biases were small, with the exception of the HUT model 36.5 GHz simulation, which produced an underestimation for the reflector base cases. This experiment provides a solid framework for future re-search on the extinction of microwave radiation inside snow.
1 Introduction
Snow is a vital component of the water cycle, and is critically important for meteorological and climatological studies due to its high albedo, high thermal emissivity, and thermal insu-lating properties (Cohen and Rind, 1991). In addition, over 1 billion people rely on snowmelt for their fresh water drinking supply (Barnett et al., 2005). To predict and monitor the evo-lution of potential snowmelt, continuous observations of key parameters such as snow water equivalent (SWE), height of snowpack (HS, as defined by Fierz et al., 2009), and snow extent (SE) are required throughout the year. While tradi-tional snow pit and automatic weather station observations are important, remote sensing observations of snow with pas-sive microwave radiometers are currently the only means in northern countries to provide vital global daily measure-ments of snow properties. As snow crystals act as scattering centres for upwelling microwave radiation, the size of the snow crystal, the radiation wavelength (and therefore its fre-quency), and the snow depth all play a role in dictating the amount of scattering present in a snowpack (Chang et al., 1987; Hallikainen et al., 1987).
regression coefficients, these empirical approaches were of-ten only valid for certain regional areas with poor inter-annual consistency (Derksen et al., 2003). Purely theoret-ical models for snow emission have also been developed (e.g. Tsang et al., 2000). However, these models tend to be very complex and due to the diversity of ancillary informa-tion required, their use in practical SWE retrieval from satel-lite observations is limited. Sitting between empirical and theoretical models are semi-empirical models; these combine radiative transfer theory with results from observations, ad-justing key model components empirically. Two commonly used semi-empirical models are the Helsinki University of Technology (HUT) snow emission model (Pulliainen et al., 1999; Lemmetyinen et al., 2010) and the Microwave Emis-sion Model of Layered Snowpacks (MEMLS, Wiesmann and Mätzler, 1999; Mätzler and Wiesmann, 1999).
Both the HUT snow emission model and MEMLS use snow parameters to describe the snowpack and snow mi-crostructure. These parameters include physical temperature, density, and some form of microstructure parameter. This mi-crostructure parameter (describing size, shape, orientation of snow grains) has a large effect on the observed brightness temperature (Foster et al., 1999; Armstrong et al., 1993) be-cause the intensity of scattered microwave radiation is di-rectly linked to snow microstructure (Chang et al., 1987). However, the amount of scattering, described by the scatter-ing coefficient in both the HUT snow emission model and MEMLS, is empirically defined based on observations (Pul-liainen et al., 1999; Wiesmann and Mätzler, 1999; Pan et al., 2015). However, MEMLS also includes an option to define the scattering coefficient purely on a physical basis (Mätzler and Wiesmann, 1999).
The Arctic Snow Microstructure Experiment (ASMEx) took place at the Arctic Research Centre of Finnish Mete-orological Institute (FMI-ARC) in Sodankylä, Finland in the winter seasons of 2013–2014 and 2014–2015. During the ASMEx, macro-, microstructure, and radiometric measure-ments of homogeneous snow slabs were made. The snow slabs were extracted from the natural seasonal taiga snow-pack. The radiometric measurements were made on two dif-ferent bases: one assumed perfect absorber and one perfect reflector. Observations of snow macro- and microstructure were made after radiometric measurements. The observed parameters were fed into the HUT snow emission model and MEMLS to produce simulated brightness temperatures. Only homogeneous slabs of dry snow were considered for microwave emission simulation. This was to avoid using wet snow in the radiometric measurements, as the dielectric prop-erties of dry and wet snow are very different. The real and
snow slabs extracted from the natural snowpack in FMI-ARC during ASMEx, and compares simulated and observed mi-crowave emission from the snow slabs. The ultimate aim of ASMEx is to improve the understanding of the microwave extinction processes within the snowpack, and their relation to microstructural properties of natural snow cover. This will enable to improve the precision of future and existing snow emission models.
2 Methods and models 2.1 Methods
2.1.1 Excavation of snow slabs
The snow slabs were extracted from the natural snowpack in the intense observation area (IOA) of the FMI-ARC that is situated in the clearing of a sparse pine forest, in Sodankylä, Finland. A snow sample of size 80×60 cm was mechani-cally removed from the snowpack. The thickness of these slabs varied typically between 14 and 19 cm, with the ex-ception of one slab, comprised of depth hoar, being approx-imately 5 cm thick. Snow slabs were taken from different depths within the snowpack, in order to capture a range of grain sizes and types. The snow slabs were taken at differ-ent periods during the two winters of ASMEx, to capture a wider range of grain sizes and types. Each of the snow slabs was extracted from a homogeneous layer, and its stratigraphy was manually assessed after the radiometric measurements.
Figure 1. Snow sample was taken from snowpack with a plastic frame, a metal plate and a saw, and a metal bottom plate surrounded by a plastic sheet.
on the slab surface. Immediately after extraction, the slabs were placed in front of the radiometer for brightness temper-ature measurements. A total of 14 samples were extracted in that manner.
2.1.2 Radiometric measurements
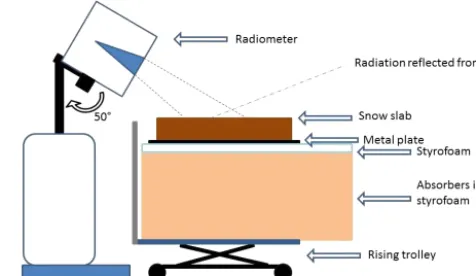
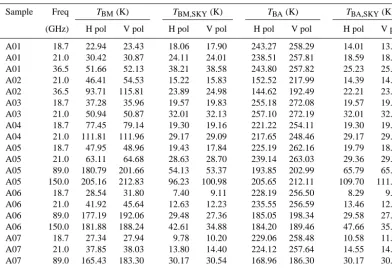
The microwave radiometric measurements were made with two RPG-XCH-DP Dicke Switch radiometers, installed on top of the radiometric tower in the IOA. The experimental set up of radiometric measurements is described in Fig. 2. Five different frequencies (18.7, 21.0, 36.5, 89.0, and 150.0 GHz) at both horizontal and vertical polarizations were used, al-though not all frequencies were working for all slabs. Ta-bles 1 and 2 detail the radiometric data collected from the ASMEx slabs in 2014 and 2015, respectively. The radiomet-ric measurements were made at an inclination angle of 50◦. Equivalent sky brightness temperatures were also made to measure the intensity of the downwelling radiation.
Radiometric measurements followed a comparable proce-dure as in Wiesmann et al. (1998). The first measurement was made with the snow slab on top of the reflective metal base. The metal base acts as a perfect reflector by reflect-ing the downwellreflect-ing emission of microwave radiation from the sky. Once the snow slab had been observed at all fre-quencies, sky measurements at an equivalent incidence an-gle were made. The metal plate was then carefully removed from the set up, so that the snow slab was upon the as-sumed perfect absorber. The radiometric measurements were then repeated. Emissivity tests of the absorbing material, us-ing the experimental setup in Fig. 2 without the snow slab and metal plate, proved that the assumption of a near-perfect blackbody was valid for all slab experiments, with the ex-ception of slabs B05 and B07. For these two slabs, the metal strips in the tape, used to hold the top-most piece of Sty-rofoam together, caused a reduction in brightness temper-ature at horizontal polarizations at different frequencies. A
Figure 2. Setup for radiometer measurements with a 50◦inclination angle.
correction (none at 18.7 GHz, −1 K at 21.0 GHz, −2 K at 36.5 GHz,−8 K at 89.0 GHz, and−15 K at 150.0 GHz) was applied to the absorbing base brightness temperature data for slabs B05 and B07.Throughout the radiometric measure-ments the physical temperatures of snow, air, and absorbing material were also measured for modelling purposes. 2.1.3 Measurements of snow macro- and
microstructure
Once the radiometric measurements had been completed, the destructive sampling of the physical parameters of snow macro- and microstructure took place. Initially, the stratig-raphy of the slab was observed using the SnowMicroPen (SMP; Schneebeli and Johnson, 1998 and Schneebeli et al., 1999). The SMP uses a sensitive piezoelectric force sensor on top of a penetrative rod, which is capable of detecting changes in penetrative resistance at a high resolution (4 µm). A total of 12 SMP profiles were taken across each slab to assess the stratigraphy and homogeneity. The nominal loca-tions of the SMP profiles, as well as all other macro- and microstructure measurements, are shown in Fig. 3. From the SMP profiles, it is possible to detect layers as well as pro-duce profiles of density, correlation length, and specific sur-face area (SSA) of the snow (Proksch et al., 2015). For the purposes of this experiment, nine slabs (eight dry and one wet) could be considered homogeneous, with minimal hor-izontal and vertical features. The other five slabs exhibited significant vertically layered structures, and contained tures such as ice crusts within the snow. These internal fea-tures would produce additional scattering and internal reflec-tions that would be difficult to quantify in the models for simulation.
(GHz) H pol V pol H pol V pol H pol V pol H pol V pol
A01 18.7 22.94 23.43 18.06 17.90 243.27 258.29 14.01 13.24
A01 21.0 30.42 30.87 24.11 24.01 238.51 257.81 18.59 18.74
A01 36.5 51.66 52.13 38.21 38.58 243.80 257.82 25.23 25.51
A02 21.0 46.41 54.53 15.22 15.83 152.52 217.99 14.39 14.85
A02 36.5 93.71 115.81 23.89 24.98 144.62 192.49 22.21 23.39
A03 18.7 37.28 35.96 19.57 19.83 255.18 272.08 19.57 19.83
A03 21.0 50.94 50.87 32.01 32.13 257.10 272.19 32.01 32.13
A04 18.7 77.45 79.14 19.30 19.16 221.22 254.11 19.30 19.16
A04 21.0 111.81 111.96 29.17 29.09 217.65 248.46 29.17 29.09
A05 18.7 47.95 48.96 19.43 17.84 225.19 262.16 19.79 18.51
A05 21.0 63.11 64.68 28.63 28.70 239.14 263.03 29.36 29.46
A05 89.0 180.79 201.66 54.13 53.37 193.85 202.99 65.79 65.02
A05 150.0 205.16 212.83 96.23 100.98 205.65 212.11 109.70 111.87
A06 18.7 28.54 31.80 7.40 9.11 228.19 256.50 8.29 9.87
A06 21.0 41.92 45.64 12.63 12.23 235.55 256.59 13.46 12.77
A06 89.0 177.19 192.06 29.48 27.36 185.05 198.34 29.58 27.76
A06 150.0 181.88 188.24 42.61 34.88 184.20 189.46 47.66 35.22
A07 18.7 27.34 27.94 9.78 10.20 229.06 258.48 10.58 11.00
A07 21.0 37.85 38.03 13.80 14.40 224.12 257.64 14.55 14.59
A07 89.0 165.43 183.30 30.17 30.54 168.96 186.30 30.17 30.54
A07 150.0 175.07 186.75 45.36 39.93 174.46 187.88 45.36 39.93
Figure 3. Approximate locations of the macro- and microstructure measurements in the snow slab. Individual SMP and micro-CT mea-surement locations are also depicted.
The SSA of the snow slab was measured at two different locations in a vertical profile with 3 cm intervals. The tradi-tional grain size,E, is defined by Fierz et al. (2009) as largest extent of an average grain. In this study, post-processed vi-sual estimation of traditional grain size was made from the macrophotographs to improve repeatability of the estimation. Snow grains from the SSA samples were collected and
sep-arated upon a 1 mm reference grid for macrophotography, in order to have profiles of traditional grain size and SSA from the same location. Traditional grain size was estimated visu-ally from macrophotographs with 0.25 mm resolution.
Snow samples were taken from the centre of the radiome-ter footprint to be scanned with microcomputed tomogra-phy (micro-CT) apparatus. The cast samples were analysed via three-dimensional x-ray tomography in WSL Institute of Snow and Avalanche Research, SLF, Switzerland, to produce a three dimensional image of the snow (Heggli et al., 2009). From this image, it is possible to measure many important microstructural parameters, especially a vertically highly re-solved profile of density and correlation length.
In addition to the different number of microstructural mea-surements of the snow slab, vertical profiles of physical tem-perature and density took place in other locations within the slab with a vertical resolution of 5 cm. The density profiles were made using a density cutter with a volume of 500 cm3. 2.2 Models
2.2.1 Helsinki University of Technology snow emission model
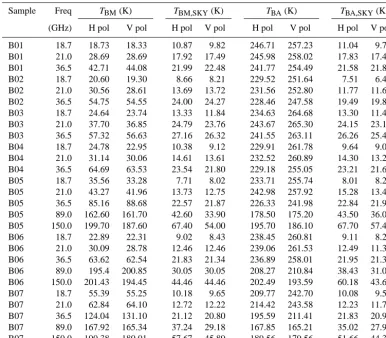
Table 2. Radiometric data measured from the 2015 ASMEx slabs (horizontal/vertical polarization). Brightness temperatures from reflective base (TBM), sky after reflective base measurements (TBM,SKY), absorbing base (TBA), and sky after absorbing base measurements (TBA,SKY) are presented.
Sample Freq TBM(K) TBM,SKY(K) TBA(K) TBA,SKY(K)
(GHz) H pol V pol H pol V pol H pol V pol H pol V pol
B01 18.7 18.73 18.33 10.87 9.82 246.71 257.23 11.04 9.74
B01 21.0 28.69 28.69 17.92 17.49 245.98 258.02 17.83 17.46
B01 36.5 42.71 44.08 21.99 22.48 241.77 254.49 21.58 21.81
B02 18.7 20.60 19.30 8.66 8.21 229.52 251.64 7.51 6.49
B02 21.0 30.56 28.61 13.69 13.72 231.56 252.80 11.77 11.65
B02 36.5 54.75 54.55 24.00 24.27 228.46 247.58 19.49 19.86
B03 18.7 24.64 23.74 13.33 11.84 234.63 264.68 13.30 11.48
B03 21.0 37.70 36.85 24.79 23.76 243.67 265.30 24.15 23.13
B03 36.5 57.32 56.63 27.16 26.32 241.55 263.11 26.26 25.41
B04 18.7 24.78 22.95 10.38 9.12 229.91 261.78 9.64 9.03
B04 21.0 31.14 30.06 14.61 13.61 232.52 260.89 14.30 13.29
B04 36.5 64.69 63.53 23.54 21.80 229.18 255.05 23.21 21.67
B05 18.7 35.56 33.28 7.71 8.02 233.71 255.74 8.01 8.29
B05 21.0 43.27 41.96 13.73 12.75 242.98 257.92 15.28 13.40
B05 36.5 85.16 88.68 22.57 21.87 226.33 241.98 22.84 21.94
B05 89.0 162.60 161.70 42.60 33.90 178.50 175.20 43.50 36.00
B05 150.0 199.70 187.60 67.40 54.00 195.70 186.10 67.70 57.40
B06 18.7 22.89 22.31 9.02 8.43 238.45 260.81 9.11 8.27
B06 21.0 30.09 28.78 12.46 12.46 239.06 261.53 12.49 11.37
B06 36.5 63.62 62.54 21.83 21.34 236.89 258.01 21.95 21.39
B06 89.0 195.4 200.85 30.05 30.05 208.27 210.84 38.43 31.09
B06 150.0 201.43 194.45 44.46 44.46 202.49 193.59 60.18 43.68
B07 18.7 55.39 55.25 10.18 9.65 209.77 242.70 10.08 9.50
B07 21.0 62.84 64.10 12.72 12.22 214.42 243.58 12.23 11.74
B07 36.5 124.04 131.10 21.12 20.80 195.59 211.41 21.83 20.91
B07 89.0 167.92 165.34 37.24 29.18 167.85 165.21 35.02 27.93
B07 150.0 190.38 180.01 57.67 45.89 189.56 179.56 51.66 44.31
transfer approach to model the microwave brightness temper-ature. It is capable of treating the snow as a single homoge-neous layer (Pulliainen et al., 1999) or as a series of homo-geneous layers (Lemmetyinen et al., 2010), with the layers being defined by its physical temperature, density, observed grain diameter, and SWE.
The model’s basic assumption is that the microwave ra-diation is scattered mostly in the forward direction, which allows simplifying the radiative transfer equation to a sin-gle flux. Calculation of the absorption coefficient in the HUT model is based on empirical models by Mätzler (1987); while the total extinction coefficient (sum of absorption and scatter-ing coefficients) was originally calculated by Hallikainen et al. (1987) from observations of natural snow slabs collected in southern Finland. The extinction coefficients calculated by Hallikainen et al. (1987) is valid between 18 and 90 GHz. Calculation of the total extinction coefficient was originally based on the mean observed grain size (Table 1, Hallikainen et al., 1987), which can be interpreted to be close to the tradi-tional measure of grain size,E(Fierz et al., 2009). However, an effective grain sizeDeff, i.e. the grain size value that
cor-responds to the total scattering effects from the snowpack, was later introduced by Kontu and Pulliainen (2010) to alle-viate large errors arising from the use ofEin model simu-lations. According to Kontu and Pulliainen (2010), effective grain size and traditional grain size are related by
Deff=
1−e−1.5E. (1)
Other extinction coefficient relationships exist for the HUT model (Roy et al., 2004; Kontu and Pulliainen, 2010), but these have not been used here. A possible reason for discrep-ancies noted by both Kontu and Pulliainen (2010) as well as Roy et al. (2004) for coarse grained snow is that mea-suredEin the data set by Hallikainen et al. (1987) extended only up to 1.6 mm. The extinction coefficient model may thus not hold forE >1.6 mm.
de-MEMLS (Wiesmann and Mätzler, 1999; Mätzler and Wies-mann, 1999) is also based on radiative transfer theory, treat-ing the snowpack as a stack of horizontal layers, with each layer being characterized by its depth, physical temperature, density, and exponential correlation length. Although expo-nential correlation length Pex was not directly measured,
it can be calculated via measurements of density (Mätzler, 2002) and SSA (Toure et al., 2008), such that:
Pex=
31−ρsnow
ρice
SSA (2)
whereρsnowis the density of snow, andρiceis the density of ice (917 kg m−3).
These data are used to calculate absorption and scattering coefficients within the snow, as well as transmissivity and re-flectivity between adjacent snow layers. A two-flux (up- and downwelling) model is used to calculate the emitted bright-ness temperature at the top of the snowpack. However, the absorption and scattering coefficients are adjusted with six flux coefficients (up- and downwelling, and four horizon-tal directions). The scattering coefficient was empirically de-fined from radiometric and macro- and microstructure mea-surements as laid out by Wiesmann et al. (1998) and it is valid between 10 and 100 GHz. An optional feature, originally im-plemented for coarse-grained snow with a large correlation length, is to use the improved Born approximation (Mätzler and Wiesmann, 1999) for the calculation of the scattering co-efficient.
3 Results
3.1 Macro- and microstructure observations
Preliminary analyses of snow macro- and microstructure measurements include slab thickness, physical temperature, density, SSA, grain sizeE, and homogeneity.Eranged from 0.5 to 2.0 mm, average slab densities ranged from 130 to 340 kg m−3, and physical snow temperature ranged from
−14 to 0◦C. The variability of snow characteristics and ho-mogeneity from all 14 slabs are shown in Table 3. Bulk aver-ages and standard deviations of micro-CT-derived SSA and density values are given in Table 4. Locally calibrated bulk averages and standard deviations of SMP-derived SSA and density values are given in Table 5.
3.2 Comparison of snow emission models
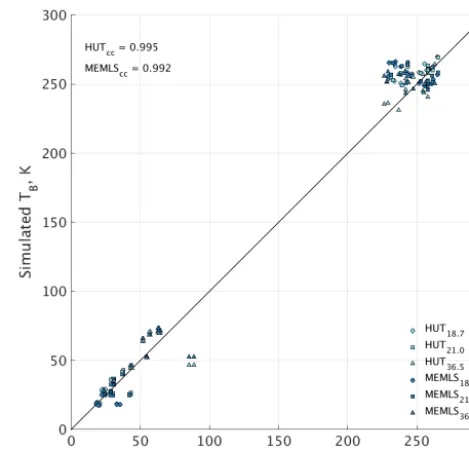
The parameters from the eight dry homogeneous slabs in Ta-ble 3 were fed into both the single-layer HUT snow
emis-Figure 4. HUT (light blue) and MEMLS (dark blue) simulated brightness temperatures plotted against observed brightness temper-atures at 18.7 (circle), 21.0 (square), and 36.5 GHz (triangle). The correlation coefficients of the single-layer HUT model (HUTCC) and MEMLS (MEMLSCC) are also displayed.
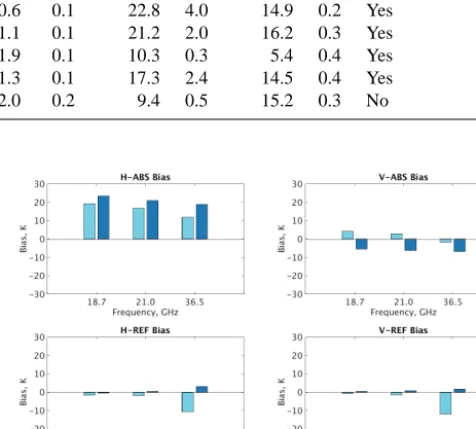
sion model and into MEMLS to produce simulated bright-ness temperatures. The ground layer in both of the models was modified to simulate the absorbing and reflecting bases by altering the reflecting properties of the ground, to model the reflective properties of the metal plate (r=1) and the ab-sorbing base (r=0). The absorbing and reflective bases were simulated assuming a near-perfect absorption and reflection at the snow-base interface. The directly measured down-welling sky contribution was applied as the downdown-welling flux in both models. The simulated brightness temperatures at 18.7, 21.0, and 36.5 GHz were compared to the observed brightness temperatures, as shown in Fig. 4, and the 2-D correlation coefficient for each model was calculated. The RMSE and bias values were calculated for each base simula-tion, at both horizontal and vertical polarizations. The RMSE and bias at the two higher frequencies (89.0 and 150.0 GHz) were not calculated for this study. Figure 5 shows the RMSE values and Fig. 6 shows the bias values of the simulations.
The values in Fig. 5 show that for the absorbing base, the HUT model simulations tend to have smaller RMSE val-ues than MEMLS, while for the reflective base simulations the RMSE values are comparable at 18.7 and 21.0 GHz. At 36.5 GHz the HUT snow emission model produces larger RMSE values than MEMLS. The RMSE values for the ab-sorbing base of vertical polarization (V-ABS) are the small-est.
Table 3. Averaged results from macro- and microstructure measurements. It should be noted that slab A03 was wet, so was not considered for model simulation.
Date Slab Temperature Density Grain size SSA Thickness Homogenous
ref. (◦C) (kg m−3) (mm) (m2kg−1) (cm)
Bulk SD Bulk AD Bulk SD Bulk SD Bulk SD
avg. avg. avg. avg. avg.
13 Jan 2014 A01 −13.1 0.1 135.5 28.4 0.5 0.1 35.8 6.3 17.8 0.8 Yes
14 Jan 2014 A02 −22.2 0.4 264.2 21.6 0.7 0.2 15.4 5.6 15.6 0.4 No
11 Feb 2014 A03 −0.3 0.4 227.7 41.9 0.6 0.2 18.0 4.5 16.6 0.5 Yes
13 Feb 2014 A04 −0.5 0.4 225.7 41.9 0.9 0.3 11.3 2.3 18.0 0.5 No
3 Mar 2014 A05 −0.8 0.1 286.7 36.5 0.9 0.2 15.8 3.7 15.6 0.4 No
18 Mar 2014 A06 −7.6 0.7 280.0 14.9 0.8 0.2 17.5 2.7 14.8 0.7 Yes
20 Mar 2014 A07 −5.1 3.5 284.8 15.2 0.9 0.1 15.5 2.6 14.8 0.3 No
2 Feb 2015 B01 −13.2 0.9 139.5 23.9 0.5 0.1 36.4 5.9 14.8 0.3 Yes
5 Feb 2015 B02 −10.9 0.2 160.3 34.1 0.5 0.1 36.4 8.0 13.9 0.2 Yes
19 Feb 2015 B03 −2.6 0.4 234.0 24.0 0.6 0.1 22.8 4.0 14.9 0.2 Yes
11 Mar 2015 B04 −5.4 0.2 268.2 26.3 1.1 0.1 21.2 2.0 16.2 0.3 Yes
12 Mar 2015 B05 −3.2 0.5 337.5 9.0 1.9 0.1 10.3 0.3 5.4 0.4 Yes
24 Mar 2015 B06 −5.4 0.3 315.0 17.5 1.3 0.1 17.3 2.4 14.5 0.4 Yes
25 Mar 2015 B07 −3.7 0.4 282.5 17.1 2.0 0.2 9.4 0.5 15.2 0.3 No
Figure 5. Simulated brightness temperature RMSE at horizon-tal (H) and vertical (V) polarizations for the absorber material base (ABS) and the reflective metal plate base (REF). Eight slabs were simulated at 18.7 and 21.0 GHz, while seven slabs were simu-lated at 36.5 GHz.
small magnitude (<|2 K|) biases. At 36.5 GHz, the HUT model is negatively biased and MEMLS is slightly positively biased. It suggests that the HUT model underestimated the microwave emission while MEMLS slightly overestimated it at 36.5 GHz on the reflective base cases. The bias for the absorbing base of horizontal polarization (H-ABS) was pos-itive regardless of model or frequency. The bias for the V-ABS simulations (<|6 K|) was negative for all frequencies with MEMLS, and with HUT model positive at 18.7 and 21.0 GHz, and slightly negative at 36.5 GHz.
The larger magnitude bias in the REF situations in the single-layer HUT simulations can be attributed to the way
Figure 6. Simulated brightness temperature bias at horizontal (H) and vertical (V) polarizations for the absorber material base (ABS) and the reflective metal plate base (REF). Eight slabs were sim-ulated at 18.7 and 21.0 GHz, while seven slabs were simsim-ulated at 36.5 GHz.
Slab Bulk SD Bulk SD Bulk SD Bulk SD
ref. avg. avg. avg. avg.
A01 29.3 4.3 29.9 4.3 95.6 40.7 91.3 35.9
A02 X X 13.1 4.3 X X 250.0 65.7
A03 16.2 5.2 16.6 5.5 202.4 48.5 198.6 45.6
A04 9.3 2.0 9.4 2.2 311.9 62.1 308.2 64.5
A05 9.9 3.7 9.8 2.4 285.0 62.7 283.4 47.6
A06 12.7 2.2 12.9 2.2 277.0 28.6 270.7 29.7
A07 10.6 2.2 10.9 1.2 288.6 86.8 270.1 25.4
B01 27.0 4.0 28.0 3.9 136.7 54.4 147.0 52.7
B02 24.7 3.6 26.0 3.7 189.3 62.5 176.5 60.2
B03 16.6 1.4 16.6 1.3 249.8 34.0 253.7 35.1
B04 16.2 2.4 15.8 2.3 267.8 40.4 272.2 39.7
B05 8.2 1.1 8.5 0.3 321.1 69.3 318.5 43.8
B06 12.7 1.0 12.8 1.0 319.1 32.5 318.7 24.0
B07 7.8 0.7 8.1 0.7 325.7 42.2 289.2 36.3
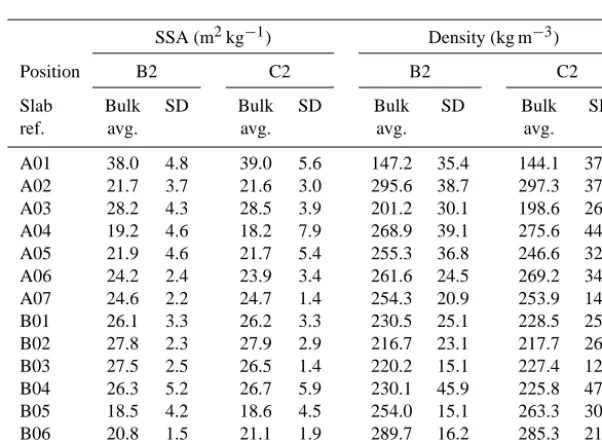
Table 5. Locally calibrated SMP-derived bulk average and standard deviation values of SSA and density. The values for B2 and C2 correspond to positions B2 and C2 in Fig. 3.
SSA (m2kg−1) Density (kg m−3)
Position B2 C2 B2 C2
Slab Bulk SD Bulk SD Bulk SD Bulk SD
ref. avg. avg. avg. avg.
A01 38.0 4.8 39.0 5.6 147.2 35.4 144.1 37.9
A02 21.7 3.7 21.6 3.0 295.6 38.7 297.3 37.6
A03 28.2 4.3 28.5 3.9 201.2 30.1 198.6 26.5
A04 19.2 4.6 18.2 7.9 268.9 39.1 275.6 44.8
A05 21.9 4.6 21.7 5.4 255.3 36.8 246.6 32.9
A06 24.2 2.4 23.9 3.4 261.6 24.5 269.2 34.6
A07 24.6 2.2 24.7 1.4 254.3 20.9 253.9 14.7
B01 26.1 3.3 26.2 3.3 230.5 25.1 228.5 25.8
B02 27.8 2.3 27.9 2.9 216.7 23.1 217.7 26.8
B03 27.5 2.5 26.5 1.4 220.2 15.1 227.4 12.3
B04 26.3 5.2 26.7 5.9 230.1 45.9 225.8 47.6
B05 18.5 4.2 18.6 4.5 254.0 15.1 263.3 30.0
B06 20.8 1.5 21.1 1.9 289.7 16.2 285.3 21.2
B07 23.2 5.9 21.8 4.5 256.7 54.3 267.0 38.9
The doubling of the snow thickness also reduces the errors introduced by slab B05 (initial thickness 5.4 cm), as the small thickness is not enough for scattering to be correctly simu-lated. Additional errors will be introduced, due to the slight changes in the snow density and microstructural parameter that were not recorded by the traditional observations, due to the coarse resolution of the method (vertical profile of 3– 5 cm). There were variations in density and SSA that were
recorded by the micro-CT and SMP observations, but were not recorded with the traditional observation techniques.
4 Summary
Brightness temperatures of the homogeneous snow slabs were simulated with the HUT snow emission model and with MEMLS. Results of the comparison of simulations and ob-servations are described in Sect. 3.2. The HUT model pro-duced smaller RMSE across all three frequencies for the sim-ulations upon an absorbing base. The reflective base simu-lations produced RMSE values that were comparable with the HUT model and MEMLS at 18.7 and 21.0 GHz. Both models overestimated the brightness temperature at H-ABS, and at V-ABS the single-layer HUT model slightly overes-timated the brightness temperature while MEMLS underes-timated it. Both models produced very small biases for the reflective base cases, with the exception of the HUT model at 36.5 GHz.
The RMSE and bias is influenced by internal extinction processes within the snow slabs, which are imperfectly sim-ulated by the model physics. The relatively high errors, espe-cially at H pol, considering the highly controlled measure-ment setup, highlight the requiremeasure-ment for further develop-ment of the models, as well as the need to better quantify the snow microstructural properties themselves. These prelimi-nary brightness temperature simulations will be repeated in the future using the physical snow properties collected by the modern techniques including SMP and micro-CT measure-ments. Ultimately, a revised extinction model will be created for the HUT snow emission model, and implemented with the aim to improve the model inversions of SWE from radio-metric measurements of microwave emission. This revised extinction coefficient, based on the data collected during the ASMEx campaign, will be a function of microstructural pa-rameter and frequency.
Author contributions. Juha Lemmetyinen, Mel Sandells, and Martin Schneebeli planned the experiment with help of William Maslanka. William Maslanka had the main responsibility in organizing and carrying out the measurements. Leena Leppänen had the responsibility of organizing measurements as the local operator, including implementation of measurement setup and participation to measurement procedure. Anna Kontu and Henna-Reetta Hannula participated in the experimental measurements. William Maslanka conducted data processing and simulations. Margret Matzl provided the micro-CT data set. Martin Proksch provided the SMP analysis. William Maslanka and Leena Leppänen prepared the manuscript with contributions from all co-authors.
Acknowledgements. We thank the staff of FMI Arctic Research Centre in Sodankylä for performing the ground-based radiometer measurements and macro- and microstructure measurements. We also thank the staff of WSL Institute of Snow and Avalanche Re-search SLF for the SMP instrument and for the SMP and micro-CT analyses of the snow samples. The manuscript preparation was supported by the EU 7th Framework Program project “European– Russian Centre for cooperation in the Arctic and Sub-Arctic envi-ronmental and climate research” (EuRuCAS, Grant no. 295068).
Edited by: C. Ménard
References
Amlien, J.: Remote Sensing of Snow with Passive Microwave Ra-diometers – A review of current algorithms, Report 1019, Norsk Regnesentral, Oslo, 1–52, 2008.
Armstrong, A., Chang, A., Rango, A., and Josberger, E.: Snow depths and grain-size relationships with relevance for passive mi-crowave studies, Ann. Glaciol., 17, 171–176, 1993.
Barnett, T. P., Adam, J. C., and Lettenmaier, D. P.: Potential Impacts of a Warming Climate on Water Availability in Snow-Dominated Regions, Nature, 438, 303–309, 2005.
Chang, A. T. C., Foster, J. L., and Hall, D. K.: Nimbus-7 SMMR derived global snow parameters, Ann. Glaciol., 9, 39–44, 1987. Cohen, J. and Rind, D.: The effect of snow cover on the climate, J.
Climate, 4, 689–706, 1991.
Derksen, C., Walker, A., and Goodison, B.: A comparison of 18 winter seasons of in situ and passive microwave derived snow water equivalent estimates in Western Canada, Remote Sens. En-viron., 88, 271–282, 2003.
Fierz, C., Armstrong, R. L., Durand, Y., Etchevers, P., Greene, E., McClung, D. M., Nishimura, K., Satyawali, P. K., and Sokra-tov, S. A.: The International Classification for Seasonal Snow on the Ground, IHP-VII Technical Documents in Hydrology No. 83, IACS Contribution No. 1, UNESCO-IHP, Paris, 1–90, 2009. Foster, J., Hall, D., Chang, A., Rango, A., Wergin, W., and Erbe,
E.: Effects on snow crystal shape on the scattering of passive microwave radiation, IEEE T. Geosci. Remote, 37, 1165–1168, 1999.
Gallet, J.-C., Domine, F., Zender, C. S., and Picard, G.: Measument of the specific surface area of snow using infrared re-flectance in an integrating sphere at 1310 and 1550 nm, The Cryosphere, 3, 167–182, doi:10.5194/tc-3-167-2009, 2009. Hallikainen, M.: Microwave Radiometry of Snow, Adv. Space Res.,
9, 267–275, 1989.
Hallikainen, M., Ulaby, F., and Van Deventer, T.: Extinction Be-haviour of Dry Snow in the 18- to 90-GHz Range, IEEE T. Geosci. Remote, 25, 737–745, 1987.
Heggli, M., Frei, M., and Schneebeli, M.: Snow replica method for three-dimensional X-ray microtomography imaging, J. Glaciol., 55, 631–639, 2009.
Hollinger, J., Peirce, J., and Poe, G.: SSM/I Instrument Evaluation, IEEE T. Geosci. Remote, 28, 781–790, 1990.
Kelly, R., Chang, A., Tsang, L., and Foster, J.: A Prototype AMSR-E Global Snow Area and Snow Depth Algorithm, IAMSR-EAMSR-EAMSR-E T. Geosci. Remote, 41, 230–242, 2003.
Kontu, A. and Pulliainen, J.: Simulation of spaceborne microwave radiometer measurements of snow cover using in situ data and brightness temperature modelling, IEEE T. Geosci. Remote, 48, 1031-1044, 2010.
Künzi, F., Patil, S., and Rott, H.: Snow-cover parameters retrieved from Nimbus-7 Scanning Multi-channel Microwave Radiome-ter (SMMR) data, IEEE T. Geosci. Remote, 20, 452–467, 1982. Legagneux, L., Cabanes, A., and Dominé, F.: Measurement of
Mätzler, C.: Relation between grain-size and correlation length of snow, J. Glaciol., 48, 461–466, 2002.
Mätzler, C. and Wiesmann, A.: Extension of the Microwave Emis-sion Model of Layered Snowpacks to Coarse-Grained Snow, Re-mote Sens. Environ., 70, 317–325, 1999.
Pan, J., Durand, M., Sandells, M., Lemmetyinen, J., Kim, E., Pul-liainen, J., Kontu, A., and Derksen, C.: Differences between the HUT Snow Emission Model and MEMLS and Their Effects on Brightness Temperature Simulation, IEEE T. Geosci. Remote, 99, 1–19, 2015.
Proksch, M., Löwe, H., and Schneebeli, M.: Density, specific sur-face area, and correlation length of snow measured by high-resolution penetrometry, J. Geophys. Res.-Earth, 120, 346–362, 2015.
Pulliainen, J., Grandell, J., and Hallikainen, M.: HUT snow emis-sion model and its applicability to snow water equivalent re-trieval, IEEE T. Geosci. Remote, 37, 1378–1390, 1999. Roy, V., Goita, K., Royer, A., Walker, A., and Goodson, B.: Snow
Water Equivalent Retrieval in a Canadian Boreal Environment from Microwave Measurements using the HUT Snow Emission Model, IEEE T. Geosci. Remote, 42, 1850–1859, 2004.
Stiles, W. and Ulaby, F.: Dielectric properties of snow, Technical Report 527-1, The University of Kansas Center for Research, Inc. Remote Sensing Laboratory, Lawrence, Kansas, 93–103, 1981.
Takala, M., Luojus, K., and Pulliainen, J.: Estimating North-ern Hemisphere Snow Water Equivalent for Climate Research through Assimilation of Space-Borne Radiometer Data and Ground-Based Measurements, Remote Sens. Environ., 15, 3517– 3529, 2011.
Toure, A., Goite, K., Royer, A., Mätzler, C., and Schneebeli, M.: Near-infrared digital photography to estimate snow correlation length for microwave emission modelling, Appl. Optics, 48, 1– 11, 2008.
Tsang, L., Chen, C.-T., Chang, A., Guo, J., and Ding, K.-H.: Dense media radiative transfer theory based on quasicrystalline approx-imation with application to passive microwave remote sensing of snow, Radio Sci., 35, 731–749, 2000.
Wiesmann, A. and Mätzler, C.: Microwave Emission Model of Lay-ered Snowpacks, Remote Sens. Environ., 70, 307–316, 1999. Wiesmann, A., Mätzler, C., and Weise, T.: Radiometric and