AUT J. Mech. Eng., 1(2) (2017) 169-178 DOI: 10.22060/mej.2017.12574.5371
Analysis and Optimization of Mining Truck Operation Based on the Driver Whole
Body Vibration
M. J. Rahimdel1, M. Mirzaei2*, J. Sattarvand1, Ho. Mirzaei Nasirabad1 1 Department of Mining Engineering, Sahand University of Technology, Tabriz, Iran
2 Department of Mechanical Engineering, Sahand University of Technology, Tabriz, Iran
ABSTRACT: The present paper studies the whole body vibration of a three-axle dump truck during various operational conditions in Zonuz Kaolin Mine of Iran. At first, the root mean square of vibrations at different speeds, as well as in payloads and distribution qualities of materials in the truck dump body and also on different haul road qualities are experimentally obtained. Then, the vibrational health risk in all operational conditions is statistically analyzed based on ISO 2631-1 standard. As a result of this analysis, an optimization problem is constructed and solved to obtain the optimum operating conditions of the truck. In the proposed problem, at first, regression analysis in terms of RMS of vibrations and truck speed is applied. Then, the total RMS at the consequential working phases of the truck is minimized in the presence of some constraints related to the health risk and productivity levels. Solving the proposed constrained optimization problem determines the optimum payload and truck speed in various conditions to keep materials hauling at the lowest possible vibrational health risk level while the mine productivity at the planned level remains.
Review History:
Received: 25 February 2017 Revised: 17 April 2017 Accepted: 5 July 2017
Available Online: 11 September 2017
Keywords:
Mining truck Whole body vibration Non-linear optimization Operational conditions Zonuz Kaolin Mine
1- Introduction
Machinery vibration passing from the seat to the buttocks and supporting areas causes Whole Body Vibration (WBV) which leads to adverse effects on health and comfort. Operators of mining machinery are exposed to the high levels of WBV. Long time exposure to WBV causes a backache and has non-ergonomic effects on the human’s body [1]. Exposure levels of WBV have already evaluated in many studies for different vehicles such as haul trucks [2-8], Load Haul Dumps (LHDs) [9-10], shovels [11], loaders [12-15] and drilling machines [16-17]. Mining trucks usually operate at the various working phases and also in different haul road conditions. While other vehicles have a very short movement in their working place. Therefore, mining trucks are in the highly dangerous level of vibrational health risk.
Smets et al. [3] measured WBV of eight haulage trucks with 35, 100, and 150-ton capacities using the field data. The results revealed that the truck operators were typically exposed to moderate through a high level of WBV risk. Also, the truck type had no significant effect on the RMS of vertical vibrations. In this research, the interaction between speed, road roughness and the vibration magnitude and their effects on the WBV were not discussed. Frimpong et al. [4] studied vibrations in high-impact shovel loading operations (HISLO) transmitted into truck cabin using a 3D dynamic model in MSC.ADAMS software. The results of this research showed that the maximum vibrations in the loading period occur at the first and second loading passes. Therefore, they proposed that the vibration control in the first two passes of loading operation is important.
Rahimdel et al. [6-7] simulated the vibrational health risk of
a mining truck in different conditions using the TruckSim software. The simulation results indicated that the haul road quality, truck speed, and the materials distribution quality had significant effects on the RMS of vertical vibrations. In another study, Sattarvand et al. [8] studied WBV of the 3-axle truck driver in the Zonuz Kaolin Mine of Iran. In this study, the artificial neural network was used to predict the vibrational health risk level. The results showed that the uniform loads or materials accumulated on the rear side of the truck dump body did not have any significant effect on the vibrational health risk. Moreover, in the use of the proposed neural network, there was a good agreement between the observed and predicted RMS values. However, practical approaches to reducing the vibrational health risk of the driver were not proposed in this study. Mandal et al. [11] measured WBV of 66 dump trucks in ten open pit mines of India according to ISO 2631-1 standard. Results of this study showed that 26% of dump trucks were in the high health risk. While, 54% and 20% of trucks had a moderate and low health risk, respectively. In the other study, the WBV exposure of 32 haul trucks was measured [18]. The RMS of vertical acceleration for 12 trucks were in the low health risk level. However, haul road conditions considered by field observations had a large effect on the vertical vibrations.
of real vibrational data in all conditions. The collected data are statistically analyzed to evaluate the effects of different operational conditions on the vibrational health risk of the truck. As a result of the vibration analysis, an optimization problem is constructed and solved to obtain the optimum operating conditions for the truck. In the proposed problem, at first, a regression analysis in terms of RMS of vibrations and truck speed is applied to obtain RMS functions at different working phases of the truck. Then, the performance index is defined as total RMS at the consequential working phases of the truck containing loading, transporting from loading to dumping area, dumping and returning to the loading area. The defined performance index should be minimized in the presence of some constraints related to health risk and productivity levels as well as a physical limitation on payload and speed. Solving the proposed constrained optimization problem determines the optimum payload and truck speed in the various conditions to keep materials hauling at the lowest possible vibrational health risk level while remaining the mine productivity at the planned level. Results of this paper provide applied approaches to drive the trucks in a similar class with a low health risk level. Also, this paper will be helpful for future researchers and designers to represent the practical solutions for health risk reduction of mining trucks in the various conditions.
The rest of the paper is organized as follows. In section 2, the analysis of the WBV and the health risk level of vibrations are presented according to ISO 2631-1 standard. In section 3, operational conditions and data collection procedure in Zonuz Kaolin Mine are discussed. In section 4, the collected data are statistically analyzed and the best RMS functions in the various operational conditions are obtained using regression analysis. Finally, in section 5, a non-linear constrained optimization problem of vibrations are formulated and solved to propose the optimum operational conditions.
2- Whole Body Vibration Analysis
ISO 2631-1 is the most popular standard for measurement and evaluation of the human’s WBV. ISO 2631-1 applies two main criteria for describing acceleration amplitude; the frequency-weighted RMS (awrms) and vibration dose value (VDV) as follows [19]:
2 0 1 T ( )
wrms w
a a t dt
T
=
∫
(1)4 4
0 ( ) T
w
VDV =
∫
a t dt (2)where, T is the measurement duration and aw(t) is the frequency-weighted acceleration at time t. In practice, prior
defines “Health Guidance Caution Zone, (HGCZ)” according to Fig. 1. In practice, the exposures below, within and above the HGCZ are usually considered as low, moderate and high health risk, respectively. For an eight-hour daily exposure, the upper and lower bounds of HGCZ are 0.47 m/s2 and 0.93 m/s2, respectively, based on the RMS. The corresponding values for the VDV measure are 8.5 m/s1.75 and 17 m/s1.75 [20].
Also, ISO 2631-1 defines the Crest Factor (CF) as the ratio of the maximum instantaneous peak value of the aw(t) to its RMS value [19]:
max( ( )) ( ) w
w a t CF
RMS a
= (4)
If the CF exceeds nine, vibration effects on the driver’s body may not be estimated. In this condition, the VDV is used for the evaluation and prediction of the health risk.
3- Operational Conditions and Field Data Gathering- Case Study
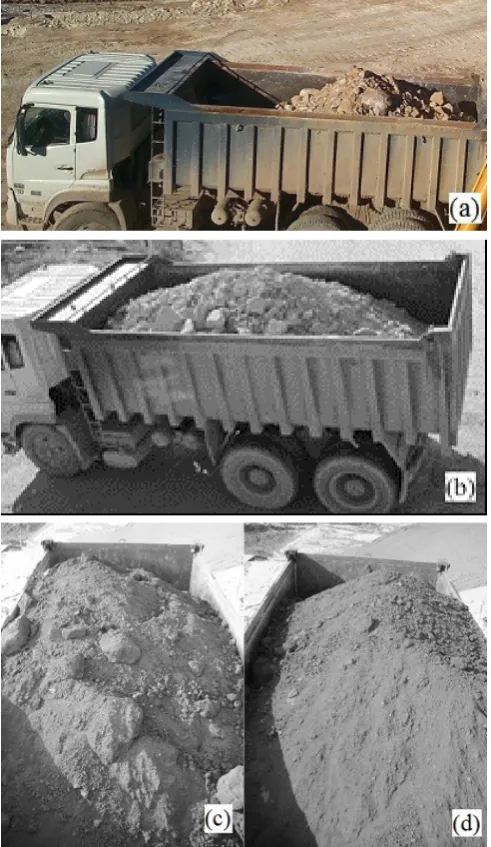
Data collection was conducted in the Zonuz Kaolin Mine, Iran. This mine is located at the distance of 20 km from Marand City in East Azerbaijan province, Iran. Geological resource of mine has been estimated as 31.5 million tons and it is the biggest kaolin mine of Iran. The distance between the loading area and dumping area in the mineral processing plant is about 10 km. There are 20 active trucks on average in this mine. A three-axle truck selected for experimental test and data collection is shown in Fig. 2.
Operational data of the case study truck is given in Table 1. According to Table 1, each work cycle, including loading, transporting with load, dumping and returning phases is completed at (5+3+25+20+24=) 77 minutes or 1.28 hours. Moreover, the mine is active for nine hours a day. Therefore,
there are about (9/1.28≈) seven work cycles on average
for each truck, daily. Also, the time exposure to vibrations at each work cycle is about ((5+3+20+24)/60=) 0.87 hours. Therefore, the daily time exposure for each truck is calculated
as (0.87×7≈) six hours.
In the following, the operational conditions considered during data collection are described. The truck speed was recorded in the range of 15 to 45 km/h using the portable GPS or truck speed meter. But, the truck driver was asked to control the truck speed in five km/h intervals, as the exact control of speed was difficult. Therefore, the truck speed was recorded in five km/h intervals, including; 15 to 20, 20 to 25, 25 to 30, 30 to 35, 35 to 40 and 40 to 45 km/h. To consider the material distribution quality, the loader operator was asked to accumulate the materials uniformly or on the front, rear, right and left (driver) sides of the truck dump body, as much as possible. Fig. 3, shows the materials accumulated on the different sides of the dump body.
Also, after each loading, materials were weighed by the weighbridge of mine located in the mineral processing plant. To consider the haul road quality, mine haul road was inspected and classified into two classes; good and poor haul road qualities. The good haul road had the compacted and smoothed gravel surface. While, the surface of the poor haul road sections was destroyed and roughed because of the poor maintenance, cleaning, regrading and repairing. Fig. 4 shows the sample sections of the mine haul road. An inspection of mine road from the loading area to dumping area shows that the length of the haul road with good and poor qualities is about 3.3 km and 6.8 km, respectively.
In this study, ADXL335 accelerometer was used for all vertical vibration measurements. The sensor was placed in a compacted plastic pad. Then, the device was secured on the seat of the truck, beneath the driver’s ischial tuberosities, as shown in Fig. 5. The accelerometer requires a supply voltage of 3.6V DC. This sensor is designed to operate in the temperatures range from -55 to +125oC and has a full-scale range of ±3 g. The accelerometer device was programmed to collect data at 50 sample per second and saved onto a MicroCode Serial Communicator Recording Program
Fig. 2. The truck used for data collection
Parameter Time (min)
Loading time 5
Dumping time 3
Delay time for start loading 25
The average travel time from loading area to
dumping area (constant speed: 30 km/h) 20 The average travel time from dumping area to
loading area (constant speed: 25 km/h) 24
Table 1. Statistical operational data of the working phases of mine truck
Fig. 3. Accumulation of materials on (a) rear, (b) uniform, (c) right and (d) left sides of the dump body
4- Vibrational Data Analysis
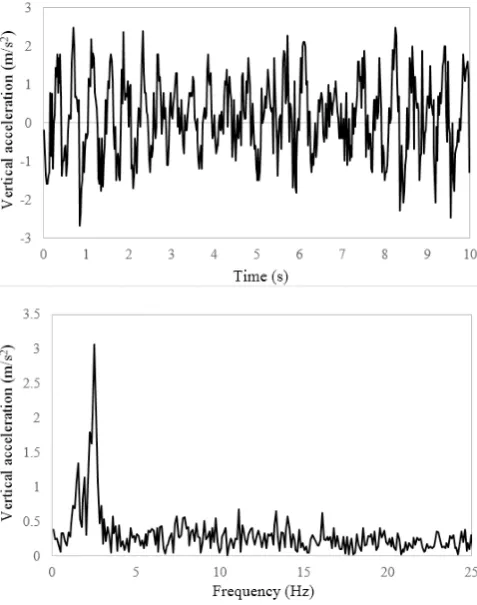
In this section, vibrational data are analyzed to determine the health risk level of the truck driver at the various operational conditions. Before analyzing, the raw data are filtered using a 2nd order Butterworth filter with a low and high-frequency cutoff of 1 and 100 Hz, respectively, to remove spurious noise. Then, the frequency-weighted RMS of vertical vibrations (awrms) is obtained using Eq. (1). For example, Fig. 6 represents a vibration signal in the time and frequency domains corresponding to 27.39 tons of materials uniformly distributed at the poor haul road condition and speed range of 20 to 25 km/h. According to Fig. 6, the RMS of vertical vibration is 1.015 m/s2 which indicates the high health risk level. Also, the high vibrational energy is observed at 2.54 Hz.
For the same condition, the RMS of the signal for a good quality haul road is calculated as 0.832 m/s2. On the other hand, the improvement of the haul road quality decreases the
calculated and reported in Fig. 7. It is obvious from Fig. 7 that, the vibrations are in the least level of health risk when the materials are accumulated on the rear side of the dump body, especially at speed ranges below 25 to 30 km/h. Moreover, at speed range above 25 to 30 km/h, the mean RMS values is increased, significantly.
The effect of materials distribution quality on the mean RMS values at the different speed ranges are shown in Fig. 8. According to Fig. 8, at speed ranges above 30 to 35 km/h, for all material distribution qualities under good and poor qualities of haul roads, the WBV exposures are in above the HGCZ area. Although at the poor haul road quality, the mean RMS magnitude is higher than the good haul road quality. To study the effect of payload on the vibrational health risk, the frequency-weighted RMS of vibrations versus different payloads at speed range of 30 to 35 km/h are shown in Fig. 9. According to Fig. 9, the truck payload in this range (25 to 31 tons) has no considerable effect on the RMS values.
The mean RMS values for the unloaded truck on the poor and good haul road qualities are shown in Fig. 10. According to Fig. 10, all RMS values on the poor haul road quality are of the high health risk level. While, on the good mine haul roads, when the truck speed exceeds the range of 30 to 35 km/h, the mean RMS values reaches above the HGCZ area.
4- 2- Statistical analysis of operational conditions and RMS values
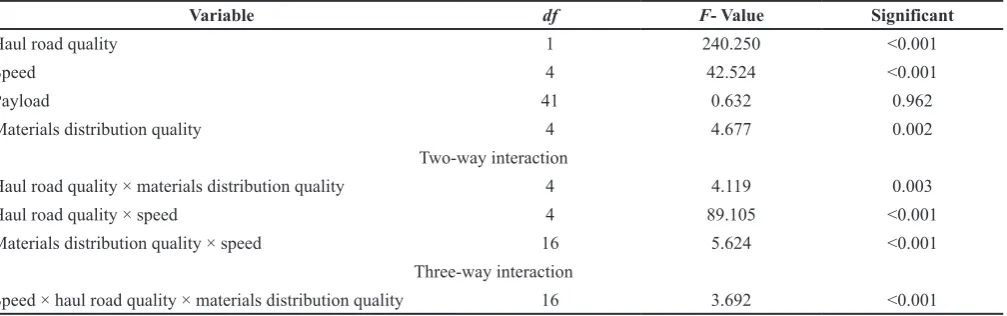
In this subsection, the effects of different operating conditions on the mean RMS values are evaluated using the analysis of variance (ANOVA). In ANOVA, the absence of a difference between the independent variable(s) and the dependent variables is defined as the null hypothesis. The p value is used to accept or reject the null hypothesis. Small p values, typically smaller than 0.05, at 5% significant level, indicate that there is a strong evidence to reject the null hypothesis. Large p values (greater than 0.05) indicate that the null hypothesis is acceptable. In this paper, the multivariate analysis of variance is done at 5% significant level using SPSS.9 software. The results of ANOVA, including the degree of freedom (df), the ratio of variation between sample means to variation within the samples (F) and the significant level of operating conditions and their interaction are given in Table 2.
According to Table 2, there is a significant difference between the truck speeds, haul road qualities and the materials distribution qualities in the RMS values (p< 0.05). While, the payload, in the range of 25 to 31 tons, has no significant effect on the RMS values (p> 0.05).
Fig. 6. Vibration signal for 27.39 tons of uniformly distributed materials at poor quality haul road in the time and frequency
Fig. 7. Mean RMS values for 27 to 29 tons of materials accumulated on (a) left, (b) right, (c) front and (d) rear sides of the truck dump body
To study the effect of truck speed values and distribution qualities of materials on the RMS values, Scheffe’s Post Hoc Test (SPHT) is applied. The SPHT is the mean comparison test used for finding relationships between the sub-groups of the significant parameters. Results of SPHT are given in Table 3. In this Table, there is no significant difference between each subgroup of the operational conditions which have the same symbol (p> 0.05). Scheffe test reveals that there is a significant difference between various truck speeds. The accumulation of the materials, uniformly or on the rear side has the lowest effect on the RMS values. Moreover, the
RMS values are at the highest level when the materials are accumulated on the left side of the truck dump body.
5- Proposing the Optimum Operational Conditions In the previous sections, the vibrational health risk was analyzed and discussed. This section is devoted to proposing the practical operating conditions to reduce health risk levels. To achieve this aim, first, it is recommended that the loader operators should try to accumulate the materials on the rear side of the dump body, as much as possible. The accumulation of materials on the rear side can make dumping easier and safer. Moreover, regarding the high negative gradient of mine haul road in the near of loading area, accumulating materials on the rear side helps the driver to drive and control the truck safely.
Vibrational data analysis shows that there is a high interaction between the haul road quality, truck speed and RMS of vibrations. Moreover, truck speed has a vital role in the mine productivity. Therefore, speed limits should be proposed based on two main criteria; health risk level and mine productivity. Regarding the commitments of mine contractor, at least 2500 tons of ores must be transported to refinery plant every day. By considering six hours as the working time of each truck and also, 20 active trucks on average, the materials which must be transported by each truck is calculated as
about (2500/(6×20) ≈) 21 tons per hour. Therefore, the goal Fig. 9. Mean RMS values vs. payload for accumulation of materials on the (a) left, (b) right, (c) front and (d) rear sides of the dump
body at the speed of 30 to 35 km/h
productivity is considered as 21 t/h.
According to the recorded data for different conditions of the truck and haul road quality, the following relationships between the values of RMS and truck speeds are obtained using regression analysis by considering the mean of speed ranges for S:
2 2
(RMS)fg = −0.0001sfg+0.0167Sfg+0.514 R =0.801 (5)
2 2
(RMS)fp= −0.0001sfp+0.026Sfp+0.495 R =0.855 (6)
2
(RMS)eg =0.0171Seg+0.523 R =0.940 (7)
2
(RMS)ep =0.0184Sep+0.514 R =0.950 (8) where subscripts f, e indicate loaded and unloaded truck, respectively. Also, subscripts g and p are for good and poor haul road quality, respectively. For example, (RMS)fg and Sfg respectively indicate RMS of vibrations and mean speed of loaded truck at good haul road. The values of R2 indicate that the data are close to the fitted regression lines. The results of regression analysis for the loaded truck at good and poor haul roads are given in Fig. 11.
To determine the optimum operational conditions, a performance index is obtained based on the whole body vibration of the driver to be minimized. By considering the length of mine haul road with good and poor qualities as 3.3 and 6.8 km respectively, the duration of exposure to vibrations for the loaded truck at the good and poor haul road qualities is calculated as 3.3/Sfg and 6.8/Sfp, respectively. Also, for the unloaded truck at the good and poor haul road qualities, the duration of exposure is calculated as 3.3/Seg and 6.8/Sep, respectively.
Regarding Table 1, the time exposure to vibrations in the loading and dumping phases are considered as 0.083 (=5/60) and 0.05 (=3/60) hour, respectively. The frequency-weighted RMS at these conditions is calculated 0.869 and 0.420 m/s2,
respectively. Therefore, the eight -hour equivalent exposure level for each working cycle of the truck, including four operational phases; loading, transporting with load, dumping and returning to loading area is calculated using Eq. (3) as:
Variable df F- Value Significant
Haul road quality 1 240.250 <0.001
Speed 4 42.524 <0.001
Payload 41 0.632 0.962
Materials distribution quality 4 4.677 0.002
Two-way interaction
Haul road quality × materials distribution quality 4 4.119 0.003
Haul road quality × speed 4 89.105 <0.001
Materials distribution quality × speed 16 5.624 <0.001
Three-way interaction
Speed × haul road quality × materials distribution quality 16 3.692 <0.001
Table 2. ANOVA results at the 5% significant level
Truck speed (km/h) Materials accumulation side
35-40 30-35 25-30 20-25 15-20 Left Front Right Uniform Rear
1.153a 1.062b 1.053b 0.924c 0.888d 1.077a 1.018b 1.003b,c 0.993c 0.980c Table 3. Results of the Scheffe’s Post Hoc Test
day (Table 1), the number of truck working cycles in each day is calculated as:
9
3.3 6.8 3.3 6.8 0.417 0.083 0.05 fg fp eg ep
N
S S S S
=
+ + + + + + (10)
where the times 0.083 (=5/60) and 0.05 (=3/60) hour is related to the loading and dumping phases, respectively, as mentioned before. Therefore, the daily exposure to an eight -hour equivalent exposure level for N similar working cycles in each day (A(8)) is calculated using Eqs. (9) and (10) as follows:
1 2
2 2
2 2
3.3( ) 6.8( )
3.3( ) 6.8( ) 0.072 9
(8) 3.3 6.8 3.3 6.8
8 0.55
fg fp
fg fp
eg ep
eg ep
fg fp eg ep
RMS RMS
S S
RMS RMS
S S
A
S S S S
+ + + + = + + + + (11)
Moreover, the mine productivity (P) in each work cycle is calculated as:
3.3 6.8 3.3 6.8 0.083 0.050 fg fp eg ep
W P
S S S S
=
+ + + + + (12)
where, W is the payload. To determine the optimum speed levels in each operational conditions, two main goals must be considered simultaneously; minimizing the total RMS of
vibration at least in the moderate health risk level (≤ 0.930)
and keeping the mine productivity at the planned level (21 t/h). Therefore, a constrained non-linear optimization problem with the daily exposure to an eight -hour equivalent exposure level for all working cycles in each day is presented as:
(8) : 21,
15 45,
( ) ,( ) ,( ) ,( ) 0.93,
30.
fg fp eg ep
fg fp eg ep
Min J A Subject to P
S S S S
RMS RMS RMS RMS W = ≥ ≤ + + + ≤ ≤ ≤ (13)
In the above optimization problem, four inequality constraints are used. The first constraint indicates that the product must
procedure to solve the non-linear programming (NLP) models. In this procedure, to overcome the stopping model at locally optimal points, the NLP solver is restarted several times from different initial points. Therefore, there is a much better chance to find the true global solution. Supplying bounds for variables, supplying initial values for variables, scaling the model to the range of a reasonable unit, simplifying the relationships and reducing the integer restrictions are the most efficient ways to make Lingo’s solution search as efficient as possible [21].
Results of solving the optimization problem show that the optimum values for the speed of loaded truck on the good and poor haul roads are 30.47 (range of 30 to 35) and 17.76 (range of 15 to 20) km/h, respectively. Speeds of the unloaded truck on the good and poor haul roads, respectively, are 23.08 (range of 20 to 25) and 10.28 (range of 10 to 15) km/h. Moreover, the optimum payload is 30 tons. In this condition, the total RMS of vibrations is 0.850 m/s2 which is in the moderate health risk level. Also, the productivity of mine is calculated as 21.60 t/h which is closed to the goal productivity (21 t/h).
6- Conclusion
In this paper, the vibrational health risk of a three-axle truck in Zonuz Kaolin Mine of Iran is analyzed and discussed in different operational conditions. Haul road quality, truck speed, payload and distribution quality of materials in the truck dump body are considered as the main operational conditions. The accelerometer sensor is secured in the driver’s seat. Then, the frequency-weighted RMS of vertical accelerations is obtained in all operational conditions and evaluated according to ISO 2631-1 standard. Finally, the optimum operating conditions are proposed to keep the truck driving in the safe condition together with truck productivity at the planned level.
In these conditions, the health risk is in the moderate level and mine productivity is in the planned level.
Acknowledgement
The authors are grateful to employees and managers of Zunuz Kaolin mine of Iran for their kind help during the field studies. The helpful guidance and warm supports of Mr. Mollaei from Iran China Clay Industrial and Dr. Hamid Aghababaei from Department of Mining Engineering of Sahand University of Technology are also acknowledged.
References
[1] M.J. Grffin, Handbook of human vibration, Academic press, (2012) 28-42.
[2] S. Kumar, Vibration in operating heavy haul trucks in overburden mining, Applied Ergonomics, 35(6) (2004) 509-520.
[3] M.P.H. Smets, T.R. Eger, S.G. Greiner, Whole-body vibration experienced by haulage truck operators in surface mining operations: a comparison of various analysis methods utilized in the prediction of health risks, Applied Ergonomics, 41(6) (2010) 763-770.
[4] S. Frimpong, G. Galecki, Z. Chang, Dump truck operator vibration control in high-impact shovel loading operations, International Journal of Mining, Reclamation and Environment, 25(3) (2011) 213-225.
[5] Y.H. Shen, M. Xu, C. Jin, Y. Gao, F.L. Wei, Operator health risk evaluation of off-highway dump truck under shovel loading condition, Journal of Central South University, 22 (2015) 2655-2664.
[6] M.J. Rahimdel, M. Mirzaei, J. Sattarvand, B. Ghodrati, H. Mirzaei Nasirabad, Artificial neural network to predict the health risk caused by whole body vibration of mining trucks, Journal of Theoretical and Applied Vibration and Acoustics, 3(1) (2017) 1-14.
[7] M.J. Rahimdel, M. Mirzaei, J. Sattarvand, S.H. Hoseinie, Health risk analysis of the imposed vibrations to mining trucks, The 4th International Reliability Engineering Conference, 2016.
[8] J. Sattarvand, M.J. Rahimdel, M. Mirzaei, Artificial Neural Network to Predict Whole Body Vibration in Mining Truck, Society for Mining, Metallurgy, and Exploration- SME and Annual Meeting and Exhibition, Denver, Colorado, 2017.
[9] T. Eger, J. Stevenson, J.P. Callaghan, S. Grenier, Predictions of health risks associated with the operation of load-haul-dump mining vehicles: Part 2—Evaluation of operator driving postures and associated postural loading, International Journal of Industrial Ergonomics, 38(9) (2008) 801-815.
[10] T. Eger, J.M. Stevenson, S. Grenier, P.É. Boileau, M.P. Smets, Influence of vehicle size, haulage capacity and ride control on vibration exposure and pre-dicted health risks for LHD vehicle operators, Journal of Low Frequency Noise, Vibration & Active Control, 30(1) (2011) 45-62.
[11] B.B. Mandal, A.K. Pal, P.K. Sishodiya, Vibration
characteristics of mining equipment used in Indian mines and their vibration hazard potential, International Journal of Environmental Health Engineering, 2(1) (2013) 45.
[12] D.K. Chaudhary, A. Bhattacherjee, A. Patra, Analysis
of Whole-Body Vibration Exposure of Drill Machine Operators in Open Pit Iron Ore Mines, Procedia Earth and Planetary Science, 11 (2015) 524-530.
[13] B.B. Mandal, A.K. Srivastava, Musculoskeletal
disorders in dumper operators exposed to whole body vibration at Indian mines, International Journal of Mining, Reclamation and Environment, 24(3) (2010) 233-243.
[14] B.B. Mandal, K. Sarkar, V. Manwar, A study of
vibration exposure and work practices of Loader and Dozer operators in opencast mines, International Journal of Occupational Safety and Health, 2(2) (2012) 3-7.
[15] V. Dentoni, G. Massacci, Occupational exposure to
whole-body vibration: unfavourable effects due to the use of old earth-moving machinery in mine reclamation, International Journal of Mining, Reclamation and Environment, 27(2) (2013) 127-142.
[16] N.J. Mansfield, G.S. Newell, L. Notini, Earth moving
machine whole-body vibration and the contribution of sub-1Hz components to ISO 2631-1 metrics, Industrial health, 47(4) (2009) 402-410.
[17] D.K. Chaudhary, A. Bhattacherjee, A.K. Patra, N. Chau, Whole-body Vibration exposure of drill operators in iron ore mines and role of machine-related, individual, and rock-related factors, Safety and Health at Work, 6(4) (2015) 268-278.
[18] R. Wolfgang, R. Burgess-Limerick, Whole-body
vibration exposure of haul truck drivers at a surface coal mine, Applied Ergonomics, 45(6) (2014) 1700-1704.
[19] ISO 2631-1, Mechanical Vibration and Shock:
Evaluation of Human Exposure to Whole-body Vibration. Part 1, General Requirements, International Standard ISO 2631-1, (E) 1997.
[20] B.M.F. Gary, L. Ardrie, Bad vibrations: A handbook
on whole body vibration exposure in mining, Joint Coal Board Health and Safety Trust 2001.
[21] L.U.S. Guide, Lingo-User’s Guide, LINDO SYSTEM
INC., Chicago 2010.
Pleasecitethisarticleusing:
M. J. Rahimdel, M. Mirzaei, J. Sattarvand, Ho. Mirzaei Nasirabad, Analysis and Optimization of Mining Truck Operation Based on the Driver Whole Body Vibration, AUT J. Mech. Eng., 1(2) (2017) 169-178.
![Fig. 1. Health guidance caution zones provided in ISO2631-1 Annex B [19]](https://thumb-us.123doks.com/thumbv2/123dok_us/8955734.1865102/2.595.313.556.292.469/fig-health-guidance-caution-zones-provided-iso-annex.webp)