Semantic Sensor Networks in Smart Homes
based on Internet of Things
Milad Lesani
M.Sc. Student of Artificial Intelligence, Department of Computer Engineering
Faculty of Engineering, Shahid Chamran University of Ahvaz,
Ahvaz, Iran [email protected]
Marjan Naderan
*Assistant Professor, Department of Computer Engineering
Faculty of Engineering, Shahid Chamran University of Ahvaz
Ahvaz, Iran [email protected]
Seyed Enayatallah Alavi
Assistant Professor, Department of Computer Engineering Faculty of Engineering, Shahid Chamran University of Ahvaz
Ahvaz, Iran [email protected]
Received:2019/07/04 Revised:2019/10/25 Accepted:2019/12/23 Abstract—In this paper, a fuzzy ontology for Semantic
Sensor Networks (SSN) is proposed for smart homes in two phases. In the first phase, using the WordNet ontology, the location and type of an object is identified with the aid of a graphical interface. This object and its synonyms are added to the list of the known objects set. Succeeding, the relation of the object with other groups is assessed based on a similarity measure in addition to using the fuzzy ontology. In the second phase, sensors with erroneous information are identified and pruned by finding a relationship between some specific factors. To this end, temperature, moisture and light are considered and the Adaptive Neuro-Fuzzy Inference System (ANFIS) is incorporated. The proposed method is implemented using some parts of the Wikipedia database and the WordNet dictionary. The first phase of the proposed method is tested with several sample requests and the system shows favorable results on finding the original group (and other related groups) of the request. For training the neural network in the second phase, the Intel lab Dataset is used. Results of this phase show that the neural network can predict the temperature and moisture factors with low error, while the light factor has more error in prediction.
Keywords—Internet Of Things, Semantic Sensor Network (SSN), Fuzzy Ontology, Neural Network, Smart Home.
1. INTRODUCTION
The number of devices that are connected to Internet has increased rapidly during the previous decade. These devices, which are also known as objects or things in the Internet, have formed the concept of Internet of Things (IoT). An excessive part of these objects consists of wireless sensors and actuators, which formerly developed the spirit of Wireless Sensor and Actuator Networks (WSAN) [1]. Many challenges exist the field of IoT, such
as heterogeneity, data formats, measurement methods, data management and interoperability [2]. In recent years, the semantic technology has been shown to be successful in overcoming some of these issues.
Ontologies and technology of semantic relations can enhance interoperability, integration, classification, reasoning and automation of a sensor network. These sensors and the resulting data could be installed, queried, controlled and understood by using high-level specifications in ontology [2]. For instance, these scenarios showcase the usage of semantic relations in the requests of smart homes. Assume that a request is made for watering the garden. What are the factors involved in the response to this query? Is checking the moisture of soil enough? Or is it better to consider other factors such as light and temperature to have a better watering, since watering in the noon and in the intense sunlight is harmful to the plants?
In another scenario, during the day, the smart home is told that there is not enough light in a room. Should the lights be turned on, or there is another reason for insufficiency of light, such as closed curtains? As induced from these examples, finding semantic relations between the request and the objects inside a smart home helps the users to perform better operations.
works, this task is delegated to middleware or operating systems, and the factors that should be considered are predefined. This is a weakness for ever-expanding Internet of Things, to which every day various objects are connected. Internet of Things is not a closed network, and semantic relations should not be predefined in it. The system must have an understanding to achieve and apply these relations. The solution provided in this paper is to use the fuzzy ontology, to better describe the degree of relations.
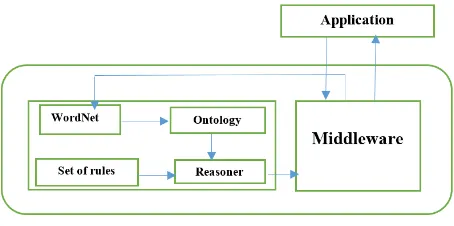
Figure 1 shows the architecture of using ontologies in this study. As shown in this figure, the applications can access the services provided by physical objects, regardless of their location. The application makes a request. This request is assessed in the middleware to see whether it is a request for reading the sensor or doing a job. To answer the request, it is referred to WordNet [3] to find out its category. WordNet is a standard solution for describing the objects, and identifying their category. WordNet groups the English words into sets of cognitive Synsets. Synsets are interlinked using relations, and form a network of words that are meaningfully related [4]. In the next step, the relation between the request and existing sensors is identified. To this end, a fuzzy ontology is created that represents the degree of relation of effects of different factors on the request. By applying semantic rules and reasoning, the required services for the response are sent to the middleware and finally to the application.
In this paper, we aim to build our fuzzy ontology for smart homes, which creates relations between objects that directly or indirectly affect each other. The exact problem which is addressed in this paper is defined as follows: a query is initiated by the user of a smart home which is turned into an exact form by the application layer program justifying one factor from a set of predefined factors (in this paper temperature, moisture and light). The smart home is supported by various sensors spread all over the home and each of them has an ID, defining its exact type and measurement responsibility. Using the WordNet ontology, the relation between objects that affect each other directly can be found.
However, the main challenge is to find other factors that have indirect impacts. In this regard, the fuzzy ontology is incorporated, where the membership function is used as a measure of relation of one object with another [5]. To obtain the membership function of objects, the frequent words method is applied. When we find the extent of relation of one object with other existing ones, that object is added to the list of objects, and its relations with others are created. This way, a fuzzy ontology, specific for smart homes, is created.
Finally, we utilize Adaptive Neuro-Fuzzy Inference System or ANFIS neural network to find erroneous information. This solution is specialized to our assumption of using three factors, i.e. one neural network for each
Fig 1. The architecture used in applications based on semantic ontologies (extracted from [12]).
factor. This novelty of our work cannot be found in other previous works. Indeed, this
paper is the extension of our previous work in [6] with the main focus on creating the relations between the objects. In addition to finding erroneous sensor information, this study surveys the previous works more completely with more simulation results, approving the proposed solution.
The rest of paper is organized as follows: a survey on related work is presented in section 2. Our proposed method is described in section 3 followed by the experimental results in Section 4. The paper concludes in section 5 with some suggestions for future works.
2. RELATED WORK
In recent years, ontologies have been used successfully to model the knowledge of sensors and their observations, known as sensor ontologies [2, 3, 4]. Some of them are focused on the definition of sensors, while others focus on their observations. Some of these proposed methods are specificfora certain project, and do not cover all ranges of the sensors and their observations. Furthermore, many of these ontologies do not follow the robust modeling process (and do not have all of the relations or support existing architectures), or they are not reusable by using existing standards [3].
In order to tackle these issues, the W3C SSN XG group presented an independent general model, named as the ontology of Semantic Sensor Networks (SSN) [9]. The SSN ontology can describe sensors by their abilities, measurement processes, observations, and locations. However, it does not include metrics about quality (such as temperature, location, distance, etc.). Hence, SSN is usually used in combination with other ontologies such as SWEET12, SWISS EXPERIMENT and SPITFIRE [10], or it is customized for a specific domain ontology [9]. There have been numerous works for customization of ontologies to add dates, prediction models, and states for sensors [8, 9]. However, researchers are searching for solutions for adding their corrections to ontologies. In the following, we review the most important works in this field.
and its functionality exists. The W3C SSN is a solution for describing sensors and their sensed data, which is independent of domain, time and location. The authors have presented a smart ontology based on SSN, namely SHO or Smart Home Ontology. They reduced the ontology to include only the required items, and hence, improves the response and service rates. Yet, their ontology is limited to the smart homes and does not include IoT.
Chaussin et al. in [3] modeled the real world which is usually built based on semantic information. The authors have investigated the implementation of physical data of sensor networks to semantic data using the previous Mundus Traducere theory. They used Java programming language to generate formal expressions based on natural language words. Their implementation is not a standalone program but it can be used in link with other complex interfaces.
Malewski et al. in [4] proposed a middleware for sensor networks. The Plug & Play methods that ease the matchmaking of sensors to web services have been popular in the field of web sensors research. They introduce current implementation of a rule system that supports complex mediation and mappings and thus, aims to achieve a real Plug & Play for the Sensor Web. Their approach has reduced the load of the operating system since classification and identification of identities of sensors is accomplished in the middleware layer. On the other hand, the response and service rates are low as reported in this method.
Bruckner et al. in [7] described semantic processing in a network of nodes. This system includes embedded systems with cameras and microphones (nodes) that process the data of their sensors, and exchange the information with neighbor nodes to identify unusual and potentially dangerous situations. The semantic architecture enables the nodes to process the information locally using eight layers, and to have a better understanding of the environment, combining the audio and the visual information. Concluding from their study, the eight layer architecture imposes a lot of overhead to the system.
Yang et al. in [8] have addressed the similarity search problem to reflect the data content distribution by using semantic based caching. The authors have analyzed cache results of earlier queries and resolve later queries within a small collection of content-related mobile nodes. They used Hilbert space filling curve to describe the data points in a multi-dimensional semantic space as a linear representation. These data points are cached to facilitate query processing. The authors showed by extensive simulation results that their proposed method can improve the cost of searching and response time. On the other side, by using WordNet for semantic reasoning inside the operating system, higher computational load is left to the operating system.
Mingozzi et al. in [12] proposed a practical approach to model and manage contexts, and to use this information for incorporating QoS awareness. In particular, they have shown how to use contexts for evaluation of object services using semantic reasoning and by using this information to assign object services to applications, and to provide QoS requirements even in case of losing. In their evaluation scenario, they modeled nine sensors inside a smart home and measured notification delay for two sensors received by application.
Wagle in [13] has addressed the MQ Telemetry Transport (MQTT) protocol for Machine-to-Machine (M2M) applications with wireless sensor networks used in IoT. The author incorporated classification to extract semantic data. Classification enables the device to classify input data into a set of predefined labels. From a graphical interface, the sensors are read and classified to several clusters. Finally, a recommender system uses the classified data to describe or predict the next data. In addition, since the proposed system is dynamic, time characteristics are critical in decision. The disadvantage of this system could be the time for training the classification which is based on labels, which may not exist in other scenarios.
Ahmed and Gregory in [14] presented a Data Centric Storage (DCS) proposal, namely Metric based Similarity Search (DCSMSS). DCSMSS incorporates the idea of vector distance index or iDistance to transform the similarity search problem into an interval search in one dimension. They also presented a sector-based distance routing algorithm for efficient routing of messages. Despite, they have presented several algorithms for this purpose, their outcomes are mostly suited for sensor networks and does not include IoT in general. Moreover, no specific ontology is used in their work.
Nachabe et al. in [15] addressed the problem of sensor heterogeneity and easy interoperability management. They used a semantic open data model for sensor and sensor data generic description. Their data model is formalized in an ontology format, namely MyOntoSens, and written using Ontology Web Language 2. The authors used Protégé 4.3 for implementation and pellet reasoner for prevalidation and it is being standardized for Body Area Networks (BAN).
Some related works in Iran have been also presented on the subject of SSN. Pirooz et al. in [16] proposed a method for control and security of a smart home or large building. They used the Internet and web-based applications and mobile-based technology to monitor and control the devices inside a home. The authors discussed the architecture and the four layered communication models of IoT behind this idea. In fact, their solution does not contain any semantic information.
data in a centralized structure, based on [8]. Their idea included using results of queries inside the network to build a semantic pattern according to ontology measures. They proposed a Binary Similarity Search (BSS) which does not need to collect the data from all sensors, but uses the data with the most similarity. Their approach is proposed for sensor networks and does not include IoT in general. Moreover, they have not used any specific ontology, despite they have described the ontology concept.
Montaseri et al. in [18] expressed fuzzy ontology relations based on the fuzzy set theory, graph theory and fuzzy relation matrix. They also proposed an algorithm for design and deduction of fuzzy virtual relations between ontology concepts. The modelling and algorithms presented in their study can be used in ontology markup languages for modelling and presentation of implicit and fuzzy knowledge data. The fuzzy ontology concept used in our research is also based on Montaseri’s study in [18].
Some other recent work also include the studies in [19-21]. In [19], a short survey of Semantic Sensor Web (SSW) has been presented. They proposed a four-layered architecture such that semantic data integration and processing is executed in the second layer. In [20], as an application of semantic data, the authors presented a MAC protocol, namely Asynchronous Semantic Preamble Listening or (ASPL), to avoid overhearing using semantic technology. In fact, they embed the semantic data into the continuous preamble of a data packet named as a short semantic preamble or (SP). In [21], semantic concepts have been used to enable the sensor network a cooperative resource discovery together with the Constrained Application Protocol (CoAP). In fact, using the CoAP makes possible to use semantic matchmaking with non-standard reasoning to better characterize the resource discovery mechanism. They also used a Hybrid Sensor and Vehicular Network (HSVN) to test the proposed framework.
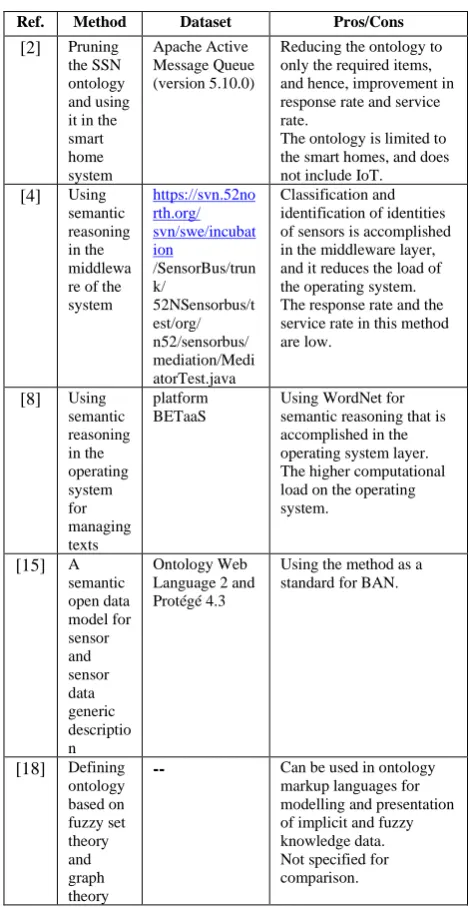
Table 1 shows a concise description of the most important previous works discussed so far. In this paper, unlike other previous works, the selected ontology network presents a wide model, which is more capable than the actual system requirements. To adjust this ontology network to real-world requirements, a part of this network is pruned. Furthermore, some of the concepts are not covered by the ontology. Hence, the required capabilities for modeling concepts such as objects services, actuators and groups are also added.
3. THE PROPOSED METHOD 3-1.Modeling equivalent texts and objects
In the proposed method, we build a dedicated ontology to unite the input information from heterogeneous sources and programs, and to extract knowledge from these raw data. This ontology is stored in the text manager, and the architecture of the whole system is as shown in the Figure 1.
TABLE 1. COMPARISON OF THE MOST IMPORTANT RELATED WORKS
Ref. Method Dataset Pros/Cons
[2] Pruning the SSN ontology and using it in the smart home system Apache Active Message Queue (version 5.10.0)
Reducing the ontology to only the required items, and hence, improvement in response rate and service rate.
The ontology is limited to the smart homes, and does not include IoT.
[4] Using semantic reasoning in the middlewa re of the system https://svn.52no rth.org/ svn/swe/incubat ion /SensorBus/trun k/ 52NSensorbus/t est/org/ n52/sensorbus/ mediation/Medi atorTest.java Classification and identification of identities of sensors is accomplished in the middleware layer, and it reduces the load of the operating system. The response rate and the service rate in this method are low.
[8] Using semantic reasoning in the operating system for managing texts platform BETaaS
Using WordNet for semantic reasoning that is accomplished in the operating system layer. The higher computational load on the operating system.
[15] A semantic open data model for sensor and sensor data generic descriptio n Ontology Web Language 2 and Protégé 4.3
Using the method as a standard for BAN.
[18] Defining ontology based on fuzzy set theory and graph theory
-- Can be used in ontology
markup languages for modelling and presentation of implicit and fuzzy knowledge data. Not specified for comparison.
The data, based on their context, have different meanings. In the operating system, context refers to all of the attributes that define objects in IoT and their relationship with each other to the software. Hence, the context of objects consists of elements such as the type of object (e.g. the temperature sensor), or its location. The location is defined by various data, such as geographical location (only for the open-space scenarios), the county name (which is obtained automatically using GPS coordinates by an online geographical coordination system presented by GeoName4), a keyword (e.g. “street”), and a descriptive text (such as Azadi).
as location and type of the object. In this convention, we need four object properties, namely ID, name, type and location. ID is given automatically by the database software. Consequently, the location and type of it are also obtained. To find the location of an object, a GPS such as GEOSPARQL11 could be incorporated [8]. For example, temperature of kitchen or moisture of garden contain information such as temperature and moisture, and the group they belong to, should be found out.
We considered a smart home having seven regions, and assigned an ID to each, according to Table 2.
Note that our ontology can model objects and the surrounding environment. The assumed environment consists of different regions of a smart home. Hence, we omitted geographical coordinates, and the county name. Other contextual information such as the battery level of the sensors, generation of data in the permissible interval, etc. are delegated to the middleware. The contextual information that are not gathered automatically are entered manually during the system configuration using a graphical interface. In this interface, two parameters “data” (or the input request) and “area” are the input parameters which for example, data can be “hot” and area can be “room” (one of the seven places which will be discussed in Section 4).
Our ontology is a network of existing ontologies in the IoT domain. This strategy has been selected due to the fact that extracting knowledge is faster and easier than designing a new one from scratch. We leverage the existing knowledge in this field while maintenance and updating is done by third parties. The most proper ontology in this field is SSN5 [10] which is, to the best of our knowledge, the most complete and the most comprehensive one for modeling the sensors, also used in this study. The selected network of ontology presents a huge model, which is much more than the real requirements of our operating system. Hence, a part of this network is pruned. In addition, some concepts are not covered by the ontology. Therefore, we have added the required capabilities for modelling concepts such as services of objects and actuators.
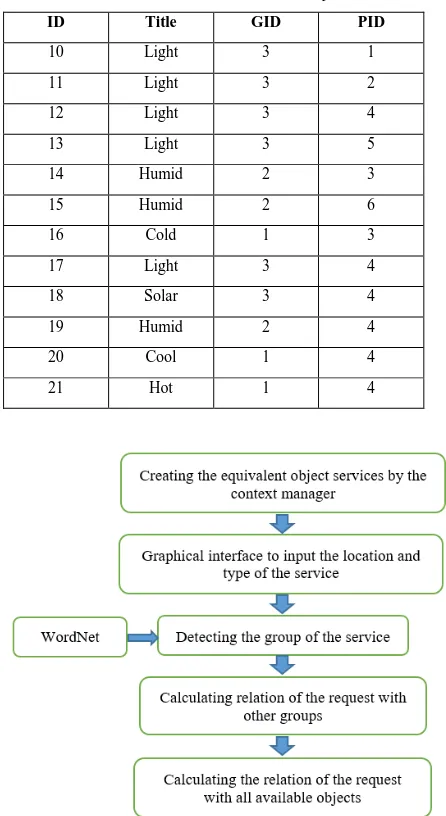
To this end, the following method is proposed: a graphical interface is shown to obtain the context information that are not provided directly by the object. The graphical interface asks a name when the object is a sensor and a verb in case of an actuator. Hence, the graphical interface includes a form containing the location and type of the object (this could be performed by the Stanford Parser1). If possible, the graphical interface searches for better words in WordNet and fetches the set of synonyms of the ID of word together with the storage location in the ontology. For words with different meanings, the graphical interface retrieves all possible word meanings and asks from the user about this ambiguity. The context manager uses WordNet to find out the synonymy of words. The proposed algorithm so far, for adding an object to the ontoloyg is shown in Figure 2.
1 https://nlp.stanford.edu/software/lex-parser.shtml
TABLE 2. THE IDS OF DIFFERENT REGIONS OF THE SMART HOME
ID of the
region
Region (place)
1 Room
2 Bedroom1
3 Bedroom2
4 Kitchen
5 Bathroom
6 WC
7 Yard
Fig 2. Flowchart of the first phase of the proposed method
All the words with the same IDsynset are considered as synonyms. For example, if a program needs to measure the geographic location, all of the objects classified as local sensors are valid. On the other hand, the context manager is able to identify a family of objects. For example, if a program needs to measure the moisture, the classified objects, such as the related moisture, temperature, and light sensors are valid.
Finally, the context manager uses the location ID to find the location of objects. Using the WordNet, hypernymy/hyponymy (semantic relations for a superior/inferior) and holonymy/meronymy (relations between a whole and its components/a component and the whole) are defined. The inference could be also used during the runtime of program. In this case, to improve words, meronymy (or hypernymy if meronymy is not found) is used. For example, if a program requests the temperature of the house, the temperature sensor in the kitchen is valid (because the kitchen is a meronymy of the house).
graphical interface is sent to WordNet, and all of its synonyms are searched and saved. Next, the word and its synonyms are searched in the list of words that have been added to the ontology, to find its group.
Considering the information on type, location of residence and the group of the new object, we add it with a new ID to the collection of existing objects. So far, we have identified the group of the new object, which is one of these three groups: temperature, moisture and light. For example, assuming the new sensor is a temperature sensor in a bedroom and the input request is the temperature of the house, if there are no other temperature sensors in the environment, the sensor in the bedroom is used.
In Table 3, a list of the added objects to the network can be seen. ID is the number of the sensors placed inside the smart home. A total number of 21 sensors exist (which will be explained in Section 4) which just 11 sensors are shown in this table. GID represents the Group ID of the object, where the three groups assumed are temperature, moisture, and light with GIDs 1, 2, and 3, respectively. Finally, PID represents the Place ID, which are seven places inside a smart home (will be described in Section 4). Because we did not have an access to a real-world sensor network, these objects are inserted manually via the graphical interface and their relations are extracted as explained in Figure 3. As shown in Table 3, the group of objects can be detected accurately.
3-2.Inferring services of equivalent objects
In this paper, semantic logical techniques are also incorporated to extract relations that are not explicitly expressed in the ontology and cannot be deducted from as WordNet synset. To this end, the context manager uses a semantic reasoner and a set of rules. It is worth mentioning that in the previous section, only the reasoning of WordNet was used with some inference rules as defined before Figure 3.
By considering a set of rules, a semantic reasoner decides whether the rules should be applied on a particular time or not. By investigating different IoT scenarios, these situations result:
i) when one service from more than one object is used (e.g. when two temperature sensors are installed in a bedroom, which one of them will be read?);
ii) when a combination of services are needed. In other words, when different information from the installed sensors in different rooms of the house are needed (e.g., if we want to change the temperature of a room to the desired value, we need readings from temperature and light sensors which are from different groups).
Through analyzing these situations, we have defined two detection rules:
i) the services to equivalent objects, which is related to equivalent objects placed in same locations. Therefore, the context manager creates
a list of services for equivalent objects for a particular application;
ii) services related to different objects, which are placed in different locations are combined. Hence, an operator is applied which defines and combines the list of services of objects based on the requests of each program, and finds a list of services of equivalent objects (if present).
3-3.Information modelling in the Fuzzy ontology
One of the approaches to content analysis of texts is to statistically assess the presence of each word, and their co-occurrences. Using n-grams of texts is one of these methods. N-grams are combinations of n words together [23]. For example, every three words that appear alongside each other in a text, and are related, are called 3-grams. Frequent 1-grams usually represent keywords of the text. 2-grams and 3-grams and higher levels of n-grams show the way words co-occur.
TABLE 3. The list of the added objects
ID Title GID PID
10 Light 3 1
11 Light 3 2
12 Light 3 4
13 Light 3 5
14 Humid 2 3
15 Humid 2 6
16 Cold 1 3
17 Light 3 4
18 Solar 3 4
19 Humid 2 4
20 Cool 1 4
21 Hot 1 4
In addition of studying the list of n-grams, the relation between their elements are also useful. Here, we have tried to use the set of words that have a high co-occurrence in order to find their semantic relations. Each two words that are seen in an n-gram are called neighbors, and we want to exploit this neighborhood to extract semantic relations between neighbor words. In this study, sentences are considered. In other words, frequent words that are used alongside each other in sentences have a semantic relation.
In this method, first the sentences are extracted from texts. Each two word in one sentence are neighbors. Hence, words that have common neighbors have a semantic relation. To this end, a list of keywords (i.e., objects names which are inserted to our system previously) together with frequent words or 1-grams, which are used in smart homes, is manually created and saved. Next, we implemented a program to break the texts in sentences and saved them. Most of the texts are about smart homes.
In the next phase, for extracting semantic relations candidates from each pair of words as (word1, word2), the following procedure is taken: word1 is a word from the synonyms found by WordNet, and word2 is a word from the keywords list that belongs to another group (other than the group defined for the word that is input by the user). In this way, we are analyzing the relation of the input word with groups other than the group it belongs to.
To calculate the similarity between the neighbor pair (word1, word2), this relation is used:
Relation-degree = (s*s) / (s1 * s2) (1) in which, s1 and s2 are the frequencies of word1 and word2 in the sentences set, s represents the co-occurrences of these words in a sentence, and Relation-degree is the similarity of these words. It is obvious that 0 ≤ Relation-degree ≤ 1 and the closer Relation-degree to 1, the more likely a semantic relation exists between word1 and word2. In order to find the similarity of a certain input word with a group, the computed Relation-degrees are sorted in a decreasing order. The word with the highest Relation-degree is a representative of its group which shows the relation of that group with the user’s request. In fact, we are using virtual fuzzy relations rules to find the relation of the request with other groups that are not synonyms directly.
At this step, we are able to define “virtual relationships” which find the factors that are indirectly related to a request. A virtual relationship is defined if one of the following rules exists:
If relationship R(i, j) does not exist in real terms, but: • relations R(i, k) and R(k, j) exist for at least one
k, then the virtual relationship R(i, j) exists between i and j.
• or relations R(i, k) and R(k, j) for more than one entity k exist, then the same number of virtual relationships exist between the two entities i and j.
For example, as stated in the section 1, watering is related to the temperature degree; on the other hand, the temperature degree is related to the sunlight. Therefore, we can deduce that watering is related to the sunlight.
Creation or non-creation of these virtual relationships depends on the degree of the fuzzy values computed between entities and that how much this fuzzy relation is tight and limited in the ontology. To compare and select the appropriate virtual relationships from existing ones, the COMP function can be selected based on either of the following two states [18]:
1- If the fuzzy relation between the concepts is flexible, then the virtual relationship between concepts can be easily created, so:
R(i,j) = COMP(x,y) = max(x,y) = x if x>y and y otherwise 2- If the virtual relationships between the concepts
are tight and limited, then the virtual relationship between concepts should not be easily created, so:
R(i,j) = COMP(x,y) = min(x,y) = y if x>y and x otherwise where x and y are any two variables. Accordingly, to find more virtual relations, we should use the maximum value, otherwise the minimum value is selected. In our proposed method, we use the maximum value.
In fact, the request was received as a word from the input (namely word1) and a group of synonyms was found by WordNet (namely G(word1) which has k members). Now, we must obtain the relationship of each of these words using (1), i.e., Relation-degree1, …, Relation-degreek, which represents the relationship between one of the words synonymous with the sensor. We select the maximum value among them which represents the most related word. Of course, this value is considered to be 1 for sensors of the same group with the requested value (for example the Relation-degree of “warming” with “heater” is considered as 1).
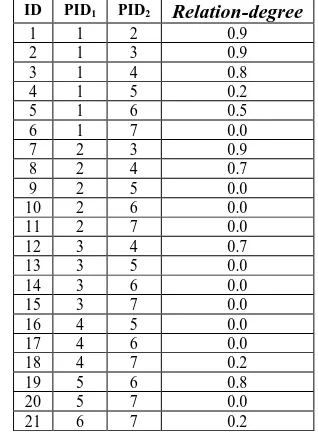
By having the Relation-degrees of the input word with groups, and Relation-degree of environments with each other (that has been provided by the experts, and are specific to that house; for example, in a house two bedrooms may be similar in terms of temperature and light, but in another house they may not be similar because of their distance), using (2), the relation of the input word with other objects is calculated:
in which, Relationik is the relation of the input word k with object i, Relation-degreei is the relation of object i with the group of the input word, and Placesrik is the relation of the input word with the environment of that object. We assume the relations between different environments are as shown in Table 4, where PID1 represents PlaceID1, PID2 represents PlaceID2 and the places are seven places with 21 sensors (the ID in the first column) which will be described in Section 4. The relation of an environment with itself is 1. Figure 3 shows the flowchart of the proposed method for assigning the appropriate service. 3-4 Serving the application requirements
As said before, in this research, it is assumed that the operating system has given permission of requesting objects services to the middleware. For this purpose, the operating system uses a standard interface, related to each service class, to negotiate with the application. For example, the application requests checking the temperature of the house. The middleware finds the related sensor, and reads its value. If it is valid, it sends it to the application, otherwise it should use another temperature sensor that has the highest relation to the requested service.
In another scenario, the request is to check the need of garden to be watered. The objects that are related to watering are found. We assume that the values of sensors of outside temperature, soil moisture and light intensity are reported, each with a Relation-degree. Moreover, suppose the temperature checking function is as:
F(temperature) = - ((Ti –Ts) / Ts ) * Relationi (3) in which Ti is the current temperature, Ts is the standard temperature of the environment, and Relationi is the impact of object i, which its calculation is discussed in (2). As can be seen, if the outside temperature is higher than the standard temperature, this function will have a negative impact on watering, depending on the effect of temperature in watering. For moisture and light intensity sensors, similar functions are incorporated as:
F(moisture) = - ((Hi – Hs) / Hs) * Relationi F(light) = - ((Li – Ls) / Ls) * Relationi
(4) (5) In equations (4) and (5), Hi is the moisture sensed by sensor i, Hs is the standard moisture, Li is the light intensity measured by sensor i, Ls is the light intensity suitable for watering, and in all of these equations, Relationi is the impact of sensor i on the request as in (2).
Next, based on the testing the data and the results, a threshold is defined; if the value of the main function is higher than the threshold, watering is accomplished. In the simulation results, the value of this threshold is reported. Now, it is defined in the middleware that if a job needs to be done, the presence of people in the house is checked by the corresponding sensor. If there is no one in the house, the job is accomplished automatically by the system, such
TABLE 4. THE ASSUMED RELATION OF DIFFERENT ENVIRONMENTS OF THE HOUSE WITH EACH OTHER
ID PID1 PID2 Relation-degree
1 1 2 0.9
2 1 3 0.9
3 1 4 0.8
4 1 5 0.2
5 1 6 0.5
6 1 7 0.0
7 2 3 0.9
8 2 4 0.7
9 2 5 0.0
10 2 6 0.0
11 2 7 0.0
12 3 4 0.7
13 3 5 0.0
14 3 6 0.0
15 3 7 0.0
16 4 5 0.0
17 4 6 0.0
18 4 7 0.2
19 5 6 0.8
20 5 7 0.0
21 6 7 0.2
that value of the main function becomes lower than the threshold, and if there are people in the house, the need to watering the garden is reported to them.
3-5 Discussion of the proposed method
So far, we have been able to find the relation of the request and the available sensors. Some questions may rise at this stage about situations where the system may be unable to handle the received request, such as: 1) WordNet does not provide a synset for the request; 2) The request is not related with any of the existing objects. In fact, the proposed system can handle these situations as: 1) according to section 3-2, this is done by the semantic reasoner, which is defined as in section 3-3. Moreover, we have saved words related to the three groups (temperature, moisture and light) which the relation of the input word is also calculated with them. 2) if a request is not related to any of the existing objects it means that all the Relation-degree values are 0. We have added a situation that if the maximum value is 0, return “no relations found with existing objects”.
Now, consider that one of these sensors sends erroneous data due to numerous possible reasons (intrusion to the system, faulty installation, fault in sensor, etc.). For more clarification, we consider these scenarios: in one scenario, assume that one of the existing sensors that have been identified by the system, and added to the available objects, cannot do its task for any reason (such as low battery or a failure). If the system reads this information, it will send wrong information and mislead the system.
and shows a normal temperature; in this way, the reactor will explode due to the very high temperature. In another case, the installer has put the temperature sensor in front of the air conditioner or above the heating system. Or, a moisturizer is turned on below the moisture sensor. This causes the sensor not to report the right information.
Other than these scenarios, we should consider the fact that the designed fuzzy ontology is able to identify objects that are not necessarily related to the request. For example, the refrigerator temperature sensors, or the oven temperature sensors are identified as sensors related to the kitchen, but there are no actual relations between them.
Hence, these are shortcomings of the ontology that we have designed. To tackle these issues, we need to prune, or qualify the selected objects for response. This requires finding a relation between existing factors. In this work, we considered temperature, moisture, and light factors and we want to found out any relations between them. This is performed via the ANFIS neural network, which will be described in the next subsection.
3-6 The ANFIS network
ANFIS is known as one type of the neural networks for finding the relations between input and output variables especially when the information are quantized by fuzzy levels [21]. For example, for analyzing accuracy or error of the intended temperature, we set values of the moisture and light sensors (the moisture and light sensors with the highest relation) as the input neurons of the neural network, and predict the temperature value. The predicted result is compared to the observed temperature, to see if our observations are real or not. Hence, for each factor we need a separate neural network, and therefore, we design three neural networks.
In this network, the number of input neurons are the membership functions of the fuzzy system. For example, when we define a network with three input neurons for the temperature factor, we divide it into hot, mild and cold levels. The Sugeno fuzzy system incorporates a Gaussian function [24]. In addition, the number of rules and the output membership functions are equal to the number of input neurons to the power of the number of inputs.
To train the network, we need to normalize the data, and we use the division by the maximum method. The network is trained and the weights are corrected with the back propagation error (or hybrid) algorithm (which are also defaults of MATLAB). In the next section, we will present the results of these simulations in detail.
4. SIMULATION RESULTS AND COMPARISON
In this paper, the proposed method is simulated using JAVA, some parts of Wikipedia database and WordNet 2.1. In this implementation, there are three groups for objects: moisture, temperature, and light; and seven locations defined inside a smart home: bedroom1, bedroom2, WC, bathroom, kitchen, yard and room. 21
sensors of different kinds were placed in these locations. The offline version of WordNet was downloaded and installed since it does not provide an online web service. Some required libraries were added to our program for connecting the installed WordNet to Java2. In addition, a piece of code is required, that by connecting to the WordNet dictionary, extracts the synonyms and returns them to the Java program. In the synonym request, all four types of noun, verb, adverb, or adjective are requested. Subsequently, the words that have a hypernymy/hyponymy or holonymy/meronymy relation with the request are fetched from WordNet and saved. At this stage, for the request, a set of synonym words which are tested for a number of words such as light, cool, cold, hot, and humid, are found together with their synonyms.
Next, we determine that to which group our request belongs to. This is done by searching the list of keywords (1-grams) that are prepared before. The relation of the request to the group it belongs to is set to 1. Now the relation of the request to other groups should be determined. As mentioned in section 3-3, we try to find virtual relations between the request and words of other groups (other than the determined group) using the frequent words method. All pairs of the words in the list of keywords are searched in Wikipedia, and their texts are separated into sentences using “split(.)”, and saved. The frequencies of each of the keywords and the request are calculated in the database of sentences. For example, if frequency of a word is n, it means it has appeared in n sentences. According to (1) and (2), we calculate the Relation-degree of a request with each of the keywords of the other groups. Next, we sort the list for each group of words, and the word with the highest relation is chosen as the representative of that group, and the Relation-degree of it is set to the Relation-degree of the request to the group that words belongs to.
By having a measure of relation of a request with each of the three groups, and the relation of regions (which is provided by experts), we can calculate the direct or indirect relations of each of the available objects with the request as the aforementioned formula. Since in simulations, 21 sensors are placed in the house environment, the request is considered as factor number 22, to calculate its relation with the available sensors.
For example, in Table 5, the results of calculating relations for a “hot” request, which is sent from kitchen, is shown. As seen from this figure, first the synonyms are found using WordNet, and next, the group of the request, which is temperature, is found. Succeeding, the relations of the 21 objects with the request are calculated, which are fuzzy values and form a fuzzy ontology. The first column is the ID of request, which is 22, the second column shows the ID of available sensors, and in third column,
the relation which is calculated by (2) is reported. As explained before, the maximum value for this column shows the maximum relation and a zero value shows no relation. These values are fuzzy.
The second phase of the proposed method is implemented using Matlab software and with ANFIS neural network. To train the neural network, the Intel lab dataset is used [25].
This dataset contains data gathered from 54 sensors that have been collected in Intel Berkley research lab between February 28 and April 5, 2004. Mica2Dot
TABLE 5. THE OUTPUT OF A SAMPLE “HOT” REQUEST AND THE RELATIONS OF OBJECTS WITH THIS REQUEST
ID of new thing ID of sensors Relation
22 1 0.17
22 2 0.28
22 3 0.0
22 4 0.0
22 5 0.9
22 6 0.34
22 7 0.0
22 8 0.0
22 9 0.46
22 10 0.0
22 11 0.0
22 12 0.0
22 13 0.0
22 14 0.03
22 15 0.0
22 16 0.8
22 17 1.0
22 18 0.0
22 19 0.0
22 20 0.0
22 21 0.0
Current array list if synonyms is: (hot, hot, raging, hot, hot, hot, hot, blistering)
Data input: hot Group of thing: temperature, area number = 4
sensors with the weather label collected information about temporal topology, along with moisture, temperature, light, and voltage for every 31 seconds. Data is gathered using TinyDB in the query processing system in the network, built on the TinyOS platform. The placement of the sensors in the lab are shown in Figure 4.
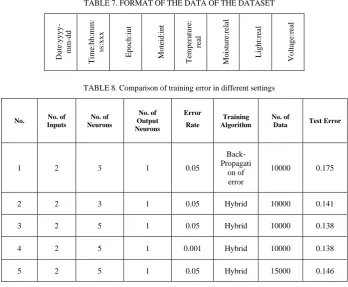
The [x, y] coordinations (measured in meters; [0, 0] is the top right corner of the lab) are shown in Table 6. The columns are mote ID, x, and y. There are some missing data in this dataset. Mote IDs range from 1 to 54. Data of some motes may be lost or weak. The temperature is measured in Celsius. Relative moisture is the corrected moisture degree which is in the range 0-100%. Light is measured in lux, in which 1 lux shows the illuminance of moonlight, 400 lux is the illuminance of an office, and 100,000 lux is the illuminance of full sunlight. Voltage is reported in volts, between 2 and 3 volts. The batteries are Lithium-ion, which maintained their voltage for a long time. Changes in voltage are highly related to changes in temperature. Finally, all of the data are averaged over time. These data consist of the transmitter ID, the receiver ID, and the probability of success of transmitting from transmitter to receiver (Table 7). Note that this is not a synchronous relation, i.e., sensor A may hear B better than B.
We pre-process data and extract only the temperature, moisture, and light data. Therefore, three neural networks
Fig 4. Sensors in the laboratory [25]
TABLE 6. THE COORDINATION OF SENSORS Sensor
#
x y Sensor
#
x y Sensor
#
x y
1 21.5 23 19 3.5 13 37 27.5 26
2 24.5 20 20 0.5 17 38 30.5 31
3 19.5 19 21 4.5 18 39 30.5 26
4 22.5 15 22 1.5 23 40 33.5 28
5 24.5 12 23 6 24 41 36.5 30
6 19.5 12 24 1.5 30 42 39.5 30
7 22.5 8 25 4.5 30 43 35.5 24
8 24.5 4 26 7.5 31 44 40.5 22
9 21.5 2 27 8.5 26 45 37.5 19
10 19.5 5 28 10.5 31 46 34.5 16
11 16.5 3 29 12.5 26 47 39.5 14
12 13.5 1 30 13.5 31 48 35.5 10
13 12.5 5 31 15.5 28 49 39.5 6
14 8.5 6 32 17.5 31 50 38.5 1
15 5.5 3 33 19.5 26 51 35.5 4
16 1.5 2 34 21.5 30 52 31.5 6
17 1.5 8 35 24.5 27 53 28.5 5
are designed for the three factors (Figure 5). For example, for the temperature factor, we design a neural network that gets moisture and light as the input neurons and calculates the temperature as its output, and this temperature is compared to the one read from the temperature sensor. From the dataset, we chose 15,000 records, and divided it into 10,000 training records and 5,000 test records.
We test this network with various types of data and membership functions to obtain a good result. We first tested this network with three membership functions (for example, hot, middle, and cold), and with the number of data that was mentioned before. The results with different methods and with 20 steps of training are shown in Table 8.
Based on experiments reported in Table 8, we trained the network using 10,000 data, training error of 0.05, hybrid weight change algorithm, and two membership functions (input neurons).
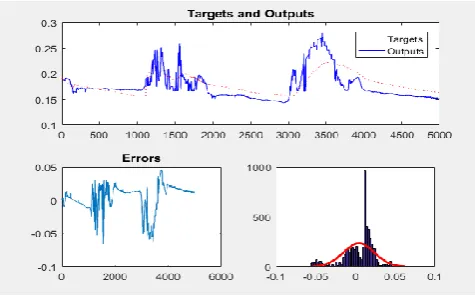
The training chart of neural network for prediction of temperature by moisture and light is shown in Figure 6. Similar operation is performed for the other two factors. Now, we test these three networks using 5,000 test data. The results are reported in Figures 7, 8 and 9.
In these three figures, the top diagram consists of the real values (targets) and the values predicted by the system (Outputs). The x axis represents each test sample of the network and the y axis shows value corresponding parameter (temperature in Celsius, light in lux and moisture in %). The two bottom diagrams include the value of error and its histogram, from left to right, respectively.
In the error diagram, the x axis again represents each test sample and the y axis is the difference of the above diagram lines. As can be seen from Figures 7 and 8, the network can predict the values accurately, but in Figure 9, it can be seen that the network have not been able to predict light accurately. This is because there is no direct relation between light and temperature and moisture. To
Fig 5. Fuzzy Neural Network used in the proposed system
Figgure 6. The training chart of the neural network for predicting temperature
Figure 7. Neural network error for temperature prediction
Figure 8. Neural network error for prediction of moisture
TABLE 7. FORMAT OF THE DATA OF THE DATASET
V
o
lt
ag
e:
re
al
Li
g
h
t:
re
al
M
o
ist
u
re
:r
el
al
T
emp
er
at
u
re
:
re
al
M
o
te
id
:i
n
t
Ep
o
ch
:i
n
t
Ti
me
:h
h
:mm
:
ss:
x
x
x
D
at
e:
y
y
y
y
-mm
-dd
TABLE 8. Comparison of training error in different settings
No. No. of
Inputs
No. of Neurons
No. of Output Neurons
Error
Rate
Training Algorithm
No. of
Data Test Error
1 2 3 1 0.05
Back-Propagati
on of error
10000 0.175
2 2 3 1 0.05 Hybrid 10000 0.141
3 2 5 1 0.05 Hybrid 10000 0.138
4 2 5 1 0.001 Hybrid 10000 0.138
5 2 5 1 0.05 Hybrid 15000 0.146
have a more accurate prediction of light, we need to add effective factors to the input of the network. These factors include openness of curtains, time of day, the lighting in the room, etc.
Furthermore, to have a better prediction of temperature, we incorporated the battery voltage of sensors, which have a direct relationship with the temperature. An accurate prediction can prevent wrong data from entering the system. Our system was able to incorporate three factors and related objects to obtain a good result. For example, sometimes by opening the curtains and getting a better lighting in the room, the need to the heating system would be reduced. However, doing this in the summer will make the house warmer, and more electricity is needed to run the air conditioner.
5. CONCLUSION AND FUTURE WORK
In this paper, a limited smart home, and a database of contexts on smart homes in Wikipedia were used. It was demonstrated that fuzzification of the ontology of the smart home makes this static system more dynamic. In other words, if the system is not dynamic, semantic processing is not required and the system works with pre-defined rules and relations. Therefore, in the proposed fuzzy ontology, the relations and rules are generated by the system, and are not limited to effective factors. For example, for warming the house, it is not always necessary to turn on the heater.
As a suggestion for future works, incorporating web service technologies such as SOAP and RESTFULL are useful to connect the system to the World Wide Web.
Furthermore, by using a powerful search engine such as Google, a rich database could be built. Additionally, the system is faster if the processing is implemented in cloud.
ACKNOWLEDGMENT
The authors would like to thank the HPC center of Shahid Chamran University of Ahvaz (SCU-HPCC) for providing computing resources.
REFERENCES
[1] I. F. Akyldiz, W. Su, Y. Sankarasubramaniam and E. Cayirci, “A survey on sensor network”, IEEE Communication Magazine, vol. 40, no. 8, pp. 102-114, August 2002.
[2] O. B. Sezer, S. Z. Can and E. Dogdu, “Development of a Smart Home Ontology and The Implementation of A Semantic Sensor Network Simulator: An Internet of Things Approach”, 2015 International Conference on Collaboration Technologies and Systems (CTS), August 2015, Ankara, Turkey.
[3] A. Chaussin, H. Osawa, R. Oomura and M. Imai, “Mundus Traducere, Interpretation of Natural Language using a Semantic Sensor Network”, IEEE Workshop on Advanced Robotics and its Social Impacts, Tokyo, Japan, November 2009.
[4] C. Malewski, A. Broring, P. Maue and K. Janowicz, “Semantic Matchmaking & Mediation for Sensors on the Sensor Web”, IEEE Journal of Selected Topics in Applied Earth Observations and Remote Sensing, vol. 7, no. 3, pp 929-936, March 2014.
[5] R. Fuller, “What is Fuzzy logic and Fuzzy Ontology”, KnowMobile National Workshop, Helsinki, Finland, October 30, 2008.
[6] M. Lesani, M. Naderan and S. E. Alavi, “A Novel Approach for Automation of Smart Homes, Based on Internet of Things, Using Fuzzy Ontology”, 8th International Conference on Computer and Knowledge Engineering (ICCKE), Mashhad, Iran, October 2018. [7] D. Bruckner, C. Picus, R. Velik, W. Herzner and G. Zucker,
[8] B. Yang and M. Mareboyana, “Similarity search in sensor networks using semantic-based caching”, Journal of Network and Computer Applications, vol. 35, no. 2, pp. 577-583, 2012.
[9] Y. C. Chung, I. F. Su and C. Lee, “An efficient mechanism for processing similarity search queries in sensor networks”, Journal of Information Sciences, vol. 181, pp. 284-307, 2011.
[10]S. Cost, S. Salzberg, “A weighted nearest neighbor algorithm for learning with symbolic features”, Machine Learning, vol. 10, pp. 57-78, 1993.
[11]R. Mietz, S. Groppe, K. Romer and D. Pfisterer, “Semantic models for scalable search in the internet of things,” Journal of Sensor and Actuator Networks, Vol. 2, No. 2, pp. 172–195, March 2013. [12]E. Mingozzi, G. Tanganelli, C. Vallati, B. Martínez, I. Mendia and
M. Gonzalez-Rodriguez, “Semantic-based Context Modeling for Quality of Service Support in IOT Platforms”, IEEE 17th International Symposiom on A World of Wireless, Mobile and Multimedia Network (WoWMoM), 2016.
[13]S. Wagle, “Semantic Data Extraction over MQTT for IoTcentric Wireless Sensor Networks”, International Conference on Internet of Things and Applications (IOTA), Pune, India, 2016.
[14]K. Ahmed and M. A. Gregory, “Distributed efficient similarity search mechanism in wireless sensor networks”, Sensors, vol. 15, pp. 5474-5503. 2015.
[15]L. Nachabe, M. Girod-Genet and B. El Hassan, “Unified Data Model for Wireless Sensor Network”, IEEE Sensors Journal, vol. 15, no. 7, pp. 3657-3667, 2015.
[16]R. Pirooz, A. H. Tajfar and M. Gheysari, “Control and Security in Smart home using Internet of Things Technology”, International Conference on Computer Engineering and Information Technology, Tehran, Iran, 2016: https://www.civilica.com/Paper-CITCOMP01-CITCOMP01_166.html.
[17]S. Shakermi, M. Romoozi, M. Shams, “Improved Searching in Sensor Networks using Semantic Storage”, 1st National Conference on Electric and Computer Systems, Computational Distributed Systems and Intelligent Networks, Kashan, Iran, 2014:
https://www.civilica.com/Paper-ELECONFK01-ELECONFK01_102.html.
[18]S. A. Montaseri, M. E. Shiri Ahmadabadi, B. Asadi, Y. Nemati, “Modeling of Fuzzy ontology relationships”, 2nd National conference on Computer/Electrical and IT Engineering (CEIC`09), SAMA, Hamedan, Feb.19, 2009: https://www.civilica.com/Paper-CEIC02-CEIC02_034.html.
[19]L. B. Bhajantri, R. Pundalik, “Data Processing in Semantic Sensor Web: A Survey”, 3rd International Conference on Applied and Theoretical Computing and Communication Technology (iCATccT), Tumkur, India, 21-23 Dec. 2017.
[20]S. Das, S. Bhowmik and C. Giri, “Design of Asynchronous Semantic Preamble Listening for Semantic Sensor Network to Avoid Early Hearing”, International Conference on Wireless Communications, Signal Processing and Networking (WiSPNET), Chennai, India, 22-24 March 2017.
[21]J.-S. R. Jang, “ANFIS: Adaptive-Network-based Fuzzy Inference System”, IEEE Transactions on Systems, Man, and Cybernetics, vol. 23, no. 3, pp. 665-685, May/June, 1993.
[22]M. Ruta, F. Scioscia, A. Pinto, F. Gramegna, S. Leva, G. Loseto, E. Di Sciascio, “Cooperative Semantic Sensor Networks for pervasive computing contexts”, 7th IEEE International Workshop on Advances in Sensors and Interfaces (IWASI), Vieste, Italy, 15-16 June, 2017, pp. 38-43.
[23]M. Mansoorizadeh and M. Nassiri, “Automatic Extraction of Semantic Relation between Words”, Technical reprot, Cyber-space Research Institute (CSRI), Information Technology Platform Group, 2012.
[24]L. A. Zadeh, “Fuzzy sets”, Information and Control, vol. 8, 1965, pp. 338-353.
[25]http://db.csail.mit.edu/labdata/labdata.html
Milad Lesani received his M.Sc. degree
in Computer Engineering, major in Artificial Intelligence from Shahid Chamran University of Ahvaz (SCU), Ahvaz, Iran in 2018. His research interests include artificial intelligence, semantic web, fuzzy logic and evolutionary methods in networks.
Marjan Naderan received her B.Sc.
degree in Computer Engineering in 2004 and the M.Sc. degree in Information Technology in 2006 both from Sharif U n i v e r s i t y o f T e ch n o l og y ( S U T ) , Tehran, Iran. She received the Ph.D. degree in Computer Engineering, major in computer networks in Feb. 2012, from Amirkabir University of Technology (AUT), Tehran, Iran. Dr. Naderan joined the Computer Engineering department of Shahid Chamran University (SCU) in Ahvaz, Iran in Sep. 2012. She was the head of the Computer Engineering department from 2013 to 2015. She is currently the director of the HPC Center in Shahid Chamran University of Ahvaz (SCU-HPCC). Her research interests include c omputer networks, wireless and mobile networks, IoT and cloud computing, social networks, object tracking, network optimization, simulation of network protocols, bio -i n s p -i r e d a n d -i n t e l l -i g e n t m e t h o d s -i n n e t w o r k s .
Seyyed Enayatallah Alavi received his