www.geosci-instrum-method-data-syst.net/2/257/2013/ doi:10.5194/gi-2-257-2013
© Author(s) 2013. CC Attribution 3.0 License.
Instrumentation
Methods and
Data Systems
Spectral analysis for wide energy channels
E. A. Kronberg and P. W. Daly
Max Planck Institute for Solar System Research, Max-Planck-Str. 2, 37191 Katlenburg-Lindau, Germany Correspondence to: E. A. Kronberg (kronberg@mps.mpg.de)
Received: 22 May 2013 – Published in Geosci. Instrum. Method. Data Syst. Discuss.: 20 August 2013 Revised: 24 October 2013 – Accepted: 28 October 2013 – Published: 18 November 2013
Abstract. For energetic particle measurements whose
spec-tra follow a power law, it is often challenging to define a char-acteristic (“effective”) energy of an energy channel. In order to avoid time-consuming calculations, the geometric mean is often used as an approximation for the effective energy. This approximation is considered to be pretty good. It is, how-ever, potentially inadequate in cases with wide energy chan-nels and soft spectral slopes. In order to determine the limits of the goodness of the approximation, we derive formulas to calculate the deviation of the effective energy, phase space density and energy density based on the geometric-mean ap-proximation from those based on the power law. The results show that the geometric-mean approximation is usually ad-equate and that corrections are needed only in extraordinary cases.
1 Introduction
Particle measurements for the study of space plasma physics are provided in defined energy ranges by instruments on-board satellites. Due to telemetry limitations the energy of each measured particle is not transmitted to the earth. Each particle measurement is allocated to an energy channel with a certain width. Typically, a large number of particles with different energies is recorded by the particle detector at each energy channel. Therefore, it is not straightforward to decide which energy is characteristic for the corresponding energy channel. In practice, to avoid intricate calculations of the ef-fective energy in case of a power law spectral shape, the geometric mean is commonly used for calculations of such physical quantities as, for example, the energy density or the phase space density. In general, this approximation is con-sidered to be pretty good. However, it is not a priori clear to which extent it can be used. For wide energy channels,
the approximation is not necessarily always good. Also, soft spectral slopes can lead to significant deviations.
In this paper, we start by showing how the effective energy is derived for a power law spectrum. We then derive formulas that can be used to assess the goodness of the geometric-mean approximation for calculating the effective energy, the phase space density and the energy density.
This can be especially helpful for the cases of the wide en-ergy channels at soft power law spectral slopes. This method can be in particular applied to the energetic ion data from the Research with Adaptive Particle Imaging Detector (RAPID) instrument (see Wilken et al., 2001) onboard the Cluster satellites (Escoubet et al., 1997).
2 Effective energy
In practice what one measures is the integrated fluxJwithin an energy channel of limitsE1 andE2. The derived mean differential fluxj=J /1Ethen needs to be assigned to some energy value, which we callEeff, the effective energy. For a power law spectrum this value will be
J
E2−E1 =j (Eeff)=A·E
−γ
eff , (1)
whereγ is a spectral index and Ais a normalization. How does one calculate this energy? Here is a simple analysis. We consider a non-relativistical case in this study. The integrated flux is expressed as
J= E2
Z
E1
A·E−γdE= A γ−1
E1−γ+1−E2−γ+1. (2)
LetEm=(E2+E1)/2,1=(E2−E1)/2 and we denote δ= 1
Em
then Eq. (2) can be transformed to J
E2−E1
= A
γ−1·
(1−δ)−γ+1−(1+δ)−γ+1
2δ E
−γ m
≡A·Eeff−γ. (4)
Equation (4) leads to
E
eff
Em
−γ
=(1−δ)
−γ+1−(1+δ)−γ+1 2δ(γ −1)
'1+ γ (γ +1) δ 2
6 +. . . Eeff
Em '1−
(γ +1)δ2
6 +. . . (5)
The spectral indexγ can be estimated by using fluxes for two adjacent energy channels and their effective energies
γ = ln(j1/j2)
ln Eeff2/Eeff1. (6)
Let us look at an extreme case where the upper channel threshold is double the lower one (very wide channel). In this case, whereE2= 2E1,1=E1/2, and Em= 1.5E1, we getδ= 1/3. Requiring(γ +1) δ2/6<0.1 (i.e. 10 % accuracy inEeff), we obtain this accuracy whenγ <5.6, which is usu-ally the case. Thus the mean energy,Em is a good first ap-proximation of the effective energy,Eeff(i.e.Eeff'Em).
Therefore a first guess ofγ can be obtained from Eq. (6) usingEeff'Em, and then we can get a better estimate ofEeff from the last expression in Eq. (5) and iterate again.
It is also possible to estimate the effective energy in a simpler way assuming for example thatγ= 4 then calculate the Eeff using the last expression in formula (5). The esti-mations of the effective energy at different γ (2–6.5) and at δ= 1/3 show that the values of the effective energy are different from each other to within less than 10 %, namely Eeff/Em'(0.95−0.86). However, for wider channels this method cannot be used.
3 Effective energy and geometric-mean energy
One can see that the calculation of the effective energy is either time consuming and for every particle measurement we get different values or if using a simpler approximation it is not applicable for all cases.
An alternative is to use the geometric-mean energy Eg=
√
E1·E2as an approximation of the effective energy. This method is for example applied to generate a set of fixed conversion factors between differential flux and phase space density for the Cluster/RAPID particle data (see Kronberg and Daly, 2013).
The geometric-mean energyEgdefined above is in fact a good approximation to the effective energyEeff. Let us recast
Eqs. (2) and (4) in terms ofEg:
J
E2−E1 =A·E −γ eff
= A
E2−E1 Eg−γ+1
γ −1 ×
h
E1/Eg−γ+1− E2/Eg−γ+1 i
. (7) We simplify this by setting r2=E2/E1>1, from which E1=Eg/randE2=r Eg. Equation (7) then leads to
E
eff
Eg
−γ
= 1
γ −1
rγ−1−r−γ+1
r−r−1 →1 asr → 1. (8) In order to test how good the geometric-mean approx-imation is, we take once more the extreme example of E2= 2E1andγ= 4; now we haver=
√
2 and Eq. (8) yields Eeff/Eg= 0.96; this shows thatEgis a good estimate ofEeff even for this “extreme” case.
We now examine how different measured particle quanti-ties change when the geometric-mean approximation is used for their calculation.
4 Phase space density with geometric-mean energy
The differential flux of particles with velocityvis given by j (E, )dEd=f (v) v3dvd (9) where f (v) v2, dvd is the number of particles per unit volume with velocity between (vx, vy, vz) and (vx+dvx, vy+dvy, vz+dvz). From the Eq. (9) using relationship dE=mvdvwe get the standard relation between differential flux and phase space density
j = 2E
m2f (v). (10)
The phase space density can be written in units of km−6s3 as
f =m2 j Eeff
·0.53707, (11)
wheremis the particle mass in atomic mass units,jrecorded in cm−2s−1sr−1keV−1andEeff the effective energy of the energy channel in keV. Let us test if approximationEeff=Eg for the phase space density calculations of Cluster/RAPID measurements in Kronberg and Daly (2013) is good enough. Using Eq. (8), the deviation between the power-law phase space density and geometric-mean phase space density is
devf =f/fg=Eg/Eeff =
1
γ −1
rγ−1−r−γ+1 r−r−1
1/γ
.
4.1 Energy density with geometric-mean energy
Energy density,ε, for a finite channel should be
ε= E2
Z
E1
f Ed3v, (13)
wheref is the phase space density of particles with velocity v,E1andE2are the energy channel thresholds. The energy density expressed through the omnidirectional flux will be the following: ε= E2 Z E1 r m 2 √
E j (E)dEd=2π
r m 2 E2 Z E1 √
E j (E)dE, (14)
whereis the field of view. Here, phase space density,f, was converted into differential flux using Eq. (10). Therefore, the simple formula to calculate the energy density for the narrow energy channel will be
ε=π √
2m √
E j (E) 1E =π √
2mpEeffj (E) 1E. (15)
The problem which becomes critical in the case of wide energy channels is to decide what value ofEto use here. As mentioned in Sect. 3 for defining the effective energy,E,the geometric-mean energy,Eg=
√
E1·E2is often used, rather than a more precise definition from Sect. 2. The question is how reliable is this simplification, at which spectral slopes and energy channel widths is it appropriate to use and how to correct for this.
It is reasonable to assume that at, for example, RAPID energies (>30 keV), the differential fluxj=A·E−γ has a power law dependence on energy. Therefore,
ε=π √ 2m E2 Z E1 √
E A·E−γdE
=π √
2m A
γ −3/2
h
E1−γ+3/2−E2−γ+3/2i. (16)
Let us test how well this exact power-law formula compares with the “geometric-mean energy density” found by setting E→Eg andj (E)→J /(E2−E1)in Eq. (15). Recall that the measured mean differential fluxJ /(E2−E1)=A·E
−γ eff (from Eq. 4), is expressed in terms of the effective energy.
Again we use r2=E2/E1>1, and thenE1=Eg/r and E2=r Eg, Eq. (16) will take a form:
ε=π
√
2mAE −γ+3/2 g γ−3/2
h
E1/Eg−γ+3/2− E2/Eg−γ+3/2 i
=
n π
√
2mpEg
A·Eeff−γ
1E o
× 1
γ−3/2 Eg 1E Eg Eeff −γ
rγ−3/2−r−γ+3/2
=nπ
√
2mpEg(J /1E) 1Eo
× 1
γ−3/2
Eg Eeff
−γ
rγ−3/2−r−γ+3/2 r−r−1
=εg 1 γ−3/2
Eg Eeff
−γ
rγ−3/2−r−γ+3/2 r−r−1
. (17)
Hereεgis the geometric-mean energy density, from Eq. (15) withEgin place ofE=EeffandJ /1Eforj (E).
We now apply Eq. (8) and get the deviation devε between the power-law energy density and the geometric-mean en-ergy density:
devε =ε/εg=
γ −1 γ −3/2
rγ−3/2−r−γ+3/2
rγ−1−r−γ+1 . (18) Using our previous example of E2= 2E1 and γ= 4, Eq. (18) yields devε= 0.949.
Note thatr >1 and ideallyr→1 for a narrow channel. In this case devε→1. However, in case of wide energy channels or/and soft energy spectra one has to use the formula (Eq. 18) for calculation of the energy density deviation.
5 Example
In study of the ion abundance (O+/H+) in the terrestrial mag-netosphere by Kronberg et al. (2012) one of the aims was a comparison of Cluster/RAPID results to those from other missions. The energy density is commonly used for calcu-lations of the abundance ratios. Therefore, it was necessary to transfer the intensities used in the Kronberg et al. (2012) study in to energy density. There were doubts if one could use the geometric-mean approximation in this case as the width of the energy channels is large. Also protons and oxy-gen have different spectral slopes. Using Eq. (18) we are able to demonstrate the impact of this approximation.
We take an arbitrary plasma sheet crossing by Cluster SC4, for example, from 11:30 to 24:00 UT on 2 September 2007 and the aim is to calculate the mean energy density ratio, εO+/εH+.
Table 1. Energy spectral indexγ, effective energy, deviations of phase space density and energy density.
Species Energy range 1 Energy range 2 γ /γg Eeff1/Eg1 Eeff2/Eg2 f1/f1g ε1/ε1g f2/f2g ε2/ε2g
Protons 160–374 keV 374–962 keV 4.86/4.77 225/245 546/600 1.08 0.91 1.1 0.89 Oxygen 274–414 keV 498–638 keV 3.28/3.32 334/337 562/564 1.01 0.98 1.003 0.99
approximation. For the protons we used the energy channels at 160–374 and 374–962 keV and for the oxygen at 274– 414 and 498–638 keV. The deviations of the phase space den-sity and the energy denden-sity between those two methods (from Eqs. 12 and 18) are also calculated. The obtained values are listed in Table 1.
The geometric mean is a good approximation as the differ-ence between two methods for all quantities is less than 10 %. An exception is the 11 % deviation of the proton energy den-sity which is seen for the widest RAPID energy channel with E1= 374 andE2= 962 keV (r= 1.6).
In order to compare the proton and oxygen observations, which do not have the same energy range, we construct from channels above a wide energy channel with the same width for both species (274–∼955 keV), see detailed description in Kronberg et al. (2012).
Using Eq. (15) and the assumption that the effective en-ergy is calculated as the geometric mean, the enen-ergy density ratio of oxygen to protons will become a simple relation:
εO+
εH+
= π √
2mO·√Eeff·JO+1E π√2mH·
√
Eeff·JH
+
1E
= 4·J O+
JH+ . (19)
However, the energy channels are wide, the spectral indexγ is different for oxygen and protons (in this case it is not clear if one can use Eq. (19)), or the energy density ratioεO+/εH+
calculated in this way will significantly deviate from those which are based on the geometric-mean assumption.
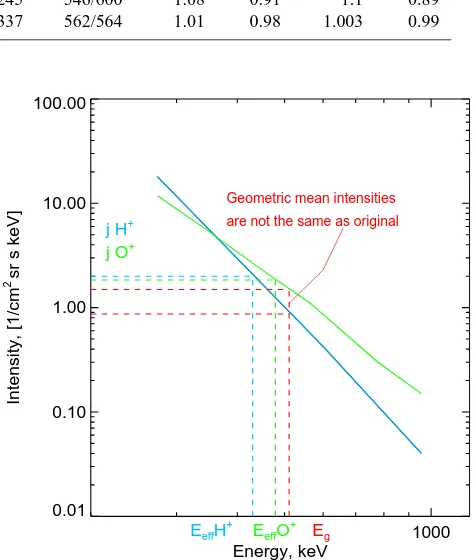
Assuming that the proton and oxygen distributions for the constructed wide energy channel have the same spectral slopes as derived above, we can estimate the deviation of the effective energy from the geometric-mean energy. Effective energy for the protons is 430 keV, for the oxygen 479 keV. These are∼15 % and∼8 % different from the geometric-mean energy, which is 511 keV. The corresponding energy spectra with denoted effective energies are shown in Fig. 1. The phase space density deviationf/fgis 1.17 and 1.08 for protons and oxygen, respectively. The energy density devi-ationε/εgis 0.83 and 0.89 for protons and oxygen, respec-tively. The deviation of the energy density ratioεO+/εH+due
to the different spectral slope of proton and oxygen in this ex-ample is 6 %.
Assuming the range ofγ= 2–4.5 for O+ andγ= 3.5–6.5 for H+ we get the spread of the deviations of the energy density ratio O+/H+up to 19 % with the mean value∼7 % which is less than the statistical error bar of the RAPID mea-surements. Therefore, the Eq. (19) can be used as an approx-imation of the energy density ratioεO+/εH+. For this spread
1000 Energy, keV
0.01 0.10 1.00 10.00 100.00
Intensity, [1/cm
2 sr s keV]
j H+ j O+
EeffH +
EeffO +
Eg
Geometric mean intensities
are not the same as original
Fig. 1. Mean energy spectra (274–955 keV) for the protons and oxygen for the time period from 11:30 to 24:00 UT on 2 Septem-ber 2007, observed by Cluster, SC4. The effective energy,Eg, based
on geometric-mean assumption and its corresponding proton and oxygen intensities are denoted by red colour. There is a mismatch between original intensities and intensities which correspond to the geometric-mean effective energy.
ofγ, the energy density deviates∼12–20 % for protons and ∼5–16 % for oxygen. The phase space density deviates∼9– 25 % for protons and∼0–15 % for oxygen.
6 Conclusions
Acknowledgements. We are grateful for the support and motivation Cluster Active Archive (CAA). We thank the Deutsches Zentrum für Luft und Raumfahrt (DLR) for supporting the RAPID instru-ment at MPS under grant 50 OC 1101.
Edited by: M. Taylor
References
Daly, P. W. and Kronberg, E. A.: RAPID Products at the Clus-ter Active Archive, in: The ClusClus-ter Active Archive, Studying the Earth’s Space Plasma Environment, edited by: Laakso, H., Taylor, M., and Escoubet, C. P., Springer, Dordrecht, Heidel-berg, London, New York, 145–158, doi:10.1007/978-90-481-3499-1_9, 2010.
Escoubet, C. P., Schmidt, R., and Goldstein, M. L.: Cluster – Sci-ence and Mission Overview, Space Sci. Rev., 79, 11–32, 1997. Kronberg, E. A. and Daly, P. W.: Calibration Report of the
RAPID Measurements in the Cluster Active Archive (CAA), Tech. Rep. CAA–EST–CR–RAP, available at: http://caa.estec. esa.int/documents/CR/CAA_EST_CR_RAP_v30.pdf, last ac-cess: 20 August 2013.
Kronberg, E. A., Haaland, S. E., Daly, P. W., Grigorenko, E. E., Kistler, L. M., Fränz, M., and Dandouras, I.: Oxygen and hy-drogen ion abundance in the near-Earth magnetosphere: Sta-tistical results on the response to the geomagnetic and solar wind activity conditions, J. Geophys. Res. Space, 117, A12208, doi:10.1029/2012JA018071, 2012.