https://dx.doi.org/10.24001/ijels.2.5.12 ISSN: 2456-7620
Watching T.V. and Playing Video Games and
their Relation to Children Obesity between the
Ages of (6:12)
Dr. Nermeen Singer
1, P.D. Ehab M. Eid
21Department of Media & Child culture, Ain Shams University, Cairo - Egypt
2Prof. of Public Health & Behavioral Medicine, Vice dean of Institute of Post-Graduate Childhood Studies Ain Shams
University
Abstract— Obesity of newly born children and adolescents increase all over the world. Although ratios are stable in some contexts, the number of children who suffer overweight and obesity in countries of low and medium income increases, compared with the number in advanced countries of high income.
The current study aims to investigate the practices of TV viewing and video games in a sample of children in the age group (6-12) from the point of view of their mothers, also examine the relationship of practices of watching TV and playing video games to increase the rate of childhood obesity.
The study sample consisted of (332) mothers of obese children in the age between (6-12) years to know their feedback on the role of TV viewing and playing video games in the incidence of childhood obesity.
A questionnaire was designed to collect information from mothers of children about TV viewing and playing video games related to child obesity by interviewing mothers of children. The results of the study showed that the percentage of watching TV and playing video games is 72% and the proportion of non-watching TV and video games is 28%, also we found that the mothers of children with obesity sits a large period of time in front of TV with their children, so the more hours of watching will lead to children obesity, because the viewer is always a negative recipient.
It shows that the children aptitude to have increases, with watching T.V. drama and food advertisements and also with video games. Focusing on watching makes them unconscious of what they eat and makes them greedy. The researcher, accordingly sees that it is important to give parents guides about supplying food during watching which has fatal tragic effects.
Keywords— Children Obesity, Playing Video Games, Relation, Watching T.V.
I. INTRODUCTION
Television plays an important role in children educational, social, psychological and healthy life through the programs which furnish them with a rich linguistic output and mental, and cognitive abilities and wide mental imagination. But at the same time it gives negative outputs if it is not used in the right way and its programs are not well chosen, as it might have negative effect on the child cognitive, educational, social, psychological and health state.
Television with its programs is one of the most important media sources which contribute to the shaping of cultural concepts of society and it is an effective means of acquiring social norms and linguistic patterns Education of children is no longer the responsibility of school and family only Other means are effective in qualifying and breeding of children.
Television has become one of the most important media in information evolution, as it has the advantages of word and image at the same time. It is also an attractive medium for young and old. A young girl expresses this by staling that her family consists of the father, the mother, the grandmother and T.V. (Adib khdour, 1990,36). This refers to the importance of television in furnishing children with positive virtues and mental awareness and its contribution in creating a better citizen for society and nation (Fergani Al Sayed,2012, 98).
Yet, it may also represents a negative power which creates an artificial world not less than that created by drugs and alcohol It may lead the individuate to live in a fake reality and create unreal motives and ambitious drives and a world of imagination.
https://dx.doi.org/10.24001/ijels.2.5.12 ISSN: 2456-7620
Television and its electronic programs, thus affect children who sit in-front of the screen in a passive way, surrendering to whatever content provided the children have no role in deciding or choosing what is on.
In view of this change in people's feelings and judgments, (FathyAlZayat,2001,5) sees that the real problem is that people are no longer able to avoid depending on T.V, educationally psychologically and socially. They might even depend on T.V in their basic needs. This area, thus, has become rich for scholars and researchers dealing with its impact on the different sides of the individual's personality.
In view of what is said above it becomes evident that young people of all ages spend from 3-4 hours of their day in following electronic media, which is more than any other time given to any other activity except sleeping. (Roberts & Foehr & Rideout,2005). A survey study (Richeout & hamel 2005) on children between 2002 to 2005 shows that 99% of American families have T.V sets, 97% have video players,83% have video games, 86% have computers, 70% of children between 8-18 have T.V sets in their rooms and 36% of young children between the age of 6 months and 6 years, also have T.V sets in their rooms.
The use of computers and video games increases to the ratio of 41% among young people between the age of 8 to 18, and they use them daily. The increase of obesity among children therefore, becomes a source of heart diseases and diabetes (Must et al, 1999) Children who have obesity become subject to much more suffering from blood pressure, cholesterol, fatly liver and bone deformity (Lobstein, Baur & Uauy, 2002).
More than 60% of children suffer from obesity and face the danger of heart diseases and early obesity may subject the child to whole life suffering, including early diabetes and late heart problems (Freedman et al, 1999). Obesity is also connected with the sense of self-sheltering and loneliness and under estimation of the self (Schmitz et al, 2002).
Obesity in childhood represents an increasing threat which affects the child health and endangers children to future problems. Children who suffer obesity will grow more as adults and studies show that 70% of children who have obesity will suffer overweight in their adolescence and maturity. The levels of activity decrease and the range they spend in front of T.V sets and video games ranges from 3- 6 hours a day. The problems of obesity aggravate with bad food habits and the unhealthy environment which does not encourage physical activities (Wane, Chins. shaker, Mother, 2009)
There is an increasing fear that obesity will spread across the world (Hossain, Kawar, Nahass, 2007) and its impact on health will be more serious, especially among poor and
rich countries (Wang, Lonstein, 2006 Wang Y, Chen HJ, Shaikh S& Mathur P., 2009)
The problem of obesity is subject to many variables during childhood. Television viewing is an important variable in this respect. It decreases physical activity, increases the consumption of electric power, reduces sleeping and leads to increase of consumption of propagated foods: calories increase during watching T.V (Maher olds, Eisenman, dolman, 2012).
A study on T.V viewing proves the close relation between watching T.V and bad health indicators at times of growing. Others are decrease of physical fitness, heart problems, smoking and increase of cholesterol and low study grades (Hancox RJ, Milne BJ & Poulton R., 2004, Viner, Cole 2005)
Jenvey, V. B. (2003) refers to the relation between practicing different electronic activities in different social contexts and the increase of obesity. This is also noticed by Wake and others (2003) who see a close relation between the times spent in computer games and internet and obesity. Most studies concentrate on the bad health results related to frequent watching of T.V at an early age. Obesity at early age is liable to continue during maturity (Must,2006) Children who suffer obesity enter stages of growing with 17% risk more than their equivalents who are in normal weight (Haener, 2004).
Estimates refer to the fact that 6% of the national income of the United States of America is spent on dealing with problems connected with obesity (Wolf, Coldest, 1998). The increase in the ratios of obesity during the last three decades affects health allocations and priorities in the 21st , century.
The increase in levels of obesity during childhood accelerated scientific research to understand reasons behind this increase. Part of the academic activity focused on the relation between the use of electronic media and obesity among children. There are three main outcomes of the supposed relation between obesity and electronic media:
1-Decrease of levels of food digestion and processing during T.V viewing.
2-Abandoning of physical activity.
3-Increase of calories as children spend much time with electronic media levels of obesity increase and the media become responsible for the spread of obesity among American youth. (Chen, J. L., & Kennedy, C. M., 2001, Dietz, 2001).
https://dx.doi.org/10.24001/ijels.2.5.12 ISSN: 2456-7620
It is accepted that increase of watching T.V affects physical activity at the time children are expected to do more activity which increases possibilities of obesity. Thus, it becomes clear that watching T.V is an important variable in children obesity (Al Farhati Al. Sayed, 2015).
II. METHODOLOGY 1. Research problem:
Obesity makes the health advantages that contribute to prolonging of age useless. In2014 estimates showed that about 41 million child under the age of five suffered obesity (UNCEF, 2015).
They represent the children who have recorded rates of standard variation between weight and length more than 2 and who have standard deviations in growth exceeding these stated by World Health Organization (WHO, 2006). Data collected from different parts of the world refers to increase in obesity rates in childhood in Australia (Baur, 2002) and China (Popkin et al, 2004). Reports of UNICEF reveal that there is an increasing ratio of obesity more than in the last three decades. In Arab world a sum of 105 million child, representing 38% of population, suffer from obesity. These children have facilities to watch T.V more than good education. Among them (8%) is one million child under the age of ten. These figures are terrible and make it necessary to put T.V programs and video game under close observation.
The effect of T.V varies from one stage to another, but its extreme effect is on children. American scholars call it the third father and the good father (Robert t Al, 2005) as it uses image and sound and attracts all visual and audio senses, this may last for more than two hours.
It is scientifically approved that what affects children is what addresses their senses. Children automatically respond to T.V material because it meets some psychological needs or carries information or take them far from stress (Freedman et al, 1999)
In a study about the ideal state of the child, it has been observed that children represent almost 50% of the Arab world population, and that modern life limits the role of family. Children indulge in following media whether proper or not to the age (Atef Adly, 1995). The study refers to two risks in directing children to media while mothers are busy. First, children watch T.V programs prepared to adults. Second, children sit alone in front of T.V which increases its effect. Children are not passive and they acquire all what is presented.
The problem of this paper is in following the relationship between the variables of obesity and T.V watching between the ages of 6-12 years.
The study focuses mainly on the variables which affect children obesity.
2. Study objective:
2.1 Following children T.V watching between (6-12)
from mothers’ point of view.
2.2 Investigating the relation between T.V watching and obesity.
2.3 Offering recommendations about right practices of T.V watching to reduce levels of obesity.
3. Study concepts:
3.1 T.V watching: the habits practiced by children during watching T.V. programs.
3.2 Children obesity: overweight children who exceed these of parallel age depending on World Heath. ratios; especially between (5-19) when deviation is more than two standards.
3.3 Overweight: when body weight exceeds the standard ratio with one standard variation depending on (WHO) standard.
3.4 Video Games: electronic games presented to children across T.V screens or CDS in the market.
4. Theoretical Framework: 4.1 Watching Television:
T.V is considered one of the impressive factors directing ideas and feelings of people and standardizes their customs and traditions. As thousands of people watch the same programs, T.V contributes to standardization of thoughts, beliefs, culture and taste and becomes one of the public means of creating culture.
T.V affects the children concept of education and enriches their information IT also shows The importance of success in life and encourages self-confidence, initial ambition and social mobility. Primary school pupils represent the group affected most especially these of average intelligence. Females are more affected than males. They are attracted to Fashion, and impressed when watching the suffering of others. (Abdel Rahman Al Esway, 1979,33).
Obviously, watching T.V is connected with the following practices in children:
4.1.1 It contributes to political education as it introduces concepts like imperialism, government, democracy, freedom, election, performance and ideas.
4.1.2 It develops patriotic feelings as it strongly affects the ideas and concepts which shape the vision of viewers towards the ruling regimes and propagates political ideologies (Mohamed Adel A2 ,2, 1989, 15), This gives T.V a special importance as a medium which directs sand shapes attitudes.
https://dx.doi.org/10.24001/ijels.2.5.12 ISSN: 2456-7620
life of ancestors and their struggle and values like care for body, environment, street, city and country, this is done through directed programs. (Saad Al . Orabi , 1997 , 14s).
4.1.4 T.V watching develops value of respect of work and manual labor. It also elaborates religious sprit and faith through documented religious programs (Ayman youssef,2002, 176).
4.1.5 T.V watching encourages dialogue with pairs without Violence and accepting the other. It also promotes team work through focusing upon journeys and games IT, furthermore, increases sense of responsibility towards public utilities and civilized behavior.
4.1.6 Watching T.V helps children to be ambitious where programs are prepared for different age stages, where children, like ascending a stair, aspire to higher degrees of achievement (Somaia Abdl-ELhadi, 1982, 7s).
4.1.7 Watching T.V creates the ability of taste and choice and enables the child to control the supplied material and give his opinion of its quality validity, attraction and how it meets his/her needs. This appears in attraction and interest in specific programs.
4.1.8 Watching T.V answers many of the questions related to space and planets running in the mind of children. T.V is considered the best medium to provide children with information and activate Their cultural concepts. It also stimulates their needs for knowledge from different sources. That is why it is very attractive to children. It offers knowledge in suspense and attraction. 4.2 T.V watching tradition and obesity:
Obesity is valued according to body mass indicators (BMI) where weight and length are measured. Weight is divided on length. The child who exceeds (25-30) mg is considered having obesity (code et al 2002).
A comparison of weight and length is carried according to world standards to have a comparison between different countries (Bar – Or, 2002). Other measures should be sought especially with the upper parts of the body, skin layers, muscles and fats (World Health Organization, 1995).
4.3 Results of watching T.V in obesity children: 4.3.1 Decreases metabolic rates:
This premise supposes that watching T.V reduces resting metabolic rates than in other activities. This means that use of less energy during T.V watching than in sleeping that consumed in activities like reading Studies (Klesges, shelton,1993) show that metabolic rates of children between 6- 12 during watching T.V is less than during
reading or sleeping. These results were given much interest in a study by (Buchowski and sun in 1996). 4.3.2 Deceased Activity level:
There is a close relation between the use of electronic media and children over weight, because of the time spent in watching or games. This is the base of the assumption of (couch potato). There is interference between the time spent in use of electronic media and the time of energy-consuming activities. This is the main premise which connects the effect of television on children obesity and applies also on video games and computers.
Other evidence indicate that things might not be like that. Some evidence reveal that the energy exerted in video games (even during silting) is more than that exerted in watching T.V or other activities like reading (Wang, X., & Perry, 2006).
Video games which require movement and activity only like dancing consume certain energy. Activities related to the screen affect life of children and adolescents.
If the time spent in activities is zero, the time spent in watching T.V has a negative effect on the time spent in physical activities. Thus T.V replaces other activities in what is called displacement effect (Mutz ,Roberts& Van Vuuren, 1993). It is noticed that practical investigation of displacement or what is called (trade-offs) requires a complete account of all the activities done by children in 24 hours, otherwise an estimation of the relation between activities exercised by the children is impossible (Vandewater, E. A., Bickham, D. S., & Lee, J. H.
“2006”).
Studies cite a decrease of sports activity of children and adults in several communities which have no television. The results of a number of studies show a close relation between watching television and video games and computer and physical activities of children and adolescents (Vilhjalmsson, R., & Thorlindsson, T. 1998) prove the presence of minor interference between the use of media and physical activity , while (Robinson & Killen 1995)do not see any relation between them .Following the child activities during the daily routine show that the relation between watching T.V and other activities in nil (Vandewater, E. A., Bickham, D. S., & Lee, J. H.
“2006”).
A study conducted by (Vandewater et al ,2006) finds a weak relation between the two, statistically between (0.03-) between the use of computer by adolescents and exercise of sports.
https://dx.doi.org/10.24001/ijels.2.5.12 ISSN: 2456-7620
insignificant. These researches arrived at a conclusion that the activity based on media share in unequal way with the epidemic drift to overweight and obesity among children and youth (marshal et al, 2004! 1238).
These results have important reflections on the idea that the use of media contributes to the spread of obesity in youth in the United States of America through its impact on physical activity. In view of the children who suffer from overweight, American children appear as not active enough. The question hence is about the role played by electronic media in creating this scene. The assumption is that if children are not watching T.V, playing video games or sit on computers they will be in or out football playground. However, evidence does not support this assumption. Watching T.V can replace other stable activities. This study sees that watching T.V has a direct relation with the decrease of the time spent in close places and the like (Vandewater,. Bickham & Lee, 2006) Others have also proved that watching T.V has a negative effect on activities of entertainment in close places (Huston et al, 1999).
Generally, practical evidence refer to the fact that the decrease of physical activity in not a main tool of electronic media in creating obesity in children.
4.3.3 Increased caloric intake:
The third assumption is related to electronic media use and the increase of caloric intake specially during watching T.V , or through electronic media which depend on marketing of food stuff and which tend to the support high caloric stuff and foods rich in fats (Tom 2006). Through following of eating foods during watching T.V and estimating of this experience, it has been found that in families where children have two meals or more in a day , they consume 6% more of meat , 5% of pizza ,snacks and soft drinks and 5% less of vegetables and juices.
4.4 Television food advertising:
Food comes next to cars in advertising in American economy (Mecall , 20),as more than 7 billion dollar were spent on since 1997(Harris, Kaufman, Martinez & Price, 2002).
Accordingly, the advertising of disserts, snacks and breakfast grains costs not less than (2,3,000,000) dollars. Ministry of agriculture spent 333 million dollars on education of nourishment (Gallo, 1999) Children are seen as a rising market on part of advertisers and adolescents are particularly addressed in U.S.A (story , french , 2004).Children of less than 14 years buy not less(14,000,000) dollars annually among(190,000,000) that represent family purchases. American advertisers spend one billion dollars, annually to address youth and T.V is their best means (Imo , 2006). More than 75% of food producers in U.S.A declare their budgets and more
than 75% of fast food restaurants directed to T.V (Gallo , 1999).
Space T.V channels attract large groups of population and help advertisers to reach consumers among them are children (Kunkel et al , 2004).
Indicators refer to the fact that food is one of the stuffs always advertised on T.V and it represents 50%of all advertisements (Story, Neumark-Sztainer & French, 2002 Taras , Gage , 1995).Commercial advertisements represent 16% of total watching time of children (Taras ,Guge , 1995).Indicators show that children are subjected to one food item advertisement every five minutes and they watch 3 hours of food advertisement weekly(Gamble&,cotunga,1999).
Advertisement of food stuffs clearly address children and intend to attract them to trademarks and become loyal to certain foods (Story, Neumark-Sztainer & French, 2002). Hite and Hite (1994) refer to the fact that pre-school age depend to a great extent on trademark to suite their taste and preferences in food. Foods of trademarks attract children more. Yong children, in fact depend more on trademark. children of (2-3) choose foods of trademarks with the ratio of (1-10), as one out of ten children prefer foods which have trademarks, and children between 4 to5 with the ratio of (1-2).
These results are noticed by marketers who usually develop their trademarks to attract youth (Zollo, 1999) and that 80% of food have trademarks, (Harris, Kaufman., Martinez., & Price, 2002).
Marketers know that children affect the attitude of their parents through these trademarks and trough what is called (nag factor) or (pester power) (mcNeal, 1998, Story, Neumark-Sztainer, & French,2002). Marketers also know that children demand certain trademark at age of two and 75% of the time of this demand in spent in the supermarkets. The most demanded food in breakfast is cereal 47% and soft drinks (30%), and game (21%) (McNeal, 1998).
Most advertisements on T.V are related to five categories known as (big 5):
- Breakfast rich in sugar.
- Soft drinks desserts.
- Desserts.
- Salted light meals.
- Fast foods and cooked food (Story, Neumark-Sztainer & French, 2002).
https://dx.doi.org/10.24001/ijels.2.5.12 ISSN: 2456-7620
macaroni. Desserts represent the great part of the food pyramid. A survey made in 2003 showed that fast foods and cooked foods represent 83% of the advertised food
“including desserts and soft drinks” (Harrison &
marske,2005). food represent a main line of advertising to children, and the advertised foods are doubted and weak. 4.5 Food advertising in other forms of media
Although there is no evidence that advertising of food decreased or that there are other methods for reaching children, Marketers endeavored to lake their market share. They tried to make use of the popularity of video games and internet. Sometimes the advertisement takes the shape of a story (Immigration organization, 2006). It is common to put the advertisement in a film, although putting food advertisement in directed programs is illegal. It is noticed that advertisements that come in peak time and films are directed to children and youth (Immigration organization, 2006).
5. The Researcher comment:
In view of what is said above the researcher suggests that the variables of T.V watching and video games are factors responsible for children obesity. The child receives sound and image without movement, which shapes the thread of obesity.
III. STUDY PROCEDURES 1 study sample:
The study sample comprises 332 mothers of children suffering from obesity at the age 6-12.
The study was conducted on mothers because it is difficult to apply the study on children at this age, in addition, mothers observe their children well and know their behavior.
It is the first field study which takes mothers as a sample to know their opinions of T.V watching and video games and how they cause obesity. The following time table represents the characteristics of the mothers:
Table.1: Characteristic of mothers of obesity Children
Functional Statistical Response Response age
Characteristic
% 63
21
Illiterate Education
% 63
231
Average qualification
%52
08
High qualified
20% 66
Years18-12 Age of mother
22% 73
Years 30-12
11%
23 30-35 Years
47% 157
40+
% 63
211
high Economic
% 14
230
average standard (level)
% 53
12
low
% 12
228
Upscale area Address
% 53 96
Medium-scale area
26% 76
Popular area
% 13
221 2
-3
No. of Children
% 52
11 4
-2
% 53
00
+2
% 23
214
Male Sex
% 14
230
Female
% 43
21
Pre-school Study
% 21
108
Primary stage
The table shows variation in characteristics of mothers, in education, illiterate mothers represent 36%, Average qualified mothers represent 39%, High qualified mothers represent 25%, for age 20% are between 20-25, 22% between 26-30, 11% between 30-35, 47% at 40 or more. As per initiative 39% come at the high level, 41% at the average and 29% at the lowest level. As for address, 45% live in rich areas ,29% in average areas and 20% in public areas. As for the number of the children in the family, 46% of mothers have from one to three children, 28% have four to five children and 27% have six children or more. As for the sex of children, 59% are males and 41% are females. As for School stages of children 16% are in the stage of Pre-school and 84% at primary stage.
2 Tools of Data collection
The question is designed in terms of data collected from following sources:
2.1 Analysis of some studies and references in media and children obesity.
2.2 Interviews with parents of children to get important information for the study.
2.3 Opinions and suggestions of teaching stuff. 2.4 Psychometric features of the tools.
2.5 Preparation of field questionnaire where academic steps and rules are followed in preparing the questionnaire:
2.5.1 Questionnaire stability:
For questionnaire stability, the method of re-application, is used where the tool is applied on 20 separate variable of the study sample and after a period of time re-applied on the same group are and the percentage is calculated. Ratio of agreement ranges from 80% to 28%is reliable.
2.5.2 Questionnaire reliability:
https://dx.doi.org/10.24001/ijels.2.5.12 ISSN: 2456-7620
members specialized in media, education, psychology and children studies. Referees in assured the reliability of questionnaire questions and validity of the study purpose. Some corrections were made.
3 Procedures of application: 3.1 Place of application.
3.2 Type of application (individual group). 3.3 Difficulties of application.
4 Method of Data analysis
As the questionnaire depends on calculations and questions, the researcher depend on the method of percentage in realizing the rate of the sample group.
IV. STUDY RESULTS AND ANALYSIS The researcher applied the questionnaire of the tradition of watching T.V and video games related to children obesity on the study sample through interviews with children mothers and encourages them to give correct information which will help them solving the problems of children obesity. Results come on follows:
1 T.V watching:
The following table shows the ratio of T.V watching and not watching according to children ages.
Table.2: Percentage of T.V watching
Child
re
n
T
.V
wa
tching
Ag
e
F
re
qu
ency
P
er
ce
nta
g
e
T
o
ta
l
fre
qu
ency
watching 6-8 8-10 10-12
52 105 80
16% 32% 24%
72%
Not watching
6-8 8-10 10-12
32 20 43
9% 6% 13%
28%
Fig.1: Percentage of T.V watching
From table (2) and fig (1) it is clear that 72% of the sample watch T.V The ratio of children watching T.V and practice video games at ages from 6-8 is 16% and from 8-18 is 32 %.The ratio of those not-watching T.V at ages from 6-8 is 9% and those not playing video games at ages from 8-10 is 6% and those not watching T.V at ages from 10-12 is 13%.
2 Watching time
The following table clarifies the percentages of Time spent by children Watching T.V per day.
Table.3: Watching time frequency
Percentage Frequency
age Watching Time
5 % 2
6-8 Less than an hour
5 % 3
8-10
4.1 % 1
10-12
2 % 4
6-8 From 1-2 hours
5 % 6
8-10
5 % 6
10-12
6 % 10
6-8 From 2-3 hours
3 % 20
8-10
7 % 26
10-12
2 % 16
6-8 From 3-4 hours
2 % 18
8-10
3 % 20
10-12
3 % 22
6-8 From 4-5 hours
7 % 28
8-10
2 % 30
10-12
3 % 40
6-8 Less than five
hours 8-10 41 %3
44 % 46
10-12 16%
32%
24%
9% 6%
13%
0% 5% 10% 15% 20% 25% 30% 35%
(6
-8)
Y
(8
-10
) Y
(1
0-1
2) Y
(6
-8)
Y
(8
-10
) Y
(1
0-1
2) Y
watching Not watching
Percentage of TV Watching
https://dx.doi.org/10.24001/ijels.2.5.12 ISSN: 2456-7620
Fig.2: Watching time frequency
The data of time Table (3) and fig (2) shows that children who have obesity spend more time in watching T.V and video games. At ages from 6-8 and (8-10)5% spend from 4:5 hours and from (10 -12) 6%. From 6:8 children spend on T.V and video games together 9% and from 10-12 10%.This shows that obesity increases with spending more time in watching T.V as children sit for a long time without exerting any effort. They remain passive and fats accumulate under skin increasing weight.
3 Children Excessive T.V Watching:
The researcher measured the variable of children at different ages, and the results come in the following table:
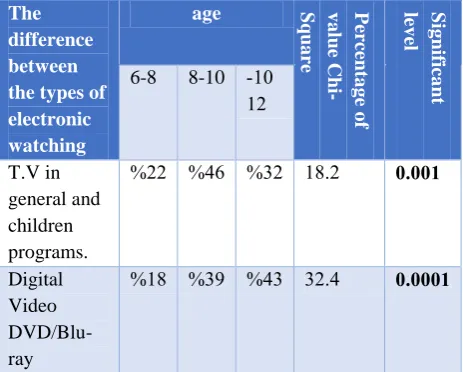
Table.4: Children excessive T.V watching
Sig nifica nt lev el P er ce nta g e o f v a lue C hi -Sq ua re age The difference between the types of electronic watching 28 -21 8-10 6-8 4.444 2081 31 % 42 % 11 % T.V in general and children programs. 4.4444 3184 43 % 31 % 20 % Digital Video DVD/Blu-ray 4.444 2332 33 % 22 % 21 % Electronic games
Fig.3: Children excessive T.V watching
Table (4) and fig (3) shows variations among the age groups in type of electronic watching. Results show that children between (8–10) spend more time in watching T.V then comes children between (10-12) and at last the children between (6-8).As for watching of electronic digital videos (DVD/Blu-ray) children between (10-12) come first followed by those at ages between (8-10). 4 Having foods during electronic watching:
The researcher measured the variation among age levels in having food during playing electronic games, watching CDS and different T.V programs, and the results come in the following table:
Table.5:Food habits during playing electronic games, digital and T.V watching
Sig nifica nt lev el P er ce nta g e o f v a lue Chi -Sq ua re age Food habits during playing electronic games, digital and T.V watching 28 -21 0-10 6-8 4.444 1382 34 % 21 % 24 % Have food during 4.4444 3284 28 % 48 % 28 %
Do not have food during
2 3 1 4
6 6 10 20 26 1618 2022 2830 40 41 46 0 5 10 15 20 25 30 35 40 45 50 (8 -10 ) Y (6 -8) Y (1 0-1 2) Y (8 -10 ) Y (6 -8) Y (1 0-1 2) Y (8 -10 ) Y (6 -8) Y (1 0-1 2) Y Less than an hour from 1-2 hours from 2-3 hours from 3-4 hours from 4-5 hours Less than 5 hours
Watching Time Frequency
Frequency 22% 18% 12% 46% 39% 51% 32% 43% 37% 0% 10% 20% 30% 40% 50% 60%
Children Excessive TV Watching
(6-8) Y
(8-10) Y
https://dx.doi.org/10.24001/ijels.2.5.12 ISSN: 2456-7620
Fig.4:Food habits during playing electronic games, digital and T.V watching
Table (5) and fig (4) shows variation among age levels in having food during watching between (8-10) who represent the highest rate followed by the ages from (10-12).
5 No. of meals during watching T.V:
The researcher measured the indicating variation in percentage of meals during watching T.V and video games, and the results come in the following table:
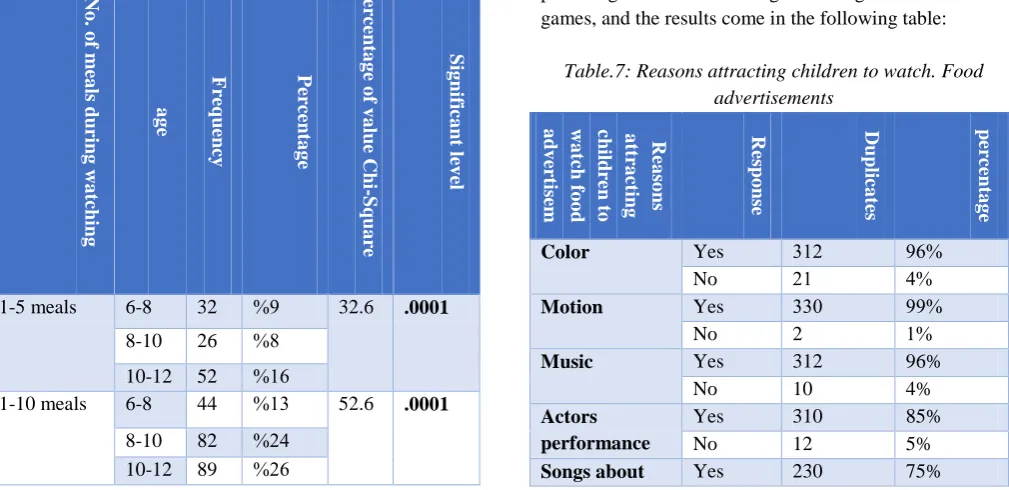
Table.6: No. of meals during watching T.V
Sig
nifica
nt
lev
el
P
er
ce
nta
g
e
o
f v
a
lue C
hi
-Sq
u
a
re
P
er
ce
nta
g
e
F
re
qu
ency
age
No
. o
f mea
ls
du
ring
wa
tching
.0001 32.6
1 %
32 6-8 1-5 meals
0 %
26 8-10
22 %
52 10-12
.0001 52.6
23 %
44 6-8 1-10 meals
14 %
82 8-10
12 %
89 10-12
288 %
332 TOTAL
Fig.5: No. of meals during watching T.V
Data of table (6) shows that there are indicating variation in percentage of meals during watching T.V and video games from 1-5 meals at ages between 10-12 followed by 6-8 meals from (1-10) variation was clear for ages from 10-12 followed by ages from 8-10 and 6-8 this shows that this class is the top one in having meals during T.V watching and electronic games.
6 Elements attracting children during watching T.V food advertisements:
The researcher measured the indicating variation in percentage of meals during watching T.V and video games, and the results come in the following table:
Table.7:Reasons attracting children to watch. Food advertisements
Rea
so
ns
a
tt
ra
ct
ing
child
re
n t
o
wa
tch
fo
o
d
a
dv
er
tis
em
ent
s
Respo
ns
e
Dupl
ica
tes
perc
ent
a
g
e
Color Yes 321 12%
No 12 4%
Motion Yes 338 11%
No 2 2%
Music Yes 312 96%
No 10 4%
Actors performance
Yes 310 85%
No 12 5%
Songs about Yes 230 75%
14%
52%
34%
10%
40%
50%
0% 10% 20% 30% 40% 50% 60%
(6-8) Y (8-10) Y (10-12) Y
Food habits during playing electronic
games, digital and TV watching
Have food
Do not have food
9% 8%
16% 13%
24% 26%
0% 5% 10% 15% 20% 25% 30%
(6-8) Y (8-10) Y (10-12) Y
(6-8) Y (8-10) Y (10-12) Y
1-5 meal 1-10 meal
https://dx.doi.org/10.24001/ijels.2.5.12 ISSN: 2456-7620
food No 102 25%
Audio effects Yes 203 72%
No 120 28%
Fig.6: Reasons attracting children to watch. Food advertisements
Table (7) and fig (6) shows that the value k and the relative value of what is on. Advertisements motion comes first followed by music and then color. Scholars prove that children are highly affected by color motion and music.
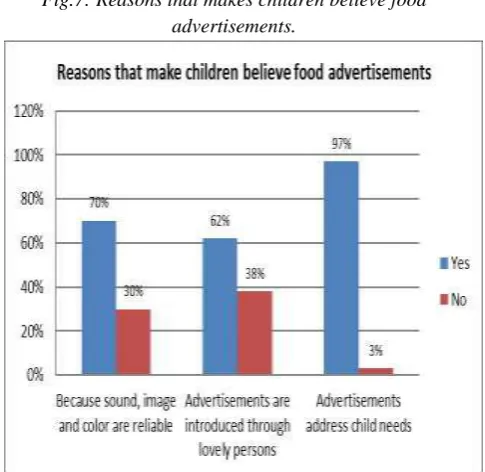
7 Reasons that make children believe food advertisements during watching:
The researcher measured the relative variation and the value k in believing in food advertisements that the advertisement address child needs comes first, and the results come in the following table:
Table.8:Reasons that makes children believe food advertisements.
Percentage Frequency
Response Reasons
makes children believe food advertisements
% 74
124
Yes Because sound,
%64
282
No image and color are reliable
% 35
128
Yes Advertisements are introduced through lovely persons
%38
288
No
% 37
328
Yes Advertisements address child needs
% 6
28
No
Fig.7:Reasons that makes children believe food advertisements.
Table (8) and fig (7) shows the relative variation and the value k in believing in food advertisements that the advertisement address child needs comes first. It also shows that image and color have great effect. This shows the priorities OF their needs which take them to obesity.
8 Children interest in food after watching advertisements:
The researcher measured the variation in number of children keen to buy directly after advertisement, and the results come in the following table:
Table.9:Interest to buy food after watching advertisement.
96% 99% 96%
85%
75% 72%
4% 1% 4% 5%
25% 28%
0% 20% 40% 60% 80% 100% 120%
Reasons attracting children to watch
Food advertisements
Yes
https://dx.doi.org/10.24001/ijels.2.5.12 ISSN: 2456-7620
Fig.8:Interest to buy food after watching advertisement.
Table (9) and fig (8) shows variation in number of children keen to buy directly after advertisement. IT shows that the need for the food advertised increases after watching the advertisement. This may due to age of the children addressed and their inability to delay their biological needs.
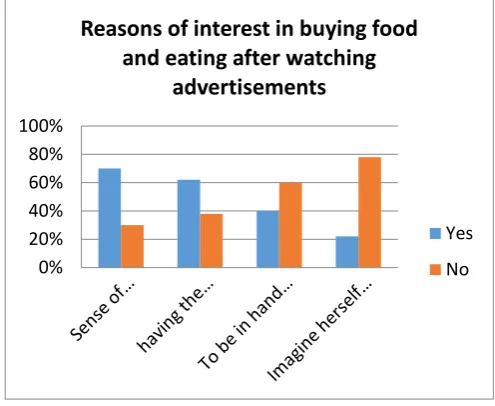
9 Reasons for interest in buying foods and eating after watching advertisement on electronic sources:
The researcher measured the real variations in reasons of interest in buying foods after watching advertisement, and the results come in the following table:
Table.10:Reasons of interest in buying food and eating after watching advertisements
P
er
ce
nta
g
e
F
re
qu
ency
Respo
ns
e
Rea
so
ns
o
f inte
re
st
in
bu
y
ing
f
o
o
d a
nd
ea
ting
a
ft
er
wa
tching
a
dv
er
tis
ement
s
70% 160
Yes Sense of
happiness No 85 30% 62% 174
Yes having the
advertised articles
38% 50
No
40% 112
Yes To be in hand when newly advertised
60% 187
No
22% 62
Yes Imagine
himself/herself in place of the actor after buying
78% 220
No
Fig.9: Reasons of interest in buying food and eating after watching advertisements.
Table (10) and fig (9) shows real variations in reasons of interest in buying foods after watching. The sense of happiness comes first followed by believing in what is advertised and at last possession of the article when the advertisement comes again.
10 Encouraging parents to watch food advertisements and eating on electronic media (T.V):
The researcher measured the variation in encouraging parents to watch food advertisements on electronic sources, and the results come in the following table:
Table.11:Parents encouraging their children.
10% 14%
16% 13%
22%
32%
0% 10% 20% 30% 40%
(6-8) Y (8-10) Y (10-12) Y
Interest to buy food after watching
advertisement
Children keen to buy directly
Children not interested
0% 20% 40% 60% 80% 100%
Reasons of interest in buying food
and eating after watching
advertisements
Yes
No
Sig
nifica
nt
lev
el
P
er
ce
nta
g
e
o
f
v
a
lue C
hi
-Sq
ua
re
Age
28 -21
8-10 6-8
4.4444 15.4
16% 14% 10% Children
keen to buy directly
4.4444 18.9
32% 22% 13% Children
https://dx.doi.org/10.24001/ijels.2.5.12 ISSN: 2456-7620
Sig
nifica
nt
lev
el
P
er
ce
nta
g
e
o
f v
a
lue
Chi
-Sq
ua
re
age
10-12 8-10
2 -0
4.4444
2281 22 % 21 % 24 %
Encourage their children
4.4444
2280 12 % 20 % 22 %
Do not encourage their children
Fig.10:Parents encouraging their children.
As for encouraging parents to watch T.V advertisements, results show that ages from (8-10) represent the highest encouragement followed by (10-12) then (6-8).
11 Times of Watching T.V:
The researcher measured the variation in times of T.V watching among different age levels, and the results come in the following table:
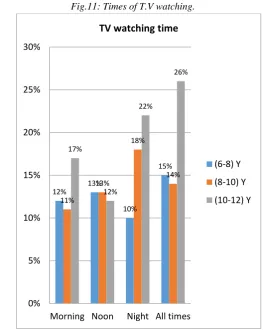
Table.12:Times of T.V watching.
Sig
nifica
nt
lev
el
P
er
ce
nta
g
e
o
f v
a
lue
Chi
-Sq
ua
re
age
T
ime
s o
f T
.V
wa
tching
10-12 8-10 6-8
4.4444 12.5
17% 11% 12% Morning
4.4444 11.2
12% 13% 13% Noon
4.4444 16.8
22% 18% 10% Night
4.4444 22.4
26% 14% 15% All
times
Fig.11:Times of T.V watching.
Table (12) and fig (11) shows that T.V watching in the morning affects Ages from 10-12 then 8-10 at last 6-8.In the evening, it affects ages from 8-10 and 6-8.ages between 10-12 and 8-10 are accordingly affected at all time.
14%
19%
16% 16%
18%
25%
0% 5% 10% 15% 20% 25% 30%
(6-8) Y (8-10) Y (10-12) Y
Parents encouraging their children
Encourage their children
Do not
encourage their
children 12%
13%
10%
15%
11%
13%
18%
14% 17%
12%
22%
26%
0% 5% 10% 15% 20% 25% 30%
Morning Noon Night All times
TV watching time
(6-8) Y
(8-10) Y
https://dx.doi.org/10.24001/ijels.2.5.12 ISSN: 2456-7620
12 Influence of watching and fast food orders: The researcher measured the variation of influence of watching on children and fast food orders, and the results come in the following table:
Table.13: Influence of watching and fast food orders.
Sig nifica nt lev el P er ce nta g e o f v a lue C hi -Sq ua re age Is the child affected by watching T.V asks fast food? 10-12 8-10 6-8 4.4444 24.1 18% 16% 14% Yes 4.4444 12.3 14% 18% 11% Sometimes 4.4444 22.1 10% 20% 10% No
Fig.12: Influence of watching and fast food orders:
It becomes clear from table (13) the presence of important variations among different age levels. Children between 10-12 are most affected and motivated to by foods, followed by ages from 8-10 and then from 6-8.
13 Parents watching of advertisements with their children:
The researcher measured the variation in parents watching of T.V advertisements with their children, and the results come in the following table:
Table.14: Percentage of parents watching of advertisements with children.
Sig nifica nt lev el P er ce nta g e o f v a lue Chi -Sq ua re age Percentage of parents watching of 10-12 8-10 6-8 advertisements with children 4.4444 1482 54% 12% 18% Watch with them 4.4444 2183 34% 32% 36% Do not watch
with them
Fig.13:Percentage of parents watching of advertisements with children.
The table (14) shows that the majority do not share their children watching food advertisements. 312 of the sample (96%), do not watch and 20 (4%) watch. Thus, the majority do not realize the influence of watching on them children.
These results agree with Nowadays, food marketers interested in children and youth as customers, and they try to affect their food choice, food preference and eating habits. Children are a particularly rewarding target group for marketing and advertising in view of their greater responsiveness and lack of experience and critical thought, and also thanks to the opportunity of indirectly influencing adult consumers through their children. Eating habits has a severe impact on health. And the patterns it results in high intake of low nutritional food and low intake of fruit and vegetables are linked to some health problems such as obesity and those children who intake more food and cola drinks while watching T.V suffers from health problems.
14 Children physical activity during T.V watching: The researcher measured the variation in children physical activity during T.V watching, and the results come in the following table:
Table.15:physical activity during watching.
Sig nifi ca nt lev el P er ce nta g e o f v a lue Chi -Sq ua r e age ph y sic a l a ct iv it y du rin g wa tchi ng 14% 16% 18% 11% 18% 14% 10% 20% 10% 0% 5% 10% 15% 20% 25%
(6-8) Y (8-10) Y (10-12) Y
Is the child affected by watching TV and
ask for fast food?
Yes Sometimes No 18% 12% 54%
36% 32% 34%
0% 20% 40% 60%
(6-8) Y (8-10) Y (10-12) Y
Parents watching advertisement with
their children
Watch with them
https://dx.doi.org/10.24001/ijels.2.5.12 ISSN: 2456-7620
10-12 8-10
6-8
4.444
3284
50%
22 % 34 %
practice physical activity
4.4444
3284
29%
48 % 32 %
Do not practice physical activity
Fig.14: physical activity during watching.
Table (15) and fig (14) shows variation in physical activity during watching among age of (6-8), (8-10) and (10-12). Children between (10-12) suffer obesity for not practicing physical activity.
V. CONCLUSION
From the data of the tables based on response of children mothers to obesity, it becomes clear that children tend to
watch T.V and video games: This is closely related to obesity and overweight. It is remarkable that the researcher focus on parent, of children suffering obesity especially at ages from 6-12, as the children themselves might not understand the questions. In addition, they avoid questions about their obesity and overweight. The study reaches certain conclusions investigated through an academic approach and in terms of social rules and tradition. The conclusions take into consideration the results of the previous studies.
- First: The present study reveals that the education level of the mother plays an important role in her awareness of the danger of T.V and video games on obesity. The ratio of illiterate mothers of children of obesity is obviously high. Some mothers, in this respect, believe that child having of much food is a sign of good health. Accordingly, the increase of weight becomes as indicator of good health. On the contrary, mothers of high education level warned their children against eating during watching T.V. The researcher, in this sense, suggests training courses for mothers of obesity to be furnished with information and medical knowledge about the dangers of obesity and on how to control times of watching and its bad effects. Changing mother’s attitudes and behavior will have direct positive reflections on education and bringing up of children.
- Second: The study shows that the children aptitude to have increases, with watching T.V. drama and food advertisements and also with video games. Focusing on watching makes them unconscious of what they eat and makes them greedy. Calories increase and with sitting for long times energy is not consumed. The researcher, accordingly sees that it is important to give parents guides about supplying food during watching which has fatal tragic effects.
- Third: Indicators of the present study show that high ratios of children who suffer obesity sit in front of T.V alone without any guidance from mature elders. This pushes them to eat and drink much. The researcher, accordingly, suggests the presence of one of the parents, or a brother representing an element of control that restricts the children greed for eating.
- Fourth: The results of the study also shows that high ratios of the children who suffer obesity have a very low sports activity. This is a natural outcome of the long time spent in front of T.V. Energy is not consumed and calories are not burnt. This requires a plan for sports activities on the part of parents.
In this study the researcher reaches the following conclusions:
1. Obesity of newly born children and adolescents 34%
16%
50%
31%
40%
29%
0% 10% 20% 30% 40% 50% 60%
(6-8) Y (8-10) Y (10-12) Y
Practicing Physical activity during
watching
Practice physical activity
https://dx.doi.org/10.24001/ijels.2.5.12 ISSN: 2456-7620
increase all over the world. Although ratios are stable in some contexts, the number of children who suffer overweight and obesity in countries of low and medium income increases, compared with the number in advanced countries of high income. 2. Obesity may affect the children health and their
education and also the quality of life. Suffering is expected to continue when they reach maturity. They may even suffer chronic diseases.
3. Many children grow up in an environment which encourages obesity, and the problem of energy disorder id due to the changes in types of food, their availability, their low prices, and their marketing. It is also an outcome of the decrease in physical activity, and spending much time in leisure activities in front of the screens.
4. The behavioral and biological responses to the environment of obesity can be structured through certain measures that even happen before birth. This increases the number of children approaching obesity when subjected to unhealthy food system and decrease of physical activity.
5. Carrying out of a program that increases healthy foods and decreases the use of unhealthy and drinks with sugar.
6. Securing the preparation of and circulation of information and guidelines about the suitable nourishment addressed to both children and adolescent. Directions must be simple, accessible to all social groups.
7. Carrying out of recommendations related to non-alcoholic drinks used by children to secure them against the marketing of unhealthy food and its power and stating the characteristics of unhealthy foods and drinks.
8. Applying a system of labeling on the cover of food boxes, to furnish children with the culture of nourishment.
9. Asking schools, children care society’s private sports gatherings to secure data about healthy food s and make healthy foods and make healthy ones available.
10. Securing guidance to children, parents mothers, teachers, healthy bodies, physical activity, sleeping behaviors and suitable entertainment in front of screens.
11. Securing enough utilities in school buildings and public places for physical activities during leisure time.
REFERENCES
[1] Abdel-Rahman Essawy (1979): Psychological and Social Impacts of Arab Television, Cairo, Egyptian General Book Organization.
[2] Abdullah Oweidat and Zahran Badan (1996): The Effect of Television Observation and Duration on the Academic Achievement of the Fourth, Fifth and Sixth Grade Students in Jordan, Journal of Educational Studies, Volume 23 Issue2.
[3] Adib Khadour (1990): TV, translated by a group of researchers, without publisher, Damascus, first edition.
[4] Ali Ajwa (1985): Media and Culture Issues in Egypt "in" Studies in Public Relations and Media, The World of Books, Cairo.
[5] Bar-On., F, J., Bouchard, C., Brownell, K. D., Dietz, W. H., Ravussin, E., et al. (1998). Physical activity, genetic and nutritional considerations in childhood weight management. Medicine and Science in Sports and Exercise, 30, 2–10.
[6] Borzekowski D, Robinson TN(2001). The 30 second effect: an experiment revealing the impact of television commercials on food preferences of preschoolers. J Am Diet Assoc 2001;101:42–6 [7] Buchowski, M. S., & Sun, M. (1996). Energy
expenditure, television viewing and obesity. International Journal of Obesity and Related Metabolic Disorders, 20, 236–44.
[8] Chen, J. L., & Kennedy, C. M. (2001). Television
viewing and children’s health. Journal of Science
and Pediatric Nursing, 6, 35–8.
[9] Coon K, Goldberg J, Rogers B, Tucker K (2001). Relationships between use of television during
meals and children’s food consumption patterns.
Pediatrics 2001;107: Internet:
http://pediatrics.aappublications.
org/cgi/content/full/107/1/e7. (accessed 15 October 2003).
[10]Davison, K. K., Marshall, S. J., & Birch, L. L. (2006). Cross-sectional and longitudinal associations
between TV viewing and girls’ body mass index,
overweight status, and percentage of body fat. Journal of Pediatrics, 149, 32–7.
[11]El-farhatei , el-sayed, Mahmoud (2002): positive psychology for child , new dar university , elexandria
[12]Fathi Mustafa El-Zayat (2001): The impact of children's addiction to television on their mental and cognitive development, and some other developmental characteristics, the course of child development in cultural reform, the center of childhood studies, Ain Shams University.
https://dx.doi.org/10.24001/ijels.2.5.12 ISSN: 2456-7620
[14]Freedman, D. S., Dietz, W. H., Srinivasan, S. R. & Berenson, G. S. (1999) The relation of overweight to cardiovascular risk factors among children and adolescents: The Bogalusa heart study. Pediatrics, 103, 1175–1182.
[15]French S, Story M, Neumark-Sztainer D, Fulkerson J, Hannan P. (2001) Fast food restaurant use among adolescents: associations with nutrient intake, food choices and behavioral and psychosocial variables. Int J Obes Relat Metab Disord;25:1823–33.
[16]Gallo, A. E. (1999). Food advertising in the United
States. America’s eating habits: Changes and consequences (No. 811). Washington, DC: US Department of Agriculture Economic Research Service
[17]Gamble, M., & Cotunga, N. (1999). A quarter century of TV food advertising targeted at children. American Journal of Health Behavior, 23, 261–7. [18]Hancox RJ, Milne BJ & Poulton R. (2004)
Association between child and adolescent television viewing and adult health: a longitudinal birth cohort study. Lancet 364: 257–262.
[19]Harris, J. M., Kaufman, P., Martinez, S., & Price, C. (2002). The US food marketing system, 2002 (No. 811). Washington, DC: US Department of Agriculture Economic Research Service.
[20]Harrison, K., & Marske, A. L. (2005). Nutritional content of foods advertised during the television programs children watch most. American Journal of Public Health, 95, 1568–74.
[21]Hite, C. F., & Hite, R. E. (1994). Reliance on brand by young children. Journal of the Market Research Society, 37(2), 185–93.
[22]Hossain P, Kawar B&Nahas M. (2007) Obesity and diabetes in the developing world – a growing challenge. N Engl J Med 356: 213–215.
[23]Huston, A. C., Wright, J. C., Marquis, J., & Green, S. B. (1999). How young children spend their time: Television and other activities. Developmental Psychology, 35, 912.
[24]Institute of Medicine (IOM). (2006). Food marketing to children and youth: Threat or opportunity? Washington, DC: National Academies Press.
[25]Jenvey, V. B. (2003) Australian children’s play and toy preferences, 1989–1995: age, gender and contextual influences, in: L. E. Berg, A. Nelson & K. Svensson (Eds) Toy Research in late twentieth century: toys in educational and sociocultural contexts (Stockholm, SITREC, Swedish Institute of Technology Press), 105–121.
[26]Klesges, R. C., Shelton, M. L., & Klesges, L. M. (1993). Effects of television on metabolic rate:
Potential implications for childhood obesity. Pediatrics, 91(2), 281–6.
[27]Kunkel, D., Wilcox, B. L., Cantor, J., Palmer, E., Linn, S., & Dowrick, P. (2004). Report of the APA task force on advertising and children. Washington, DC: American Psycho-logical Association.
[28]Larson, R. W. & Verma, S. (1999) How children and adolescents spend time across the world: work, play and developmental opportunities, Psychological Bulletin, 125, 701–736.
[29]Lobstein, T., Baur, L., Uauy, R. (2005). Obesity in children and young people: A crisis in public health. Report to the World Health Organization by the International Obesity Task Force. Obesity Reviews, 5 (Supplement 1), 5–104
[30]Maher C, Olds TS, Eisenmann JC &Dollman J. (2012) Screen time is more strongly associated than physical activity with overweight and obesity in 9- to 16- year-old Australians. Acta Paediatr 101: 1170–1174.
[31]McNeal, J. (1998). Tapping the three kids’ markets. American Demographics, 20(4), 37–41. Must, A. (1996). Morbidity and mortality associated with elevated body weight in chil-dren and adolescents. American Journal for Clinical Nutrition, 63(Supplement 3),445S–447S.
[32]Mohamed Abdel-Alim Morsy (1994): Some negative values that lie behind some of the programs of foreign direct TV broadcasting, the role of education in the face of the negative effects expected for direct foreign television broadcasting, the Arab Bureau of Education for the Gulf States, Riyadh (17-18 October).
[33]Moniek B., Joris S & Elise B (2008), Associations
Between Children’s Television Advertising Exposure and Their Food Consumption Patterns: A Household Diary—Survey Study, 50 APPETITE 231
[34]Must, A. (1996). Morbidity and mortality associated with elevated body weight in chil-dren and adolescents. American Journal for Clinical Nutrition, 63(Supplement 3),445S–447S.
[35]Must, A., Spadano, J., Coakley, E. H., Field, A. E., Colditz, G., & Dietz, W. H. (1999). The disease burden associated with overweight and obesity. Journal of the American Medical Association, 282, 1523–9.
[36]Mutz, D. C., Roberts, D. F., & van Vuuren, D. P. (1993). Reconsidering the displacement hypothesis:
Television’s influence on children’s time use.
Communication Research, 20,
https://dx.doi.org/10.24001/ijels.2.5.12 ISSN: 2456-7620
Index in US Children and Adolescents 2007-2008. Journal of American Medical Association, 303(3), 242-249.
[38]Popkin BM& Gordon-Larsen P. (2004) The nutrition transition: worldwide obesity dynamics and their determinants. Int J Obes Relat Metab Disord 28 Suppl 3: S2–9.
[39]Rideout, V. J., & Hamel, E. (2006). The media family: Electronic media in the lives of infants, toddlers, preschoolers and their parents. Menlo Park, CA: Kaiser Family Foundation.
[40]Roberts, D. F., Foehr, U. G., & Rideout, V. J. (2005). Generation M: Media in the lives of 8 – 18-year-olds. Menlo Park, CA: Kaiser Family Foundation.
[41]Robinson T ,N (2001). Television viewing and childhood obesity. Pediatr Clin North Am 2001;48:1017–1025.
[42]Robinson, T. N. (2001). Television viewing and childhood obesity. Childhood and adolescent obesity, 48(4), 1017–25.
[43]Robinson, T. N., & Killen, J. D. (1995). Ethnic and gender differences in the relation-ships between television viewing and obesity, physical activity, and dietary fat intake. Journal of Health Education, 26, S91–S98.
[44]Smith , R , A (1977) : The Effects Of Various Dimensions Of Prosocial Television Program On 5- 7 Years Old S Prosocial Behavior , Peabody College For Teachers , D.A.I V (38) (5- B) Nov
[45]Story, M., & French, S. (2004). Food advertising and marketing directed at children and adolescents in the US. International Journal of Behavioral Nutrition and Physical Activity,1.Retrieved from http://www.ijbnapa.org/content /l/l/3.
[46]Story, M., Neumark-Sztainer, D., & French, S. (2002). Individual and environmental influences on adolescent eating behaviors. Journal of The American Dietetic Association, 102, S40–S51. [47]Taras ,e ,m Kotz, K., & Story, M. (1994). Food
advertisements during children’s Saturday morning
television programming: Are they consistent with dietary recommendations? Journal of The American Dietetic Association, 94(11), 1296–301.
[48]Taras, H. L., & Gage, M. (1995). Advertised foods
on children’s television. Archives of Pediatric and
Adolescent Medicine, 149, 649–52.
[49]UNICEF, WHO, World Bank. Levels and trends in child malnutrition: UNICEF-WHO-World Bank joint child malnutrition estimates. UNICEF, New York; WHO, Geneva; World Bank, Washington DC: 2015.
[50]Vandewater, E. A., Bickham, D. S., & Lee, J. H. (2006). Time well spent? Relating media use to
children’s free-time activities. Pediatrics, 117, e181– e185.
[51]Vilhjalmsson, R., & Thorlindsson, T. (1998). Factors related to physical activity: A study of adolescents. Social Science Medical, 47(5), 665–75. [52]Viner RM& Cole TJ. (2005) Television viewing in
early childhood predicts adult body mass index. J Pediatr 147: 429–435.
[53]Wake, M., Hesketh, K., & Waters, E. (2003). Television, computer use, and body mass index in Australian primary school children. Journal of Pediatrics and Child Health, 39, 130–34.
[54]Wang Y & Lobstein T. (2006) Worldwide trends in childhood overweight and obesity. Int J Pediatr Obes 1: 11–25.
[55]Wang Y, Chen HJ, Shaikh S& Mathur P. (2009) Is obesity becoming a public health problem in India? Examine the shift from under- to over nutrition problems over time. Obes Rev 10: 456–474.
[56]Wang, X., & Perry, A. C. (2006). Metabolic and physiologic responses to video game play in 7- to 10-year-old boys. Archives of Pediatric and Adolescent Medicine, 160, 411–15.
[57]WHO Multicentre Growth Reference Study Group. WHO child growth standards based on length/height, weight and age. Acta Paediatr. 2006;Suppl 450:76–85.
[58]Wolf, A., & Colditz, G. A. (1998). Current estimates of the economic cost of obesity in the United States. Obesity Research, 6, 97–106.
[59]Zollo, P. (1999). Wise up to teens: Insight into marketing and advertising to teenagers (2nd edn.). Ithaca, NY: New Strategist Publications, Inc. [60]Robinson TN, Killen J(2001). Obesity prevention