1535-9778/08/$08.00⫹0 doi:10.1128/EC.00073-08
Copyright © 2008, American Society for Microbiology. All Rights Reserved.
Expression Quantitative Trait Locus Mapping of
Toxoplasma
Genes Reveals Multiple Mechanisms for Strain-Specific
Differences in Gene Expression
䌤
Jon P. Boyle,
1Jeroen P. J. Saeij,
1Scott Y. Harada,
1Jim W. Ajioka,
2and John C. Boothroyd
1*
Department of Microbiology and Immunology, Stanford University School of Medicine, Fairchild Building, Room D305, Stanford, California 94305,1and Department of Pathology, Cambridge University, Cambridge, CB2 1QP, United Kingdom2
Received 26 February 2008/Accepted 23 May 2008
Toxoplasma gondiiis an intracellular parasite with a significant impact on human health, especially in cases
where individuals are immunocompromised (e.g., due to human immunodeficiency virus/AIDS). In Europe and North America, only a few clonal genotypes appear to be responsible for the vast majority of Toxoplasma
infections, and these clonotypes have been intensely studied to identify strain-specific phenotypes that may play a role in the manifestation of more-severe disease. To identify and genetically map strain-specific differences in gene expression, we have carried out expression quantitative trait locus analysis on Toxoplasma gene expression phenotypes by using spotted cDNA microarrays. This led to the identification of 16Toxoplasma
genes that had significant and mappable strain-specific variation in hybridization intensity. While the analysis should identify bothcis- andtrans-mapping hybridization profiles, we identified only loci with strain-specific hybridization differences that are most likely due to differences in the locus itself (i.e.,cismapping). Interest-ingly, a larger number of thesecis-mapping genes than would be expected by chance encode either confirmed or predicted secreted proteins, many of which are known to localize to the specialized secretory organelles characteristic of members of the phylum Apicomplexa. For six of thecis-mapping loci, we determined if the strain-specific hybridization differences were due to true transcriptional differences or rather to strain-specific differences in hybridization efficiency because of extreme polymorphism and/or deletion, and we found exam-ples of both scenarios.
In Europe and North America, a majority of described in-fections withToxoplasmaspp. appear to be due to only three clonal lineages (23), and a large body of work has been carried out to identify differences among these strains, especially in terms of disease outcome in both mice (33) and humans (22). Experimental genetic crosses between representatives of these lineages have been performed (24), allowing forward genetics to be used to identify the genetic bases for phenotypes of interest (see, e.g., references 30, 31, and 37). These phenotypic differences could be due to primary amino acid sequence dif-ferences and/or quantitative difdif-ferences in gene expression.
Little is known about the exact mechanisms of transcrip-tional regulation inToxoplasma, although many Toxoplasma genes are known to have transcript levels that vary among differentToxoplasmalife stages (e.g., tachyzoites, bradyzoites, and sporozoites) (4, 13, 15, 29, 35). Recently, Behnke et al. (4) identified sequence elements that play a role in the transcription of two genes that are upregulated during the tachyzoite-to-bra-dyzoite transition (bratachyzoite-to-bra-dyzoite antigen 1 [BAG1] and bratachyzoite-to-bra-dyzoite nucleoside triphosphatase) using site-directed mutagenesis. In-terestingly, these 6- to 8-bp motifs were distinct, suggesting that there are multiple mechanisms of transcriptional regula-tion in Toxoplasma. The fact that typical core palindromic
sequences in Toxoplasma promoter regions or proteins with significant homology to known transcription factors have not been identified to date in the completedToxoplasmagenome sequence (www.toxodb.org) implies that transcriptional regu-lation via transcription factors either is rare or is mediated by factors that are phylogenetically distinct from those described for other eukaryotes. Recent work has also indicated that some of the developmentally regulated transcriptional differences are associated with changes in the interaction of histone-mod-ifying enzymes with the relevant promoters (4, 32), suggesting that histone modifications play a significant role in transcrip-tional regulation inToxoplasma gondii. The DNA sequence motifs responsible for these differences, however, are un-known.
One approach to identifying regulators of transcription and the DNA sequence motifs with which they interact is to iden-tify and genetically map strain-specific differences in transcript abundance using expression quantitative trait locus (eQTL) mapping. For example, if a putative transcription factor differs either qualitatively or quantitatively between strains and this difference is heritable in F1 progeny, eQTL mapping should identify distinct loci with transcript levels that map to the putative transcription factor locus. Thesetrans-mapping loci would be of great interest as potential transcription factors. On the other hand, transcript abundance differences between strains could also be due tociselements. For example, poly-morphisms in the promoter region could result in differences in the transcription of the locus itself. Thesecis-mapping loci are also of great interest for the identification of regulatory motifs. To identify bothcis- andtrans-mapping loci inToxoplasma
* Corresponding author. Mailing address: Department of Microbi-ology and ImmunMicrobi-ology, Stanford University School of Medicine, Fair-child Building, Room D305, 299 Campus Drive, Stanford, CA 94305. Phone: (650) 723-7984. Fax: (650) 723-6853. E-mail: john.boothroyd @stanford.edu.
䌤Published ahead of print on 13 June 2008.
1403
on September 8, 2020 by guest
http://ec.asm.org/
gondii, we carried out eQTL mapping using 19 F1 progeny from a cross between a type II strain and a type III strain (24, 34). The results of these analyses identified 16 Toxoplasma genes with significant differences in hybridization intensity be-tween the parents that segregated significantly among the F1 progeny. For those genes with a known chromosomal location, the eQTL was always found to cosegregate with the gene itself, arguing against a trans-factor being responsible for the ob-served hybridization differences. Instead, these differences seem likely to be due to (i) transcriptional differences, (ii) differences in transcript stability, and/or (iii) polymorphisms or deletions that affect the amount of hybridization between the cDNA sample and the probes on the array. For six of the identified genes, we determined which of these possibilities was most likely and found apparent examples of at least the first and third mechanisms.
MATERIALS AND METHODS
Toxoplasma cDNA microarrays. Parasite microarrays were custom-printed cDNA arrays from either an RH (type I strain) tachyzoite cDNA library (“tachyzoite” array [1]) or a cDNA library from in vivo bradyzoites of the Prugniaud strain (type II; “bradyzoite” array [13]). For the tachyzoite array, 11,609 cDNA clones were PCR amplified and spotted onto the array as described elsewhere (30). For 7,488 of the cDNAs on the array, end sequence data were obtained previously and are available in GenBank (1). The Prugniaud bradyzoite cDNA array has been described previously (13) and consists of 4,402 cDNAs that were spotted three times each, 2,449 of which were end sequenced (13).
Microarray hybridization and data analysis.Human foreskin fibroblast (HFF) monolayers were prepared as described previously (31) and infected with tachyzoites at a multiplicity of infection of 10, and total RNA was harvested 24 h postinfection using the Trizol reagent (Invitrogen, Carlsbad, CA). Poly(A)-tailed RNA was purified from total RNA using the Qiagen (Valencia, CA) Oligotex mRNA isolation kit. The tachyzoite array was hybridized with labeled cDNA
from ME49 (n⫽2), CTg (n⫽3), and 19 F1progeny (S and CL clones) from
crosses between type II and III parasites (24), and the bradyzoite array was
hybridized with labeled cDNA from ME49 and CTg (n⫽3 for each strain) and
from 18 of the same 19 type II⫻type III F1progeny (for F1progeny clone S26
[24], no data were obtained for the bradyzoite array). Labeled cDNA derived
from each RNA sample was hybridized to the twoToxoplasmaarrays, and a
single biological replicate was performed for each F1 progeny clone. Single
replicates of each F1progeny clone are sufficient in QTL mapping, because at
each marker locus, multiple F1progeny have the same genotype (the expectation
being that half of the F1progeny have the type II genotype and the other half
have the type III genotype), and therefore each marker-genotype combination has multiple replicates.
Labeling and array hybridization were carried out as described previously (13). Briefly, cDNA samples were labeled with Cy5-dUTP (Amersham Biosciences) using random primed labeling and were cohybridized with a universal common reference consisting of Cy3-dUTP-labeled cRNA produced by T7 RNA poly-merase-mediated transcription of the empty cloning vector. For each spot, the
log2ratios of the normalized data were calculated. For the two-strain comparison
(ME49 versus CTg), transcripts with significantly different abundances were
determined using attest implemented within MeViewer software, and transcript
abundance was deemed significantly different at aPvalue of⬍0.05. Using the
most recentToxoplasmagenetic map (24), microarray hybridization data from
the 19 F1 progeny were tested for significant association with each genetic
marker using R/QTL (10). Genome-wide significance for each spot (P⬍0.05)
was assessed using 1,000 permutations of the genotype data (10). Expressed sequence tag (EST) data derived from each spot on the array were used to
associate the array spot with its correspondingToxoplasmadraft 3 gene model
(www.toxodb.org) if it had a significant BLASTX hit (Expect⬍10⫺10) against a
member of theToxoplasma protein set. For the remaining sequences, their
membership in a particular Apidots EST assembly (2, 6) was used if that EST
assembly had a significant (Expect⬍10⫺10
) BLASTX hit against a particular draft 3 gene model.
While the eQTL mapping strategy described above produces genome-wide significance levels for the association of a particular genetic marker with the abundance of each transcript, it does not control for the increase in type I errors
(i.e., false positives) associated with analyzing thousands of phenotypes (microar-ray spots). For those cDNA spots with hybridization intensities that were
signif-icantly (P⬍0.05) associated with a particular genetic marker (328 total
microar-ray spots, representing 236 unique genes), a number of criteria were used to reduce the data set to what were more likely to be “true” positives. When genes showed multiple cDNA spots on the microarray (since the arrays were con-structed from cDNA libraries), if more than one spot mapped to the same genetic marker and the rest of the spots for that gene did not map significantly to any other genetic marker (i.e., they did not pass the genome-wide significance
threshold [P⬍0.05]), they were considered to be putative expression QTLs.
Among genes with only one cDNA spot on the array or with only one spot mapping to a particular locus, only those with evidence of differential expression
between the parents (as determined by thettest analysis mentioned above [P⬍
0.05]) were considered to be putative expression QTLs. Genes in the resulting
data set were then classified as mapping in eithercis ortrans based on the
location of the gene itself and the QTL.
Dual-luciferase assays.For two genes that mapped incis, the putative pro-moter regions from ME49 and CTg were compared based on their abilities to drive firefly luciferase expression. Specifically, PCR-amplified sequences were directionally cloned into the Gateway entry vector pENTR-d-Topo (Invitrogen, Carlsbad, CA), and plasmids with properly oriented sequences were used in Gateway cloning reactions (“LR reactions”) with a destination vector containing
firefly luciferase and a 3⬘untranslated region (UTR) fromToxoplasma DHFR
(provided by Michael Behnke and Michael White, Department of Veterinary Molecular Biology, Montana State University) (38). For gene model 46.m01601, 1,004 bp upstream of the predicted start codon from either ME49 or CTg was
cloned in frame with firefly luciferase using forward primer 5⬘-CACCGGATA
CAGGGATTCCCACAA-3⬘(CACC is the sequence used for directional cloning
into the pENTR-D-Topo vector) (20) and reverse primer 5⬘-ATCCATGCTGT
TATTCGAGGGAAACTAAG-3⬘(where ATCCAT encodes, in antisense, the
start codon and an aspartic acid). ForROP18(gene model 20.m03896 [www
.toxodb.org]), 633 bp of sequence upstream of the presumed start codon was used as the putative promoter for the type II strain. This was generated by PCR
amplification using forward primer 5⬘-CACCCTCGTCGACCACACAGCTA
A-3⬘and reverse primer 5⬘-ATCCATCACAACTTTCACACAAACTGGAC-3⬘.
For the type III strain, the region upstream ofROP18contains a deletion of 210
bp and an insertion of 2,242 bp relative to type II. This entire 2,617-bp region was cloned into the firefly luciferase vector using the same forward primer as that for
the type II construct and reverse primer 5⬘-ATCCATTACAACATTCACACA
AACTGTAC-3⬘due to polymorphisms present in theROP18gene. For
lucifer-ase assays, equimolar amounts of each construct (typically between 50 and 100
g) were cotransfected into strain CTg along with 20 to 100g of a vector
containingRenillaluciferase driven by theTUB1promoter (20). Parasites were
harvested 24 to 48 h posttransfection, and firefly andRenillaluciferase levels
were determined using the Dual-Luciferase assay kit (Promega, Madison, WI).
qPCR. For toxofilin (33.m02185), TgDT.544460, and ROP8 (33.m00005), primers were designed from nonpolymorphic regions of the predicted transcript using Primer3 (http://fokker.wi.mit.edu/primer3/input.htm), followed by selec-tion for use in quantitative PCR (qPCR) as described previously (7). Primers
were as follows: for toxofilin, forward primer 5⬘-ATACAAGTCACGCCCTTT
GG-3⬘ and reverse primer 5⬘-GGAGGGCGACATTGTAGATG-3⬘; for
TgDT.544460, forward primer 5⬘-GGCATCTCCCCTCTCAACT-3⬘and reverse
primer 5⬘-GTGGTGCAAGAACCATCAGA-3⬘; for ROP8, forward primer 5⬘A
GCCAGACGAGCAACCATA and reverse primer 5⬘GCGCACCAAATCCAG
TAGA. Primers for the control gene,AMA1(forward, 5⬘-ACGGTTTCTACTA
CGTGG-3⬘; reverse, 5⬘-CCAGCGATCAACGCAG-3⬘), have been described
previously (30), and this gene was used to normalize the qPCR data because (i) there are few polymorphisms in the entire transcript from a type II (ME49) and
a type III (VEG) strain (www.toxodb.org) and (ii)AMA1has similar
hybridiza-tion intensities in the type II and the type III strain used in this study (type II
versus type III, 0.97⫾0.10-fold difference across 5 microarray spots;P⫽0.85).
Total RNA was isolated from at least two different cultures of either ME49 or CTg tachyzoites grown for 24 h on HFF monolayers (multiplicity of infection, 10), and qPCR on the resulting cDNA was carried out on a Bio-Rad iCycler using Sybr green detection. Significant differences in transcript levels were
de-termined using the⌬⌬CTmethod as described previously (7, 26).
PCR amplification of 79.m00015.To determine if the 79.m00015 locus was present in the type III genome, we designed primers that would distinguish 79.m00015 from one of its paralogous sequences (50.m05602) (see Results).
These were forward primer 5⬘-TCCGCTCGGAAAACAAATAC-3⬘and reverse
primer 5⬘-ATTTCGCGTTCAGAAGCATT-3⬘. As a control we also constructed
a primer set to amplify from homologous regions of both 79.m00015 and
50.m05602 (forward, 5⬘-ATGCACAACTTAGTCCTGGCGTTGC-3⬘; reverse, 5⬘
on September 8, 2020 by guest
http://ec.asm.org/
GCGGGTTTCCTACGGCCACGGTGCGGATTCGTCCTTTC-3⬘). Genomic DNA was harvested from strain ME49 (type II) and CTg (Type III) parasites and was used in PCR amplification reactions using standard methods.
Microarray data accession number.The microarray data obtained in this study have been deposited in the Gene Expression Omnibus Database under accession number GSE11515. They can be downloaded at http://www.ncbi.nlm.nih.gov/geo
/query/acc.cgi?acc⫽GSE11515.
RESULTS
SixteenToxoplasmagenes have mappable expression pheno-types.Gene expression profiling was carried out on the parents and F1progeny from a cross between a type II (ME49) and a
type III (CTg) strain, and expression phenotypes were genet-ically mapped using eQTL analysis. Based on BLASTX of the sequence data derived from the spots on the microarrays against the current draft of the predictedToxoplasmaprotein set (www.toxodb.org), we estimate that we assayed 2,226 pre-dicted gene models (out of a total of 7,793). Out of this data set, we identified 16 genes associated with cDNA spots that had hybridization intensities significantly associated with the genotype of a particular marker, and these data are summa-rized in Table 1. Interestingly, in our data set, there are 60 other gene models with strong evidence for differential hybrid-ization between type II and type III strains (as confirmed by multiple spots for the same gene that show significant differ-ences), but the hybridization profiles for these genes did not significantly map to any locus in the genome. This could be due to a number of factors, including multiple interacting loci or trans-acting loci that have more subtle effects that may be refractory to our analysis given the number of progeny exam-ined (multilocus interactions require a much larger sample size for reliable identification).
For the 14 genes with known genomic locations, the pheno-type mapped within the genomic region containing the gene itself (i.e., the array hybridization phenotype putatively mapped incis). Given the low recombination rate for Toxo-plasma(1 centimorgan per⬃100 kb [24]) and the number of progeny used in this study (18 progeny), the eQTL span a genomic region that is typically 1 to 3 Mb. Therefore, on smaller chromosomes for which there were no intrachromo-somal recombination events in any of the F1progeny (such as chromosome II [24]), the QTL for the expression phenotype spans the entire length of the chromosome. The designation of “cis,” therefore, is clearly tentative (atrans-acting factor that maps 1 Mb away would be missed), but the fact that all 14 genes mapped in this way and the results described below suggest that most, if not all, of this set of genes have differential hybridization as a result of differences in the genes themselves. Overall, the 16 genes presented in Table 1 represent a curated data set of transcripts with significant eQTL based on differ-ential hybridization intensity between type II and type III strains and among their F1progeny.
Recently, an Affymetrix oligonucleotide array containing probes for all predicted Toxoplasma genes was constructed, and data quantifying hybridization intensity in a type II strain (Prugniaud) and a type III strain (VEG) were made available through ToxoDB (www.toxodb.org). When we compared our hybridization data to this public data set, we found that for 14 of the 15 genes listed in Table 1 that were present on the Affymetrix chip, the differences in hybridization intensity
be-tween ME49 and VEG were qualitatively similar to our obser-vations (Table 1). For the one transcript that was not assigned to a gene model and therefore is not present in the data from ToxoDB (TgDT.544460), as well as for the one gene (ROP8) where our spotted cDNA data differed significantly from the ToxoDB data, we validated the observed hybridization differ-ences using real-time qPCR. In our spotted cDNA array data, levels of both the TgDT.544460 and theROP8transcript were higher in the type II parent than in the type III parent (3.22-and 2.37-fold, respectively), (3.22-and using real-time qPCR we found qualitatively similar transcript abundance differences be-tween strains for these two genes: the TgDT.544460 level was 1,600-fold higher in ME49 than in CEP (n⫽5;P⫽0.008), and theROP8transcript level was 92-fold higher in ME49 than in CEP (n⫽ 5;P⫽0.02). Spotted cDNA microarrays are well known to sometimes significantly underestimate differences (13), and this was clearly the case here. The key observation, however, that these two genes show markedly more transcript abundance in ME49 than in CEP, was confirmed.
Genes that encode proteins with predicted signal peptides are overrepresented in the eQTL group.The 14cis-mapping loci identified in this study are predicted to have a wide variety of functions. Interestingly, 6 of the 14 (42%) contain a signal peptide as predicted by SignalP (18) and are therefore likely to enter the secretory pathway. This is a larger percentage than would be expected by chance (hypergeometric distribution, P⫽0.004), since only 281 of the 2,226 predicted genes repre-sented on the microarray (13%) contain predicted signal pep-tides (www.toxodb.org). InT. gondii, many of the proteins that enter the secretory pathway are destined for a set of secretory organelles unique to the phylum. These include the rhoptries, the dense granules, and the micronemes, all of which can secrete their contents directly into the host cell (19), into the parasitophorous vacuole (14), or onto the parasite surface (11). In fact, five of the six cis-mapping genes with signal peptides were already known to localize to this group of se-cretory organelles. GRA7 is found in the dense granules (14); ROP18 (17, 30), toxofilin (9, 28), and ROP8 (16) are found in the rhoptries; and 46.m01601 was found in stimulated secre-tion products containing primarily dense granule and mi-croneme proteins (formerly called TgTwinsan_2661 [41]). Moreover, GRA7, ROP18, and ROP8 can all be found in the host cell at different times postinvasion (14, 16, 30). These proteins have been intensely studied because they appear cru-cial toToxoplasma biology. The subcellular location for the remaining cis-mapping gene with a predicted signal peptide (gene model 20.m03784) is unknown.
46.m01601 and ROP18: upstream sequences from type II and type III strains have different activities in luciferase re-porter assays. For eQTL that map incis, multiple scenarios could produce the observed differences in hybridization: either (i) the transcript is highly polymorphic between the parental lines, and the corresponding cDNA from one of the predicted alleles hybridizes inefficiently to the probe spotted on the array (which is derived from only a single strain), (ii) the locus is deleted in one of the parental strains, or (iii) the transcript exhibits different abundances in the parental lines and F1 prog-eny due to polymorphisms, insertions, or deletions in the gene’s promoter or stability control regions (typically 5⬘and 3⬘ UTRs). To investigate which of these explanations applies to
on September 8, 2020 by guest
http://ec.asm.org/
TABLE 1. Toxoplasma genes with hybridization profiles that significantly mapped to a marker in the genome a Identifier Gene name/description Chrom
Gene chrom pos (Mb)
Signal peptide? Fold dif ference in transcript level, type II vs type III b
Max LOD score
Max LOD marker Marker chrom QTL range QTL chrom range (Mb) cis mapping? Type II vs type III polymorphism (%) This study ToxoDB Promoter Coding UTR 113.m00783 Conserved hypothetical II 1.8 No ⫺ 2.22 ⫺ 1.83 2.47 G11L-T7 II Whole chrom 0.00–2.47 Yes 0.6 1.32 1.3 41.m01274 Conserved hypothetical II 0.07 No ⫺ 1.94 ⫺ 2.41 4.35 G11L-T7 II Whole chrom 0.00–2.47 Yes 3.24 2.58 1.62 41.m01339 Hypothetical II 0.88 No 2.15 3.40 3.22 G11L-T7 II Whole chrom 0.00–2.47 Yes 1.65 0.5 2.28 20.m00005 GRA7 VIIa 2.57 Yes 1.87 1.32 2.83 CS2 or AK29 VIIa CS9–end 1.81–4.50 Yes 0.7 2.25 1.3 20.m03784 Hypothetical VIIa 2.58 Yes 1.86 14.28 4.7 TgSUB1 VIIa CS9–M102 1.81–3.09 Yes 1.6 0.4 1 20.m03896 ROP18 VIIa 1.48 Yes 3.57 239.97 4.61 CS2 VIIa M95–TgSUB1 0.60–2.00 Yes 2.83 5.8 4.91 59.m03370 Hypothetical VIII 6.62 No ⫺ 2.98 ⫺ 6.55 5.18 AK114 VIII MAG1–end 5.31–6.92 Yes 1.4 1.14 1.68 57.m00004 Protein kinase homologue IX 1.01 No 10.06 3.09 2.76 L375 or AK123 IX AK87–AK59 or KT-62A– SAG5C 0.36–3.38 or 3.56–4.75 Yes 0.9 1.1 0.5 57.m03117 Phosphodiesterase homologue IX 0.99 No ⫺ 1.3 ⫺ 1.37 3.96 L375 or AK123 IX AK87–AK59 or KT-62A– SAG5C 0.36–3.38 or 3.56–4.75 Yes 0.3 0.3 0.75 57.m03124 Acetyl coenzyme A synthetase IX 1.16 No ⫺ 1.49 ⫺ 4.35 3.43 L375 or AK123 IX AK87–AK59 or KT-62A– SAG5C 0.36–3.38 or 3.56–4.75 Yes 0.2 0 1.36 33.m00005 ROP8 X 7.09 Yes 2.37 c ⫺ 2.19 4.38 AK148 X AK157–end 6.93–7.42 Yes 2.03 3.11 1.1 33.m02185 Toxofilin X 5.95 Yes 3.2 7.06 9.94 AK153 X AK34–MIC2AP 4.12–6.54 Yes 2.81 8.37 9.31 42.m05839 JMCJ domain containing X 2.61 No 3.54 1.47 2.81 AK65 X AK63–c19-TA3 1.60–4.05 Yes 1 0.5 0.75 46.m01601 Hypothetical X 4.28 Yes ⫺ 1.75 ⫺ 4.35 7.1 AK66 X SRS4–AK153 2.78–4.39 Yes 1.7 1 1.05 79.m00015 Hypothetical Unk d Unk d Yes 3.48 12.25 3.16 AK65 X AK63–c19-TA3 1.60–4.05 Unk d Unk e Unk e Unk e TgDT.544460 Hypothetical Unk d Unk d No 3.22 c N/A 7.39 AK128 X Start–Gra3 0.00–0.99 Unk d 5.89 9.71 Unk f aChrom, chromosome; pos, position; max, maximum; Unk, unknown; N/A, not applicable. bPositive numbers indicate that the type II strain had higher hybridization intensity, while negative numbers indicate that the type III strain had hi gher hybridization intensity. ToxoDB data were downloaded from www.toxodb.org. cValidated in this study using real-time qPCR. See the text. dThe chromosomal location for this gene is unknown. eThis locus is apparently missing from the type III genome (VEG genomic sequence 关 www.toxodb.org 兴 ). fThe 3 ⬘ UTR is either deleted or highly divergent in the type III genome (VEG genomic sequence 关 www.toxodb.org 兴 ).
on September 8, 2020 by guest
http://ec.asm.org/
specific loci, several additional experiments were necessary. For the 46.m01601 locus, all three of the microarray spots had hybridization profiles that were significantly associated with a region on chromosome X (logarithm of odds [LOD] scores ranged from 5.1 to 7.1) delimited by markers SRS4 and AK153, a 1.61-Mb region that contains the 46.m01601 locus itself. In this case, the type III strain (CTg) had a 1.8-fold greater signal for 46.m01601 than the type II strain (ME49) (Table 1), and in the F1progeny the type III allele at this locus was also strongly associated with higher signals for the 46.m01601 spots. Sequence analysis of the 46.m01601 locus in type II and type III strains (using direct sequencing as well as publicly available genomic sequences from a type II [ME49] and a type III [VEG] strain [http://www.toxodb.org]) revealed a relatively high level of sequence similarity in the predicted transcript (99.2% over the 1,503-bp transcript), suggesting that the differences in hybridization signal were not due to differ-ences in hybridization efficiency between the cDNAs derived from the type II and type III strains. Based on this finding, we hypothesized that polymorphisms present in the region up-stream (the promoter and 5⬘UTR) of the 46.m01601 coding region could be responsible for this difference. Using the po-sition of the 5⬘-most EST (2, 6) that mapped to this locus, we estimated the putative transcriptional start site to be at posi-tion ⫺441 relative to the start codon (Fig. 1A). Direct se-quence analysis of the type III strain used in this study (CTg) and comparison to the type II genomic sequence revealed that the 1,004 bp upstream of the start codon contained 17 single nucleotide polymorphisms (SNPs) between the type II and type III strains. All 17 of these differences are also present in the complete genome sequence from a type III strain (VEG) (http://www.toxodb.org).
To test whether these differences are responsible for the observed transcript level differences, the type II and type III upstream sequences of 46.m01601 were fused to firefly lucif-erase and assayed for expression using transient transfection. The constructs contained the 1,004 bp of upstream sequence discussed above (referred to below as the 46.m01601 pro-moter). In these assays the type III promoter yielded 2.0 (⫾0.13)-fold higher luciferase production than the type II pro-moter (P⬍ 0.001) (Fig. 1B). This is in close agreement with the microarray data for the parental strains, and it also con-firms that one or more of the polymorphisms in the 46.m01601 promoter are almost certainly responsible for most, if not all, of the differences in transcript abundance.
To identify the specific region of the upstream sequence that was responsible for the differences in promoter activity, we created chimeric luciferase reporter constructs that contained either the first (5⬘-most) 524 bp of the type II promoter fused to the last 480 bp of the type III promoter (type II/III fusion) or vice versa (type III/II fusion) and compared them to the wild-type CTg (type III) promoter. The type II/III fusion yielded significantly less luciferase (about 1.5-fold [P⬍0.01]) than the type III wild-type promoter (Fig. 1B), while the type III/II fusion yielded levels of luciferase similar to those for the type III promoter (P⬎0.05) (Fig. 1B). These data suggest that the one or more of the seven polymorphisms within the 5⬘half of the type III strain 46.m01601 promoter are important for the increased promoter activity, although contributions from the polymorphisms present in the 3⬘half (in which there are 10
polymorphisms between the type II and type III sequences [Fig. 1A]) may also play a role. When the 5⬘-most 524 bp is removed from the type III promoter and fused to luciferase, this truncated construct (containing only 39 bp upstream of the putative transcriptional start site) results in a level of luciferase production that is above background but significantly lower than that seen for the 1,004-bp type III promoter. A similarly truncated promoter construct derived from the type II se-quence also exhibited lower luciferase production than the 1,004-bp type II promoter (Fig. 1B). In aggregate, these data provide further support for the role that the first 524 bp of the putative promoter plays in the increased luciferase production typical of the type III strain sequence.
There are 128 different possible combinations of the seven SNPs in the 5⬘ half of the 46.m01601 promoter. Testing all possible combinations would be prohibitive in terms of the effort involved, so we focused on four sets of physically clus-tered SNPs (SNP1, SNPs 2, 3, and 4, SNP5, and SNPs 6 and 7 [Fig. 1A]). SNP5 was of particular interest because it was within a 7-bp sequence that is a good match to a consensus heptamer (GAGACGC) often found upstream of the tran-scriptional start site and has been implicated in promoter func-tion for severalToxoplasmagenes (27, 36). In the 46.m01601 upstream region, this motif (at position⫺180 with respect to the transcriptional start site) is GAGACGA in the type III strain and GACACGA, a weaker match to the consensus, in the type II strain. To test the hypothesis that this single G-to-C SNP was responsible for the differences in 46.m01601 tran-scription, we swapped just this residue in the type III and type II promoters and compared the abilities of these upstream regions to drive luciferase expression. Surprisingly, neither of these mutations resulted in any significant differences (P ⬎ 0.05) in luciferase production between the mutant promoter and its wild-type counterpart (Fig. 1C). To test the remaining six SNPs in the 46.m01601 upstream half, we made three dif-ferent constructs in which we mutated just SNP 1, SNPs 2, 3, and 4, or SNPs 6 and 7 from the type III to the type II sequence, and we compared their luciferase production with that of constructs harboring the unaltered type III promoter. Again, these constructs were all as effective at driving lucifer-ase production as the type III promoter (P⬎0.05), resulting in 1.7- to 2.3-fold more luciferase production than the type II promoter (Fig. 1B). Therefore, while in aggregate the SNPs in the first 524 bp are at least partially responsible for the in-creased luciferase production of the type III promoter com-pared to the type II promoter, these data suggest that either all seven are necessary for the increased activity of this promoter or that particular, untested combinations of SNPs (e.g., SNP4 and SNP7) are necessary for the increased promoter activity of the type III allele. With respect to SNP5 and the heptamer motif, the data show either that the heptamer motif is not involved in the promoter activity, at least in this assay, or that it is not substantially affected by the G/C polymorphism at position 3.
Differences between types II and III in microarray signal strength for the transcripts encoding the rhoptry kinase ROP18 (ToxoDB gene model 20.m03896) were also observed and confirmed by qPCR to be true reflections of major differ-ences in transcript abundance between the two strains (30). Analysis of the type II⫻type III F1progeny showed that this
on September 8, 2020 by guest
http://ec.asm.org/
difference was significantly associated with marker CS2 (LOD score, 4.6), which, based on the genetic map, falls between markers M95 and TgSUB1, a 1.4-Mb region encompassing the ROP18 locus itself (30). When we sequenced the upstream
(putative promoter) region of a type III strain (CTg) and compared it to the ME49 genomic sequence, we found that ROP18 in the CTg strain contains an insertion/deletion just upstream of the predicted transcriptional start site (as deter-FIG. 1. Analysis of strain-specific differences in 46.m01601 promoter activity. (A) Structure of the 46.m01601 locus, showing the upstream 1,004 bp used as the putative promoter and the 17 polymorphisms that distinguish the type II and type III sequences. Transcription starts at about position⫺441 relative to the start codon, based on alignment of EST sequences to the locus. The truncated version of the promoter used in luciferase assays is also shown. SP, signal peptide sequence. (B) Effects of truncation of the type II and type III promoters, engineering of chimeric promoter constructs, and effect of mutation of multiple SNPs in the type III promoter on luciferase production. All data were normalized to the level with the type II promoter. Data are shown for the type II and type III wild-type promoters, the type II and type III truncated promoters (type II and type III,⫺480 to⫺1), the chimeric promoter constructs [e.g., type II (⫺1004 to⫺481)/type III (⫺480 to⫺1)], and the type III promoter mutated to the type II sequence at either SNP1, SNPs 2, 3, and 4, or SNPs 6 and 7 [e.g., type III (⫺1004 to⫺1; type II SNP 1)]. Asterisks indicate significant differences from the results with the full type III promoter by one-way analysis of variance and Tukey’s multiple-comparison posttest.**,P⬍0.01;***,P⬍0.001. (C) Versions of the 46.m01601 promoter were constructed where SNP5 was mutated in the type II promoter to the type III nucleotide [type II (⫺1004 to⫺1; type III at SNP5)] or in the type III promoter to the type II nucleotide [type III (⫺1004 to⫺1; type II at SNP5) and fused to firefly luciferase. Luciferase production for each mutated construct was compared to that for its wild-type counterpart, and data are represented as ratios of the firefly luciferase signal to theRenilla
luciferase signal. Means with the same letter are not significantly different (P⬎0.05). SEM, standard error of the mean.
on September 8, 2020 by guest
http://ec.asm.org/
mined by EST alignments to the genome [30]). Relative to ME49, the insertion was 2,242 bp long and the deletion was 210 bp long (type III strain; GenBank accession no. EF092842). This difference was also recently confirmed by near-complete genomic sequencing of another type III strain (www.toxodb.org). Interestingly, three nearly perfect 44-bp tandem repeats are present just upstream of the insertion/ deletion site in the type II sequence, while in the type III promoter region this sequence is represented only once. This 44-bp repeat is not found in any recognizable form outside of the ROP18locus in theToxoplasma genomic sequence from type I, type II, or type III strains (www.toxodb.org).
To determine if this insertion/deletion is responsible for the transcript abundance differences forROP18, the upstream re-gions from type II and type III were compared (using 633 and 2,668 bp 5⬘of the start codon, respectively) by the dual-lucif-erase assay described above. The results showed that, as pre-dicted by the array data, the type II promoter drove the pro-duction of substantially more luciferase (6.2⫾1.4-fold) than the type III construct after transfection of equimolar amounts of each construct (data not shown). Hence, not surprisingly,
the major insertion/deletion within its promoter region ap-pears to have a substantial effect onROP18expression.
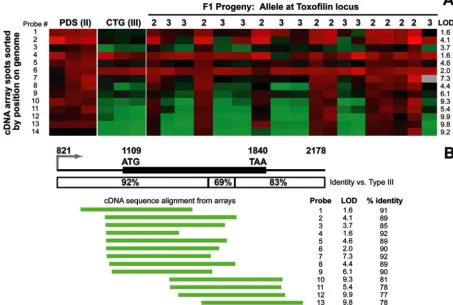
Toxofilin hybridization differences are due mostly to poly-morphisms, not to transcript abundance. The LOD scores associated with the gene encoding the rhoptry protein toxofilin were among the highest that we observed (maximum LOD, 9.4), and the eQTL was found between genetic markers AK34 and MIC2AP, a 2.3-Mb region that encompassed thetoxofilin locus. As shown in Fig. 2A, the hybridization intensity from cDNA derived from the type II strain was higher than that from the type III strain in nearly all of the toxofilin probes present on the array. On average, this difference was 3.2 ⫾ 0.4-fold higher in strains with a type II allele at this locus than in those with a type III allele. It is possible that some of this difference is due to transcript abundance in these strains, but based on direct sequencing from type II (ME49) and type III (CTg) strains, the primary sequence oftoxofilin is unusually divergent: in the 1.3-kb predicted transcript, there are 167 SNPs between the type II and type III sequences, plus 3 other sites where nucleotides are either deleted or inserted in the type III strain sequence with respect to the type II sequence. FIG. 2. Microarray analysis of strain-specific differences at thetoxofilin locus. (A) Microarray data from the 14toxofilin probes from the bradyzoite microarray derived from a type II strain. Parasite cDNA was labeled with Cy5 (red) and cohybridized with a Cy3-labeled common reference. Data are shown from triplicate arrays for the type II and type III parents, and single arrays were done for each of the 18 F1progeny.
LOD scores as determined by R/QTL software are shown for each probe. (B) Structure of thetoxofilinlocus. The putative promoter and predicted N-terminal region of the protein are more conserved between type II and type III than the predicted C terminus and putative 3⬘UTR. The locations of the 5⬘ends of the cDNAs on the microarray are shown below the locus, sorted by the start position on the genome. The percentage of identity between the sequenced portion of the probe and the type IIItoxofilinsequence, along with the LOD score for each probe, is also shown, demonstrating the inverse correlation between the percentage of identity and the LOD score.
on September 8, 2020 by guest
http://ec.asm.org/
Furthermore, larger numbers of these polymorphisms are clus-tered at the 3⬘ end of thetoxofilintranscript (121 of the 167 SNPs are in the last 707 bp of the transcript). This level of polymorphism (12.4% at the nucleic acid level) is dramatically higher than what is typical for type II and type III sequences (⬃1 to 2% polymorphism [6]) and would be sufficient to cause differences in hybridization efficiency between type II- and type III-derived cDNAs and the cDNA fragments oftoxofilin spot-ted on the array (which are from a type II strain for alltoxofilin spots shown). This difference in hybridization to the probes on the array can be seen in Fig. 2, where the probes corresponding to the 5⬘ region of the transcript tend to hybridize more effi-ciently to cDNAs from type III strains than those correspond-ing to the more variable 3⬘end of the transcript. Of particular note are probes 4 and 6, which have nearly equal hybridization with the type II and type III parents (0.8⫾0.1-fold difference between type II and type III) and thus show no significant segregation with any genetic marker. In contrast, probes de-rived from the more divergent 3⬘end of the transcript tend to have much higher LOD scores for marker association (as high as 9 for probes 10, 12, 13, and 15) and a corresponding differ-ence in hybridization intensity between the type II and type III parents (4.0⫾0.8-fold higher for type II than for type III). The nucleic acid identities between the end sequence data obtained from each spot and the corresponding region of the type III sequence were computed using ClustalW, and these identities were regressed against the maximum LOD score for the asso-ciation between the hybridization intensity and the relevant region on chromosome X. As expected, there was a highly significant negative correlation (R2⫽0.56;P⫽0.002) between
the LOD score and the percentage of identity between the array spot sequences (from a type II strain) and the corre-sponding sequence in the type III strain. It should be noted that the probes on the array were sequenced only from the 5⬘ end, and therefore the exact length, and the exact percentage of identity in comparison to type III, of the entire sequence present on the array is unknown. Clearly, however, the probes that contain sequence from the 3⬘-most end of the toxofilin locus are much less efficient at hybridization to cDNAs from type III strains.
The above microarray results strongly suggested that the cis-mapping eQTL fortoxofilin is the result of differences in hybridization efficiency between the alleles rather than of dif-ferences in transcript abundance. To confirm this, we used real-time qPCR with primers derived from nonpolymorphic regions oftoxofilin. The results showed that the ratio of tran-script levels in type III to those in type II was 1.02 (⫾0.29), a difference that was not statistically significant (P⫽0.61) (data not shown). These data indicate that the strain-specific differ-ences in signal intensity for toxofilin are due to the extreme polymorphism at the type IIItoxofilinlocus relative to the type II locus rather than to actual differences in transcript abun-dance.
The 79.m00015 coding region is deleted in CTg and is a member of a small family of secreted proteins.The chromo-somal locations for two genes showing strain-specific differ-ences in the microarray analysis are, surprisingly, unknown (Table 1). One of these proteins, 79.m00015, has a predicted signal peptide and showed an eQTL that mapped to a 3.4-Mb region of chromosome X. Based on the microarray data for
this locus, the type II allele was associated with higher hybrid-ization intensity, and in the parental lines we observed a 2.9-fold-higher signal for the type II strain than for the type III strain. The 79.m00015 gene model is predicted from genomic scaffold TGG_994719, an 8,740-bp scaffold that has not been assigned to a T. gondii chromosome. BlastP analysis of this predicted protein against the predictedToxoplasmaprotein set (http://www.toxodb.org) reveals at least two paralogues that share homology to 79.m00015 along virtually its entire length. These are 50.m05602, which is found on chromosome XII, and 1.m00014 which, like 79.m00015, is predicted from a short genomic scaffold (TGG_995340) with an unknown chromo-somal location. Over the first 180 amino acids of 79.m00015, 50.m05602 and 79.m00015 are identical, but they are then highly divergent over the rest of the predicted protein. Based on analysis of the existing type III strain genomic sequence (http://www.toxodb.org), the 50.m05602 locus appears to be present in the type III sequence, while the 79.m00015 and 1.m00014 loci appear to be deleted. We confirmed this for the 79.m00015 locus by using a PCR primer set designed to dis-tinguish 79.m00015 from 50.m05602 and found that we could amplify 79.m00015 sequence only from ME49 genomic DNA. However, using primers designed to amplify both 79.m00015 and 50.m05602, we found that we could amplify 50.m05602 from both ME49 and CTg DNAs (J. P. Boyle and J. C. Boo-throyd, unpublished data). The apparent absence of 79.m00015 in type III strains would certainly account for the dramatic difference in hybridization observed between type II and type III strains, and it will be important to determine if 79.m00015, and therefore genomic scaffold TGG_995340, are indeed found on chromosome X, as the genetic mapping data would suggest. The presence of multiple members of this gene family in type II strains suggests that this gene set may have expanded in this lineage. It will be interesting to express tagged versions of 79.m00015 and its paralogous proteins in order to determine their subcellular localization.
EST assembly TgDT.544460 is a short orphan sequence with unknown coding function but a clear difference in hybridiza-tion intensity.Four cDNA probes that map to the same loca-tion on the 40-kbpT. gondii genomic scaffold TGG_995349 associate significantly with markers on chromosome X (AK128, three probes; AK154, one probe), with LOD scores ranging from 2.6 to 9.7 (P ⬍0.01 for all probes). These se-quences do not correspond to any member of the current draft of the predictedToxoplasma protein set, but they do corre-spond to EST assembly contig TgDT.544460 (www.toxodb.org) (25), which incorporates, among others, the sequences for all four cDNA spots that were on the microarrays (GenBank dbEST accession no. AA531996, AA519292, AA519751, and W96676). Genomic scaffold TGG_995349 has not been as-signed to anyT. gondiichromosome and does not contain any predicted gene models (www.toxodb.org). The fact that the hybridization intensity of this particular gene mapped signifi-cantly to genetic markers on chromosome X could indicate that the unmapped genomic scaffold TGG_995349 is also found on chromosome X, although a definitive determination of whether the hybridization intensity of this particular gene maps incis or in trans is not possible without knowing the chromosomal location of the gene. Based on the array data, the type II allele is associated with higher levels of
on September 8, 2020 by guest
http://ec.asm.org/
tion for this transcript (3.1-fold compared to type III [Table 1]), and this gene is also present in the fully sequenced genome from a type III strain (VEG [http://www.toxodb.org]). A 136-amino-acid open reading frame is predicted in the genomic region encompassing the TgDT.544460 EST assembly and en-codes a protein of unknown function. However, the predicted open reading frame product has 91% identity with the first 136 (of 197) amino acids of another Toxoplasma protein, gene model 644.m00075 (found on chromosome III), and has high BLASTP similarity to eight other predicted T. gondii gene models (Expect⬍ 10⫺10), suggesting that TgDT.544460 may
also belong to a family of Toxoplasma proteins. It will be interesting to determine the subcellular localization of the pro-tein encoded by TgDT.544460, as well as itsToxoplasma para-logues, and to determine the significance of the higher tran-script abundance of TgDT.544460 in type II strains versus type III strains.
Other significantly mapping genes. Besides TgDT.544460, the eight remaining genes with significant eQTL that did not include sequences encoding predicted signal peptides were distributed across four different chromosomes. They are listed, along with their genomic locations, in Table 1. Some of these proteins are predicted to have enzymatic activity, including one with a predicted kinase domain (57.m00004), one with pre-dicted phosphodiesterase activity (57.m03117), and one with
predicted acetyl coenzyme A synthetase activity (57.m03124), all on chromosome IX (Table 1). Remarkably, 57.m03117 and 57.m00004 are adjacent to each other in the genome in a tail-to-tail orientation (Fig. 3A), and based on the predicted protein sets, the 3⬘ ends of the transcripts are predicted to overlap. For 57.m03117, two cDNA probes (probes 1 and 2 [Fig. 3A]) had mappable hybridization intensity phenotypes, and in this case greater hybridization intensity was associated with the type III strain (on average, 1.30-fold higher for CTg than for ME49 [Table 1; Fig. 3B and C]). A single probe mapped for 57.m00004, and the type II strain had dramatically higher (10.3-fold) hybridization intensity for this spot than the type III strain (Fig. 3D). Interestingly, the second cDNA probe that we mapped to 57.m03117 via BLASTN also overlaps the predicted location of 57.m00004 (Fig. 3A), although it shows hybridization intensity differences between the type II and type III parents that are more consistent with the other 57.m03117 probe (probe 1 [Fig. 3A and B]). The 57.m00004 locus appears to be present in the type III genome (Table 1) and does not appear to have a significantly high level of polymorphism (1 to 2%) that would affect the hybridization of type III cDNAs to the array spot. Therefore, it is likely that both 57.m03117 and 57.m00004 exhibit different abundances in type II and type III strains. Given their tail-to-tail orientation (Fig. 3A), it is pos-sible that the highly active transcription of 57.m00004 in type II FIG. 3. Genomic locations of twocis-mapping transcripts corresponding to gene models 57.m03117 and 57.m00004. (A) Genome browser view (www.toxodb.org) encompassing bp 999000 to 1012000 on chromosome IX. The positions of the three cDNA probes with hybridization intensities that mapped to this locus are shown (probes 1 to 3). (B to D) Log2ratios of probes 1 to 3, respectively, in the parental lines used in this study,
showing the higher hybridization of type III strains to probe 1 and the higher hybridization intensity of type II strains with probe 3.
on September 8, 2020 by guest
http://ec.asm.org/
strains compared to type III strains inhibits the efficient tran-scription of 57.m03117 in type II strains, and the converse may be true in type III strains.
Interestingly, three proteins on chromosome II hadcis -map-ping hybridization intensity levels (although since there was no recombination on chromosome II in any of the F1 progeny,
these are calledcismapping only on the basis of the fact that the loci themselves are on the same chromosome as the eQTL). For these genes we have not performed any further experiments and therefore cannot know if the differences in hybridization intensity are due to actual expression differences (as for 46.m01601 andROP18) or divergent sequences between the strains (as fortoxofilin). As shown in Table 1, however, all of these loci appear to be clearly present in both type II and type III strains (i.e., they are not deleted), and none have a level of sequence variation in either the promoter/5⬘UTR, the coding region, or the 3⬘UTR that exceeds 3 SNPs per 100 bp, suggesting that they may represent genes that are under dif-ferential transcriptional regulation and/or have different levels of stability.
DISCUSSION
Some of the phenotypic differences between Toxoplasma strains could be due to quantitative differences in expression rather than to amino acid-changing polymorphisms. To iden-tify these loci and their genetic basis, we carried out eQTL mapping on Toxoplasma transcriptional profiles using 19 F1 type II⫻type III progeny (24). We have identified 16 loci in Toxoplasma that have hybridization intensity profiles that could be genetically mapped in this fashion, and in all cases these genes were found to map incis, perhaps suggesting that sequence differences within the promoter and/or 3⬘UTRs were responsible for the differences in transcript abundance. For two such genes, (46.m01601 andROP18), based on luciferase assays, the promoter was indeed found to be at least partly responsible for the observed differences in hybridization inten-sity between strains. ForROP18, these are likely due to the insertion/deletion present in the putative promoter, which makes the type III upstream region less efficient at driving luciferase production. For 46.m01601, there were no such in-sertions or deletions in the putative promoter region, although the mutation of single or multiple SNPs in the type III se-quence relative to their type II counterparts was not sufficient to confer type II-like promoter activity. These data suggest that the interaction of SNPs from different regions of the upstream sequence may be necessary for the increased activity of the type III promoter. Regardless, for 46.m01601 the DNA bind-ing proteins that mediate these differences in transcription are unknown, and it will be of great interest to determine if par-asite nuclear proteins would interact more or less strongly with the type III 46.m01601 promoter than with the type II version. The identification of these putative transcription factor pro-teins could yield great insights into possibly novel mechanisms of gene regulation inToxoplasma.
One of the goals of this work was to identify genes that might be responsible for differences in virulence seen between strains. To this end, we factored these data into parallel studies mapping virulence loci inToxoplasma(30). One virulence lo-cus mapped to a region of the genome that includedROP18,
one of the genes identified here as having major strain-specific differences in transcript abundance. This difference was one of the factors used to identifyROP18as potentially responsible for the heightened virulence of type II strains relative to type III strains (30). A type III strain stably transformed with a type II allele of ROP18 is ⬎10,000-fold more virulent than the starting type III strain, confirming the key role ofROP18 in virulence.
The predicted ROP18 protein is highly polymorphic among types I, II, and III (30, 37). Based on quantitative real-time PCR data forROP18(30), the difference in hybridization in-tensity appears to be due to actual differences in transcript abundance between type II and type III strains rather than to this extreme level of polymorphism. Based on the luciferase reporter data presented here, the large insertion/deletion in the type III promoter compared to the type II promoter is likely responsible for at least some of the expression differ-ences observed. Note, however, that the observed difference in luciferase activity (6.3⫾0.6-fold higher in type II) was much smaller than the difference inROP18transcript levels between a type II and a type III strain as determined by real-time quantitative PCR (⬃15,000-fold [30]). This suggests that tran-sient transfection is only an approximate assay for measuring promoter strength and/or that other factors, such as polymor-phisms present in UTRs, may also play a role (12). Indeed, the type II and type IIIROP18alleles have a comparatively high number of polymorphisms in those portions of the promoter/5⬘ UTR that they have in common as well as in the shared 2,000 bp 3⬘of the stop codon (2.8 and 4.9%, respectively [Table 1]). Epigenetic factors, such as chromatin modifications, which have been shown to be important in T. gondii stage-specific gene expression (32), could also be responsible for this ob-served disparity and in general may also play a role in modu-lating strain-specific transcript abundance.
Secreted proteins represented an unexpectedly large frac-tion of the genes identified in this analysis. This may not be entirely surprising, since secreted proteins that are destined for the specializedToxoplasmasecretory organelles often encode proteins that are crucial for interactions with the host and therefore may be under strong positive selection for change to fine tune interactions with a particular host or even to expand the host range. Since the loci identified in this study encode putatively secreted proteins more often than would be pre-dicted by chance, it will be of great interest to determine the effects that their expression level differences have on interac-tions with host cells in vitro and in vivo. One of the loci identified here,ROP8, is within a region in theT. gondii ge-nome that appears to contain multiple copies of genes encod-ing highly similar, ROP8-like proteins (includencod-ing ROP2 [3, 5]). The level of similarity of these sequences is such that the cDNAs present on the array would most likely not distinguish between them. One intriguing possibility is that the differences in hybridization intensity between type II and type III strains for theROP8spots on the array are due to differences in copy number between strains rather than to actual transcriptional differences. Further work dissecting the locus containing ROP2, ROP8, and other closely related copies of this gene family will be necessary in order to determine if this is the case. For two of the genes identified in this study, we showed that hybridization differences between the parents and among the
on September 8, 2020 by guest
http://ec.asm.org/
progeny were due to extreme polymorphism (as fortoxofilin) or deletion of the locus itself (gene model 79.m00015). For most of the genes identified here, however, the reasons for differences in transcript levels are unknown. In future work this can be determined by using a combination of promoter and polymorphism analyses and qPCR with primers for sequences in common between the two strains. Based on the degree of DNA sequence variation between type II and type III strains at these loci, however, it is likely that at least some of these genes will have sequences in their promoters that result in differences in transcript abundance (as was observed for 46.m01601), since many of them do not have levels of DNA variation substan-tially above average (Table 1).
The spotted cDNA microarrays used in the present study do have some disadvantages compared to recently designed oli-gonucleotide arrays. These include less-extensive gene cover-age (our arrays contain probes for approximately 25% of the predicted Toxoplasma genes, in contrast to nearly complete coverage for the AffymetrixToxoplasma expression array), a lower range of hybridization intensities than can be measured by the Affymetrix platform, and lower precision (see, e.g., ref-erence 40). However, there are some advantages to the spotted cDNA platform for our eQTL mapping approach. In situ-synthesized oligonucleotide arrays (such as those produced by Affymetrix and Nimblegen) are extremely sensitive to polymor-phisms between the sample and the probe sequence and are capable of differentiating a single polymorphism if it is in the middle of the probe. In contrast, spotted cDNA probes are much less affected by polymorphisms. In the present study, for thetoxofilinlocus, two probes with polymorphism percentages of 8 and 10% between type II and type III strains hybridized equally well to type II and type III cDNAs (probes 4 and 6 [Fig. 2A]). In most cases, only those probes with type II versus type III polymorphism percentages greater than 20% exhibited dra-matic differences in hybridization to type II and type III cDNAs, which, we determined by qPCR, were not due to differences in transcript abundance. Another advantage of the spotted array platform in general is that the arrays contain randomly selected cDNAs, and therefore their presence on the microarray is not dependent on gene prediction algorithms. In the present study, this resulted in the identification of a tran-script (TgDT.544460) that does not correspond to a predicted Toxoplasmagene but is clearly has different abundances in type II versus type III strains and among their F1 progeny. This transcript is not present on the current version of the Toxo-plasmaAffymetrix microarray. In the case ofROP8, we found that our spotted cDNA data were in conflict with publicly released data using theToxoplasmaAffymetrix gene chip for comparing type II and type III strains. However when we assessed differences inROP8transcript abundance using real-time qPCR, we found strong agreement with our spotted cDNA array data. This discrepancy could be due to differences in the type II and type III strains used (ME49 versus CTg in our study compared to Prugniaud versus VEG in the publicly released data) and/or their passage histories. While the major-ity of strain-specific gene expression profiles are consistent between our data and the publicly available data, the differ-ences in ROP8 levels observed in the different studies may indicate that the transcript abundances of certain genes, and possibly of rhoptry proteins in general, may be more
respon-sive than other genes to minor differences in parasite cultiva-tion condicultiva-tions in different laboratories. In turn, they may also be more responsive to changes in the host environment in vivo, which would be reasonable given their prominent role in the interactions betweenToxoplasmaand its host (5, 8).
Notrans-mapping eQTL were identified in this study. This observation cannot be used to propose that there are no tran-scription factors inToxoplasma gondii, since only 20% of the transcriptome was present on the microarrays that we used. Moreover, in at least one study,trans-mapping eQTL were at least 10-fold less frequent than those mapping incisand were subject to higher false-negative rates thancis-mapping eQTL (21), indicating that their identification may be much more difficult. With only 19 progeny, an expression phenotype due to a trans-acting locus would have to be extremely robust and strictly dichotomous to be mappable.
Overall, these results indicate that strain-specific differences in gene expression are substantial, as first reported more than 20 years ago based on protein analyses (39). The data pre-sented here indicate that strain-specific differences in tran-script abundance can have any of a number of different mech-anisms as their root cause and that many of these differences may be driven by substantial evolutionary pressures.
ACKNOWLEDGMENTS
We thank Michael Behnke and Michael White (Department of Veterinary Molecular Biology, Montana State University) for the fire-fly luciferase plasmid and the tubulin-drivenRenillaplasmid. Prelimi-nary genomic and/or cDNA sequence data and Affymetrix microarray expression data were accessed via ToxoDB.org and/or www.tigr.org /tdb/t_gondii/, and we thank the contributors who generated those data, especially David Roos and Amit Bahl.
Genomic data were provided by The Institute for Genomic Re-search (supported by NIH grant AI05093) and by the Sanger Center (Wellcome Trust). EST sequences were generated by Washington University (NIH grant 1R01AI045806-01A1). S.Y.H. was supported by the Stanford Summer Research Program. This work was also sup-ported by grants to J.W.A. from the BBSRC and the Wellcome Trust, to J.P.J.S. from the University of California Universitywide AIDS Research Program (F04-ST-216), and to J.P.B. from the NIH (F32AI60306), and by an Ellison Foundation Senior Scholar Award and grants AI21423 and AI73756 from the NIH (to J.C.B.).
REFERENCES
1.Ajioka, J. W., J. C. Boothroyd, B. P. Brunk, A. Hehl, L. Hillier, I. D. Manger, M. Marra, G. C. Overton, D. S. Roos, K. L. Wan, R. Waterston, and L. D. Sibley.1998. Gene discovery by EST sequencing inToxoplasma gondii
re-veals sequences restricted to the Apicomplexa. Genome Res.8:18–28.
2.Aurrecoechea, C., M. Heiges, H. Wang, Z. Wang, S. Fischer, P. Rhodes, J. Miller, E. Kraemer, C. J. Stoeckert, Jr., D. S. Roos, and J. C. Kissinger.
2007. ApiDB: integrated resources for the apicomplexan bioinformatics
re-source center. Nucleic Acids Res.35:D427–D430.
3.Beckers, C. J., T. Wakefield, and K. A. Joiner.1997. The expression of Toxoplasmaproteins inNeospora caninumand the identification of a gene
encoding a novel rhoptry protein. Mol. Biochem. Parasitol.89:209–223.
4.Behnke, M. S., J. B. Radke, A. T. Smith, W. J. Sullivan, Jr., and M. W. White.
2008. The transcription of bradyzoite genes inToxoplasma gondiiis
con-trolled by autonomous promoter elements. Mol. Microbiol.68:1502–1518.
5.Boothroyd, J. C., and J. F. Dubremetz.2008. Kiss and spit: the dual roles of Toxoplasmarhoptries. Nat. Rev. Microbiol.6:79–88.
6.Boyle, J. P., B. Rajasekar, J. P. Saeij, J. W. Ajioka, M. Berriman, I. Paulsen, D. S. Roos, L. D. Sibley, M. W. White, and J. C. Boothroyd.2006. Just one cross appears capable of dramatically altering the population biology of a
eukaryotic pathogen likeToxoplasma gondii. Proc. Natl. Acad. Sci. USA
103:10514–10519.
7.Boyle, J. P., X. J. Wu, C. B. Shoemaker, and T. P. Yoshino.2003. Using RNA
interference to manipulate endogenous gene expression in Schistosoma
mansonisporocysts. Mol. Biochem. Parasitol.128:205–215.
8.Bradley, P. J., and L. D. Sibley.2007. Rhoptries: an arsenal of secreted
virulence factors. Curr. Opin. Microbiol.10:582–587.
on September 8, 2020 by guest
http://ec.asm.org/
9.Bradley, P. J., C. Ward, S. J. Cheng, D. L. Alexander, S. Coller, G. H. Coombs, J. D. Dunn, D. J. Ferguson, S. J. Sanderson, J. M. Wastling, and J. C. Boothroyd.2005. Proteomic analysis of rhoptry organelles reveals many
novel constituents for host-parasite interactions in Toxoplasma gondii.
J. Biol. Chem.280:34245–34258.
10.Broman, K. W., H. Wu, S. Sen, and G. A. Churchill.2003. R/qtl: QTL
mapping in experimental crosses. Bioinformatics19:889–890.
11.Carruthers, V. B., O. K. Giddings, and L. D. Sibley.1999. Secretion of
micronemal proteins is associated withToxoplasmainvasion of host cells.
Cell. Microbiol.1:225–235.
12.Cleary, M. D., C. D. Meiering, E. Jan, R. Guymon, and J. C. Boothroyd.
2005. Biosynthetic labeling of RNA with uracil phosphoribosyltransferase allows cell-specific microarray analysis of mRNA synthesis and decay. Nat.
Biotechnol.23:232–237.
13.Cleary, M. D., U. Singh, I. J. Blader, J. L. Brewer, and J. C. Boothroyd.2002. Toxoplasma gondiiasexual development: identification of developmentally regulated genes and distinct patterns of gene expression. Eukaryot. Cell
1:329–340.
14.Coppens, I., J. D. Dunn, J. D. Romano, M. Pypaert, H. Zhang, J. C. Boo-throyd, and K. A. Joiner.2006.Toxoplasma gondiisequesters lysosomes from
mammalian hosts in the vacuolar space. Cell125:261–274.
15.Dzierszinski, F., M. Nishi, L. Ouko, and D. S. Roos.2004. Dynamics of Toxoplasma gondiidifferentiation. Eukaryot. Cell3:992–1003.
16.El Hajj, H., E. Demey, J. Poncet, M. Lebrun, B. Wu, N. Galeotti, M. N. Fourmaux, O. Mercereau-Puijalon, H. Vial, G. Labesse, and J. F. Dubremetz.2006. The ROP2 family ofToxoplasma gondiirhoptry proteins: proteomic and genomic characterization and molecular modeling.
Proteo-mics6:5773–5784.
17.El Hajj, H., M. Lebrun, S. T. Arold, H. Vial, G. Labesse, and J. F. Dubremetz.2007. ROP18 is a rhoptry kinase controlling the intracellular
proliferation ofToxoplasma gondii. PLoS Pathog.3:e14.
18.Emanuelsson, O., S. Brunak, G. von Heijne, and H. Nielsen.2007. Locating proteins in the cell using TargetP, SignalP and related tools. Nat. Protoc.
2:953–971.
19.Gilbert, L. A., S. Ravindran, J. M. Turetzky, J. C. Boothroyd, and P. J. Bradley.2007.Toxoplasma gondiitargets a protein phosphatase 2C to the
nuclei of infected host cells. Eukaryot. Cell6:73–83.
20.Gissot, M., K. A. Kelly, J. W. Ajioka, J. M. Greally, and K. Kim.2007. Epigenomic modifications predict active promoters and gene structure in Toxoplasma gondii. PLoS Pathog.3:e77.
21.Goring, H. H., J. E. Curran, M. P. Johnson, T. D. Dyer, J. Charlesworth, S. A. Cole, J. B. Jowett, L. J. Abraham, D. L. Rainwater, A. G. Comuzzie, M. C. Mahaney, L. Almasy, J. W. MacCluer, A. H. Kissebah, G. R. Collier, E. K. Moses, and J. Blangero.2007. Discovery of expression QTLs using
large-scale transcriptional profiling in human lymphocytes. Nat. Genet.39:
1208–1216.
22.Grigg, M. E., J. Ganatra, J. C. Boothroyd, and T. P. Margolis.2001. Unusual abundance of atypical strains associated with human ocular toxoplasmosis.
J. Infect. Dis.184:633–639.
23.Howe, D. K., and L. D. Sibley.1995.Toxoplasma gondiicomprises three clonal lineages: correlation of parasite genotype with human disease. J.
In-fect. Dis.172:1561–1566.
24.Khan, A., S. Taylor, C. Su, A. J. Mackey, J. Boyle, R. Cole, D. Glover, K. Tang, I. T. Paulsen, M. Berriman, J. C. Boothroyd, E. R. Pfefferkorn, J. P. Dubey, J. W. Ajioka, D. S. Roos, J. C. Wootton, and L. D. Sibley.2005. Composite genome map and recombination parameters derived from three
archetypal lineages ofToxoplasma gondii. Nucleic Acids Res.33:2980–2992.
25.Li, L., J. Crabtree, S. Fischer, D. Pinney, C. J. Stoeckert, Jr., L. D. Sibley, and D. S. Roos.2004. ApiEST-DB: analyzing clustered EST data of the
apicomplexan parasites. Nucleic Acids Res.32:D326–D328.
26.Livak, K. J., and T. D. Schmittgen.2001. Analysis of relative gene expression
data using real-time quantitative PCR and the 2⫺⌬⌬CTmethod. Methods
(Duluth)25:402–408.
27.Mercier, C., S. Lefebvre-Van Hende, G. E. Garber, L. Lecordier, A. Capron, and M. F. Cesbron-Delauw.1996. Commoncis-acting elements critical for
the expression of several genes ofToxoplasma gondii. Mol. Microbiol.21:
421–428.
28.Poupel, O., H. Boleti, S. Axisa, E. Couture-Tosi, and I. Tardieux.2000.
Toxofilin, a novel actin-binding protein fromToxoplasma gondii, sequesters
actin monomers and caps actin filaments. Mol. Biol. Cell11:355–368.
29.Radke, J. R., M. J. Gubbels, M. E. Jerome, J. B. Radke, B. Striepen, and M. W. White.2004. Identification of a sporozoite-specific member of the ToxoplasmaSAG superfamily via genetic complementation. Mol. Microbiol.
52:93–105.
30.Saeij, J. P., J. P. Boyle, S. Coller, S. Taylor, L. D. Sibley, E. T. Brooke-Powell, J. W. Ajioka, and J. C. Boothroyd.2006. Polymorphic secreted kinases are
key virulence factors in toxoplasmosis. Science314:1780–1783.
31.Saeij, J. P., S. Coller, J. P. Boyle, M. E. Jerome, M. W. White, and J. C. Boothroyd.2007.Toxoplasmaco-opts host gene expression by injection of a
polymorphic kinase homologue. Nature445:324–327.
32.Saksouk, N., M. M. Bhatti, S. Kieffer, A. T. Smith, K. Musset, J. Garin, W. J. Sullivan, Jr., M. F. Cesbron-Delauw, and M. A. Hakimi.2005. Histone-modifying complexes regulate gene expression pertinent to the
differentia-tion of the protozoan parasiteToxoplasma gondii. Mol. Cell. Biol.25:10301–
10314.
33.Sibley, L. D., and J. C. Boothroyd.1992. Virulent strains ofToxoplasma gondiicomprise a single clonal lineage. Nature359:82–85.
34.Sibley, L. D., A. J. LeBlanc, E. R. Pfefferkorn, and J. C. Boothroyd.1992. Generation of a restriction fragment length polymorphism linkage map for Toxoplasma gondii. Genetics132:1003–1015.
35.Singh, U., J. L. Brewer, and J. C. Boothroyd.2002. Genetic analysis of
tachyzoite to bradyzoite differentiation mutants inToxoplasma gondiireveals
a hierarchy of gene induction. Mol. Microbiol.44:721–733.
36.Soldati, D., and J. C. Boothroyd.1995. A selector of transcription initiation
in the protozoan parasiteToxoplasma gondii. Mol. Cell. Biol.15:87–93.
37.Taylor, S., A. Barragan, C. Su, B. Fux, S. J. Fentress, K. Tang, W. L. Beatty, H. E. Hajj, M. Jerome, M. S. Behnke, M. White, J. C. Wootton, and L. D. Sibley.2006. A secreted serine-threonine kinase determines virulence in the
eukaryotic pathogenToxoplasma gondii. Science314:1776–1780.
38.Trujillo, M., R. G. Donald, D. S. Roos, P. J. Greene, and D. V. Santi.1996. Heterologous expression and characterization of the bifunctional
dihydro-folate reductase-thymidylate synthase enzyme ofToxoplasma gondii.
Bio-chemistry35:6366–6374.
39.Ware, P. L., and L. H. Kasper.1987. Strain-specific antigens ofToxoplasma gondii. Infect. Immun.55:778–783.
40.Woo, Y., J. Affourtit, S. Daigle, A. Viale, K. Johnson, J. Naggert, and G. Churchill.2004. A comparison of cDNA, oligonucleotide, and Affymetrix
GeneChip gene expression microarray platforms. J. Biomol. Tech.15:276–
284.
41.Zhou, X. W., B. F. Kafsack, R. N. Cole, P. Beckett, R. F. Shen, and V. B. Carruthers.2005. The opportunistic pathogenToxoplasma gondiideploys a
diverse legion of invasion and survival proteins. J. Biol. Chem.280:34233–
34244.