Publicly Accessible Penn Dissertations
1-1-2015
Making Detailed Predictions Makes (Some)
Predictions Worse
Theresa Kelly
University of Pennsylvania, [email protected]
Follow this and additional works at:http://repository.upenn.edu/edissertations Part of theOther Psychology Commons
This paper is posted at ScholarlyCommons.http://repository.upenn.edu/edissertations/1074
For more information, please [email protected]. Recommended Citation
Abstract
In this paper, we investigate whether making detailed predictions about an event makes other predictions worse. Across 19 experiments, 10,895 participants, and 415,960 predictions about 724 professional sports games, we find that people who made detailed predictions about sporting events (e.g., how many hits each baseball team would get) made worse predictions about more general outcomes (e.g., which team would win). We rule out that this effect is caused by inattention or fatigue, thinking too hard, or a differential reliance on holistic information about the teams. Instead, we find that thinking about game-relevant details before predicting winning teams causes people to give less weight to predictive information, presumably because predicting details makes information that is relatively useless for predicting the winning team more readily accessible in memory and therefore incorporated into forecasts. Furthermore, we show that this differential use of information can be used to predict what kinds of games will and will not be susceptible to the negative effect of making detailed predictions.
Degree Type
Dissertation
Degree Name
Doctor of Philosophy (PhD)
Graduate Group
Operations & Information Management
First Advisor
Joseph P. Simmons
Keywords
decision-making, forecasting
Subject Categories
MAKING DETAILED PREDICTIONS MAKES (SOME) PREDICTIONS WORSE
Theresa F. Kelly
A DISSERTATION
in
Operations and Information Management
For the Graduate Group in Managerial Science and Applied Economics
Presented to the Faculties of the University of Pennsylvania
in
Partial Fulfillment of the Requirements for the
Degree of Doctor of Philosophy
2015
Supervisor of Dissertation
Joseph P. Simmons, Associate Professor of Operations and Information Management
Graduate Group Chairperson
Eric Bradlow, The K.P. Chao Professor of Marketing, Statistics, and Education
Dissertation Committee
Uri Simonsohn, Associate Professor of Operations and Information Management
Deborah Small, Associate Professor of Marketing and Psychology
ABSTRACT
MAKING DETAILED PREDICTIONS MAKES (SOME) PREDICTIONS WORSE
Theresa F. Kelly
Joseph P. Simmons
In this paper, we investigate whether making detailed predictions about an event makes
other predictions worse. Across 19 experiments, 10,895 participants, and 415,960
predictions about 724 professional sports games, we find that people who made detailed
predictions about sporting events (e.g., how many hits each baseball team would get)
made worse predictions about more general outcomes (e.g., which team would win). We
rule out that this effect is caused by inattention or fatigue, thinking too hard, or a
differential reliance on holistic information about the teams. Instead, we find that
thinking about game-relevant details before predicting winning teams causes people to
give less weight to predictive information, presumably because predicting details makes
information that is relatively useless for predicting the winning team more readily
accessible in memory and therefore incorporated into forecasts. Furthermore, we show
that this differential use of information can be used to predict what kinds of games will
TABLE OF CONTENTS
ABSTRACT ... ii
TABLE OF CONTENTS ... iii
LIST OF TABLES ... vi
Tables in the main text ... vi
Tables in Appendix A1: Experimental instructions and designs ... vi
Tables in Appendix A2: Additional measures ... vii
Tables in Appendix A3: Alternative analyses ... ix
LIST OF FIGURES ... xii
Figures in the main text... xii
Figures in Appendix A1: Experimental instructions and designs ... xii
Figures in Appendix A2: Additional measures ... xviii
INTRODUCTION ... 1
Prior research on detailed predictions ... 1
Forecasters only consider a subset of relevant information ... 4
Forecasters use the information that is most accessible in memory ... 7
Forecasters do not weigh information properly ... 10
The present research: How do detailed predictions affect prediction quality? ... 12
GENERAL METHODS... 15
Sample... 16
Procedure ... 16
Prediction Quality ... 22
Additional Measures ... 23
RESULTS ... 27
Does predicting scores make winner predictions worse? ... 27
Does predicting other event details make predictions worse? ... 29
Are predictions worse because people pay less attention? ... 31
Are predictions worse because people think harder? ... 34
Are predictions worse because people think less globally or more locally? ... 37
Do people who make detailed predictions use useful information less? ... 38
GENERAL DISCUSSION ... 47
APPENDIX A1: EXPERIMENTAL INSTRUCTION AND DESIGNS ... 51
Example Experiment ... 51
Individual Experiments ... 59
Experiment 1 ... 60
Experiment 2 ... 63
Experiment 3 ... 67
Experiment 4 ... 71
Experiment 5 ... 75
Experiment 6 ... 79
Experiment 7 ... 82
Experiment 8 ... 85
Experiment 9 ... 89
Experiment 10 ... 90
Experiment 11 ... 90
Experiment 12 ... 91
Experiment 13 ... 94
Experiment 14 ... 99
Experiment 15 ... 100
Experiment 16 ... 105
Experiment 17 ... 111
Experiment 18 ... 115
Experiment 19 ... 116
Excluded Experiments ... 120
Experiment E1 ... 121
Experiment E2 ... 124
Experiment E3 ... 124
Experiment E4 ... 125
Experiment E5 ... 130
Experiment E6 ... 133
Experiment E7 ... 139
APPENDIX A2: ADDITIONAL MEASURES ... 147
Winning team probabilities / base rates (Experiments 7, 9, 11, 14-19) ... 147
Prediction strategy (Experiments 3-6, 8, 10, 12) ... 151
“Global” and “local” considerations (Experiments 1-16, E1-E8) ... 151
“This time” vs. “usually” considerations (Experiments 17-19) ... 154
Confidence and motivation (Experiments 3-19, E1-E8)... 157
Thinking carefully and effortfully (Experiments 13, 14, 19) ... 159
Outcome variability (Experiments 8, 10)... 161
Outcome usefulness for predicting the winning team (Experiments 8, 10) ... 163
Team liking (Experiment 12) ... 164
Self-reported sports following and knowledge (Experiments 6-19, E5-E8) ... 167
Measured knowledge (Experiments 1-19, E1-E8) ... 168
Maximizing Tendency Scale (Experiments 1-2) ... 172
Gender and age (Experiments 1-19, E1-E8) ... 174
Instruction difficulty/confusion (Experiments 7, 9, 11, 14-19) ... 174
Contact for future studies (Experiments 1-19, E1-E8) ... 176
APPENDIX A3. ALTERNATIVE ANALYSES ... 177
Summary of experimental results ... 178
Does predicting scores make winner predictions worse? ... 185
Does predicting other event details make predictions worse? ... 187
Are predictions worse because people pay less attention? ... 189
Are predictions worse because people think harder? ... 191
Are predictions worse because people think less globally or more locally? ... 193
Do people who make detailed predictions use useful information less? ... 193
Which games will show the effect? ... 197
LIST OF TABLES
Tables in the main text
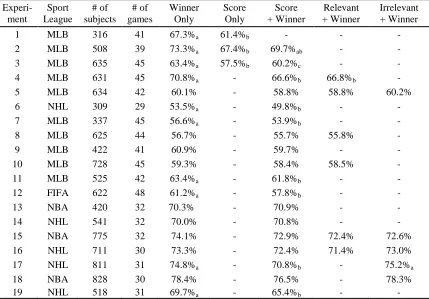
Table 1. Experiments 1-19: Percentage of participants making wise predictions in each
prediction condition. ... 26
Table 2. Experiments 1-5, 7-11, and 13-19: How much weight participants in the Winner condition gave to win/loss records and home field advantage when making predictions. ... 41
Table 3. Experiments 1-5, 7-11, and 13-19: Differences in information weights from the Winner condition in the detailed prediction conditions. ... 43
Tables in Appendix A1: Experimental instructions and designs Table A1 1. Experiment 1 design. ... 60
Table A1 2. Experiment 2 design. ... 63
Table A1 3. Experiment 3 design. ... 67
Table A1 4. Experiment 4 design. ... 71
Table A1 5. Experiment 5 design. ... 75
Table A1 6. Experiment 6 design. ... 79
Table A1 7. Experiment 7 design. ... 82
Table A1 8. Experiment 8 design. ... 85
Table A1 9. Experiment 9 design. ... 89
Table A1 10. Experiment 10 design. ... 90
Table A1 11. Experiment 11 design. ... 90
Table A1 12. Experiment 12 design. ... 91
Table A1 14. Experiment 14 design. ... 99
Table A1 15. Experiment 15 design. ... 100
Table A1 16. Experiment 16 design. ... 105
Table A1 17. Experiment 17 design. ... 111
Table A1 18. Experiment 18 design. ... 115
Table A1 19. Experiment 19 design. ... 116
Table A1 20. Experiment E1 design. ... 121
Table A1 21. Experiment E2 design. ... 124
Table A1 22. Experiment E3 design. ... 124
Table A1 23. Experiment E4 design. ... 125
Table A1 24. Experiment E5 design. ... 130
Table A1 25. Experiment E6 design. ... 133
Table A1 26. Experiment E7 design. ... 139
Table A1 27. Experiment E8 design. ... 143
Tables in Appendix A2: Additional measures Table A2 1. Average % of winning team probabilities that agreed with the market favorite. ... 150
Table A2 2. Average % of winning team probabilities that were consistent with the participants' own predictions. ... 150
Table A2 3. Means and standard deviations of "global" and "local" considerations. ... 153
Table A2 5. Means and standard deviations of "this time" and "usually" considerations. ... 156
Table A2 6. Correlations of "this time" and "usually" considerations with winning team prediction quality. ... 156
Table A2 7. Means and standard deviations of confidence and motivation. ... 158
Table A2 8. Correlations of confidence and motivation with winning team prediction quality. ... 158
Table A2 9. Means and standard deviations of careful and effortful thinking. ... 160
Table A2 10. Correlations of careful and effortful thinking with winning team prediction quality. ... 161
Table A2 11. Means and standard deviations of outcome variability. ... 162
Table A2 12. Correlations of outcome variability with winning team prediction quality. ... 162
Table A2 13. Means and standard deviations of outcome usefulness for predicting the winning team. ... 163
Table A2 14. Correlations of outcome usefulness for predicting the winning team with winning team predictions quality. ... 164
Table A2 15. Means and standard deviations of liking ratings by country. ... 165
Table A2 16. Effect of liking on winning team prediction quality. ... 166
Table A2 17. Means and standard deviations of self-reported sports knowledge and following. ... 168
Table A2 18. Correlations of self-reported sports knowledge and following with winning team prediction quality. ... 168
Table A2 19. Means and standard deviations of measured knowledge scores. ... 171
Table A2 20. Correlations of measured sports knowledge with winning team prediction quality. ... 172
Tables in Appendix A3: Alternative analyses
Table A3 1. Game-Level Analyses. Experiments 1-19: The average percentage of participants making wise predictions in each prediction condition for each
experiment... 179
Table A3 2. Participant-Level Analyses. Experiments 1-19: The average percentage of wise predictions made by participants in each prediction condition for each
experiment... 181
Table A3 3. Prediction-Level Analyses. Experiments 1-19: The percentage of wise predictions made in each prediction condition for each experiment. ... 183
Table A3 4. Game-Level Analyses. Experiments 2-19: The average percentage of participants making wise predictions in the Winner and Score + Winner conditions. ... 185
Table A3 5. Participant-Level Analyses. Experiments 2-19: The average percentage of wise predictions made by participants in the Winner and Score + Winner conditions. ... 186
Table A3 6. Prediction-Level Analyses. Experiments 2-19: The percentage of wise predictions made in the Winner and Score + Winner conditions. ... 186
Table A3 7. Game-Level Analyses. Experiments 4, 5, 8, 10, 15, and 16: The average percentage of participants making wise predictions in the Winner, Score + Winner, and Relevant + Winner conditions. ... 187
Table A3 8. Participant-Level Analyses. Experiments 4, 5, 8, 10, 15, and 16: The average percentage of wise predictions made by participants in the Winner, Score + Winner, and Relevant + Winner conditions. ... 188
Table A3 9. Prediction-Level Analyses. Experiments 4, 5, 8, 10, 15, and 16: The
percentage of wise predictions made in the Winner, Score + Winner, and Relevant + Winner conditions. ... 188
Table A3 11. Participant-Level Analyses. Experiments 5 and 15-18: The average percentage of wise predictions made by participants in the Winner, Score + Winner, and Irrelevant + Winner conditions. ... 190
Table A3 12. Prediction-Level Analyses. Experiments 5 and 15-18: The percentage of wise predictions made in the Winner, Score + Winner, and Irrelevant + Winner conditions. ... 190
Table A3 13. Game-Level Analyses. Experiments 13, 14, and 19: The average percentage of participants making wise predictions in the Winner and Score + Winner conditions for low- versus high-incentives. ... 191
Table A3 14. Participant-Level Analyses. Experiments 13, 14, and 19: The average percentage of wise predictions made by participants in the Winner and Score + Winner conditions for low- versus high-incentives. ... 192
Table A3 15. Prediction-Level Analyses. Experiments 13, 14, and 19: The percentage of wise predictions made in the Winner and Score + Winner conditions for low- versus high-incentives. ... 192
Table A3 16. Game-Level Analyses. Experiments 1-5, 7-11, and 13-19: The change in the percentage of participants in the Winner condition choosing the team to win based on win/loss records and home field advantage. ... 193
Table A3 17. Participant-Level Analyses. Experiments 1-5, 7-11, and 13-19: The average weights participants in the Winner condition gave to win/loss records and home field advantage. ... 194
Table A3 18. Prediction-Level Analyses. Experiments 1-5, 7-11, and 13-19: The weights given to win/loss records and home field advantage in the Winner condition. ... 194
Table A3 19. Game-Level Analyses. Experiments 1-5, 7-11, and 13-19: Differences from the Winner condition in the change in the percentage of participants choosing the team to win based on win/loss records and home field advantage. ... 195
Table A3 21. Prediction-Level Analyses. Experiments 1-5, 7-11, and 13-19: Differences from the Winner condition in the weights given to win/loss records and home field advantage. ... 196
Table A3 22. Game-Level Analyses. Experiments 1-19: The percentage of participants making wise predictions by prediction condition and which team had the better record. ... 197
Table A3 23. Participant-Level Analyses. Experiments 1-19: The average percentage of wise predictions made by participants by prediction condition and which team had the better record. ... 198
LIST OF FIGURES
Figures in the main text
Figure 1. Example of the Winner and Score + Winner conditions (Experiment 4)... 19
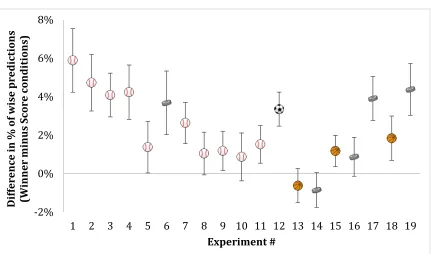
Figure 2. Experiments 1-19: The difference in the percentage of wise predictions in the Winner vs. Score conditions. ... 28
Figure 3. Experiments 4, 5, 8, 10, 15, and 16: The average percentage of participants making wise predictions in the Winner, Score + Winner, and Relevant + Winner conditions. ... 31
Figure 4. Experiments 5 and 15-18: The average percentage of participants making wise predictions in the Winner, Score + Winner, and Irrelevant + Winner conditions. ... 34
Figure 5. Experiments 13, 14, and 19: The average percentage of participants making wise predictions in the Winner and Score + Winner conditions for low- versus high-incentives. ... 37
Figure 6. Experiments 1-5, 7-11, and 13-19: The increase in the likelihood of predicting a team to win when it had the better record and when it was the home team for Winner vs. Score conditions (A), Winner vs. Relevant detailed conditions (B), and Winner vs. Irrelevant detailed. ... 43
Figure 7. Experiments 1-5, 7-11, and 13-19: The percentage of participants predicting that the home team would win by prediction condition and difference in win/loss records. ... 45
Figure 8. Experiments 1-19: The percentage of participants making wise predictions by whether the home team also had the better record. ... 46
Figures in Appendix A1: Experimental instructions and designs Figure A1 1. Example Experiment: Informed consent. ... 51
Figure A1 2. Example Experiment: Winner condition instructions. ... 52
Figure A1 3. Example Experiment: Winner condition predictions. ... 52
Figure A1 5. Example Experiment: Score + Winner predictions. ... 53
Figure A1 6. Example Experiment: Prediction strategy. ... 54
Figure A1 7. Example Experiment: “Global” and “local” considerations... 54
Figure A1 8. Example Experiment: Winner condition confidence and motivation. ... 55
Figure A1 9. Example Experiment: Score + Winner condition confidence and motivation. ... 55
Figure A1 10. Example Experiment: Self-reported following and knowledge. ... 56
Figure A1 11. Example Experiment: Measured knowledge. ... 57
Figure A1 12. Example Experiment: Gender, age, and contact. ... 58
Figure A1 13. Example Experiment: Survey completion. ... 58
Figure A1 14. Experiment 1: Winner condition predictions... 61
Figure A1 15. Experiment 1: Score Only condition predictions. ... 62
Figure A1 16. Experiment 2: Winner condition predictions... 64
Figure A1 17. Experiment 2: Score Only condition predictions. ... 65
Figure A1 18. Experiment 2: Score + Winner condition predictions. ... 66
Figure A1 19. Experiment 3: Winner condition predictions... 67
Figure A1 20. Experiment 3: Score Only condition predictions. ... 68
Figure A1 21. Experiment 3: Score + Winner condition predictions (incentivized for correct winning team selection). ... 69
Figure A1 22. Experiment 3: Score + Winner condition predictions (incentivized for correct exact final score). ... 70
Figure A1 23. Experiment 4: Winner condition predictions... 71
Figure A1 24. Experiment 4: Score + Winner condition predictions. ... 72
Figure A1 26. Experiment 4: Hits + Winner condition predictions. ... 73
Figure A1 27. Experiment 4: Runs + Winner condition instructions. ... 74
Figure A1 28. Experiment 4: Runs + Winner condition predictions. ... 74
Figure A1 29. Experiment 5: Winner condition predictions... 75
Figure A1 30. Experiment 5: Score + Winner condition predictions. ... 76
Figure A1 31. Experiment 5: Runs + Winner condition predictions. ... 77
Figure A1 32. Experiment 5: Time + Winner instructions. ... 78
Figure A1 33. Time + Winner condition predictions. ... 78
Figure A1 34. Experiment 6: Winner condition predictions (with records). ... 79
Figure A1 35. Experiment 6: Score + Winner condition predictions (with records). ... 80
Figure A1 36. Experiment 6: Winner condition predictions (without records). ... 81
Figure A1 37. Experiment 6: Score + Winner condition predictions (without records). . 81
Figure A1 38. Experiment 7: Winner condition predictions... 82
Figure A1 39. Experiment 7: Score + Winner condition predictions. ... 83
Figure A1 40. Experiment 7: Base rates instructions (all conditions). ... 84
Figure A1 41. Experiment 7: Base rates (all conditions). ... 84
Figure A1 42. Experiment 8: Winner condition predictions... 85
Figure A1 43. Experiment 8: Score + Winner condition predictions. ... 86
Figure A1 44. Experiment 8: Hits + Winner condition predictions. ... 87
Figure A1 45. Experiment 8: Runs + Winner condition predictions. ... 88
Figure A1 46. Experiment 12: Winner condition predictions... 92
Figure A1 48. Experiment 13: Winner condition instructions (small bonus). ... 95
Figure A1 49. Experiment 13: Winner condition predictions (small bonus). ... 95
Figure A1 50. Experiment 13: Winner condition instructions (large bonus). ... 96
Figure A1 51. Experiment 13: Winner condition predictions (large bonus). ... 96
Figure A1 52. Experiment 13: Score + Winner condition instructions (small bonus). .... 97
Figure A1 53. Experiment 13: Score + Winner condition predictions (small bonus). ... 97
Figure A1 54. Experiment 13: Score + Winner condition instructions (large bonus). ... 98
Figure A1 55. Experiment 13: Score + Winner condition predictions (large bonus). ... 98
Figure A1 56. Experiment 15: Winner condition predictions... 101
Figure A1 57. Experiment 15: Score + Winner condition predictions. ... 102
Figure A1 58. Experiment 15: Free Throws + Winner condition instructions. ... 103
Figure A1 59. Experiment 15: Free Throws + Winner condition predictions. ... 103
Figure A1 60. Experiment 15: Temperature + Winner condition instructions. ... 104
Figure A1 61. Experiment 15: Temperature + Winner condition predictions. ... 104
Figure A1 62. Experiment 16: Winner condition predictions... 106
Figure A1 63. Experiment 16: Score + Winner condition predictions. ... 107
Figure A1 64. Experiment 16: Saves + Winner condition instructions. ... 108
Figure A1 65. Experiment 16: Saves + Winner condition predictions. ... 108
Figure A1 66. Experiment 16: Crowd + Winner condition instructions... 109
Figure A1 67. Experiment 16: Crowd + Winner condition predictions. ... 109
Figure A1 68. Experiment 16: Base rates (all conditions). ... 110
Figure A1 70. Experiment 17: Score + Winner condition predictions. ... 112
Figure A1 71. Experiment 17: Temperature + Winner condition predictions. ... 112
Figure A1 72. Experiment 17: July 4th + Winner condition instructions. ... 113
Figure A1 73. Experiment 17: July 4th + Winner condition predictions. ... 113
Figure A1 74. Experiment 17: Base rates (all conditions). ... 114
Figure A1 75. Experiment 19: Bonus instructions... 117
Figure A1 76. Experiment 19: Winner condition predictions (small bonus). ... 117
Figure A1 77. Experiment 19: Winner condition predictions (large bonus). ... 118
Figure A1 78. Experiment 19: Score + Winner condition predictions (small bonus). ... 118
Figure A1 79. Experiment 19: Score + Winner condition predictions (large bonus). .... 119
Figure A1 80. Experiment 19: Base rates (all conditions). ... 119
Figure A1 81. Experiment E1: Winner condition predictions. ... 121
Figure A1 82. Experiment E1: Score + Winner condition predictions. ... 122
Figure A1 83. Experiment E1: Points + Winner condition instructions. ... 123
Figure A1 84. Experiment E1: Points + Winner condition predictions. ... 123
Figure A1 85. Experiment E4: Winner condition predictions (NBA). ... 126
Figure A1 86. Experiment E4: Score + Winner condition predictions (NBA). ... 127
Figure A1 87. Experiment E4: Winner condition predictions (NHL). ... 128
Figure A1 88. Experiment E4: Score + Winner condition predictions (NHL). ... 129
Figure A1 89. Experiment E5: Winner condition predictions. ... 130
Figure A1 90. Experiment E5: Score + Winner condition predictions. ... 131
Figure A1 92. Experiment E5: Crowd + Winner condition predictions. ... 132
Figure A1 93. Experiment E6: Winner condition predictions (no majority winner prediction). ... 133
Figure A1 94. Experiment E6: Score + Winner condition predictions (no majority winner prediction). ... 134
Figure A1 95. Experiment E6: Winner condition instructions (with majority winner prediction). ... 135
Figure A1 96. Experiment E6: Winner condition predictions (with majority winner prediction). ... 136
Figure A1 97. Experiment E6: Score + Winner condition instructions (with majority winner prediction). ... 137
Figure A1 98. Experiment E6: Score + Winner condition predictions (with majority winner prediction). ... 138
Figure A1 99. Experiment E7: Winner condition predictions (no majority winner prediction). ... 139
Figure A1 100. Experiment E7: Score + Winner condition predictions (no majority winner prediction). ... 140
Figure A1 101. Experiment E7: Winner condition predictions (with majority winner prediction). ... 141
Figure A1 102. Experiment E7: Score + Winner condition (with majority winner prediction). ... 142
Figure A1 103. Experiment E8: Winner condition predictions. ... 143
Figure A1 104. Experiment E8: Score + Winner condition predictions. ... 144
Figure A1 105. Experiment E8: Free Throws + Winner condition instructions. ... 145
Figure A1 106. Experiment E8: Free Throws + Winner condition predictions... 145
Figure A1 107. Experiment E8: Temperature + Winner condition instructions... 146
Figures in Appendix A2: Additional measures
Figure A2 1. Winning team probability instructions. ... 148
Figure A2 2. Winning team probability question format (Experiments 7, 9, 11, and 14-15). ... 149
Figure A2 3. Winning team probability question format (Experiments 16-19). ... 149
Figure A2 4. Prediction strategy question format. ... 151
Figure A2 5. "Global" and "local" considerations question format. ... 152
Figure A2 6. "This time" and "usually" considerations question format. ... 155
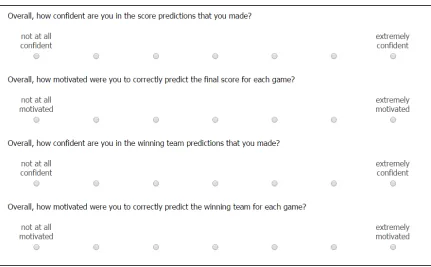
Figure A2 7. Confidence and motivation question format. ... 157
Figure A2 8. Thinking carefully and effortfully question format. ... 160
Figure A2 9. Outcome variability instructions. ... 162
Figure A2 10. Outcome variability question format. ... 162
Figure A2 11. Outcome usefulness for predicting the winning team question format. .. 163
Figure A2 12. Team liking question format. ... 164
Figure A2 13. Self-reported sports following and knowledge question format. ... 167
Figure A2 14. Histograms of responses for self-reported sports knowledge and following. ... 167
Figure A2 15. Measured sports knowledge instructions. ... 170
Figure A2 16. Example of measured knowledge question format (team/division matching). ... 170
Figure A2 17. Example of measured knowledge question format (player/team matching). ... 170
Figure A2 18. Histogram of measured knowledge scores. ... 171
Figure A2 20. Gender and age question format. ... 174
Figure A2 21. Question difficulty question format (Experiment 7). ... 175
Figure A2 22. Question difficulty question format (Experiments 9, 11, and 14-19). ... 175
Figure A2 23. Contact for future studies sport selection. ... 176
INTRODUCTION
Good decisions often depend on good predictions. For example, an investment
decision hinges on one’s forecast of the market, an admission decision hinges on one’s
forecast of an applicant’s success, and a consumer choice hinges on one’s forecast of a
product’s quality. Thus, understanding the factors that affect prediction quality can also
help people make better decisions.
In this paper, we will demonstrate that making detailed predictions about an event
can make other predictions about that event worse. For example, asking people to predict
how many hits each baseball team will get in an upcoming game (a detailed prediction)
before predicting which team will win the game (a more general prediction) can make
their winning team predictions worse. This suggests that, counter to lay beliefs, thinking
through as many details about an event as possible could do more harm than good.
Prior research on detailed predictions
The question of whether asking more detailed prediction questions makes predictions
worse was first investigated by Yoon, Suk, Goo, Lee, and Lee (2013). Specifically, they
investigated whether more detailed versions of prediction questions led to less accurate
predictions about general outcomes. For example, predicting the final score of a soccer
game is a more detailed version of predicting the winning team because it not only
requires forecasters to determine which team they think will win, but also requires them
to consider additional details (e.g., whether it will be a low- or high-scoring game, how
many runs the victor will win by, etc.). In their investigation, Yoon and colleagues (2013)
asked participants to predict the outcomes of soccer games by either simply indicating
exact final score of the game.1 In three experiments (N = 65, N = 86, N = 100
participants; n = 16, n = 18, n = 16 games), they found that winning team predictions
were less accurate when participants predicted the final score than when they simply
indicated a win, loss, or tie for the home team (p = .019, p = .037, p = .045). That is,
giving a more detailed version of the winning team prediction (i.e., the score) worsened
winning team prediction accuracy.
Yoon and colleagues claimed that this effect occurred because predicting scores is
more difficult and therefore makes people think too hard about which team will win, and
that thinking harder about their predictions made their predictions worse (e.g.,
Dijksterhuis, Bos, Nordgren, & van Baaren, 2006; Dijksterhuis, Bos, van der Leij, & van
Baaren, 2009). However, as we will explain in more detail later, problems with their
design coupled with the fact that their samples were too small to reliably detect
differences in prediction accuracy means that whether and how detailed predictions affect
predictions about more general outcomes are open questions. We propose that making
detailed predictions makes forecasts of more general outcomes worse because doing so
brings to mind additional information that is not useful for predicting which team will
win the game. Furthermore, forecasters use this relatively useless information in their
predictions, meaning that they necessarily give less weight to more important information.
For example, asking people to predict how many hits each baseball team will get might
lead them to think about the quality of each teams’ pitchers and batters, and so when they
are subsequently asked to predict the winning team, information about pitchers and
batters is top-of-mind and therefore used in their forecasts. Importantly, while this
information might be diagnostic in isolation, it would provide little or no diagnostic
information over and above the information already contained within the teams’ win/loss
records given that the quality of the teams’ players directly affects how many games they
win.2 Therefore, we propose that detailed predictions can make predictions about other
outcomes worse by causing forecasters to think about and use relatively useless
information in their predictions, taking focus away from more predictively valid
information (e.g., the teams’ win/loss records).
This hypothesis stems from three well-established findings from the psychology of
forecasting. First, people do not (and often cannot) consider all of the relevant
information when making predictions. Second, the information that people do consider
tends to be the information that is most accessible in memory, even if this information is
not the most predictively valid information available. Finally, forecasters are largely
unable to accurately weigh each piece of information according to its predictive value,
meaning that they tend to give too much weight to less useful information and too little
weight to more useful information in forecasts. Together, these three tendencies suggest
that drawing people’s attention to less important details about an event should make
predictions about more general outcomes worse. Importantly, in this account people are
not thinking more or less hard about their predictions. Rather, they are simply thinking
about different information and using that information suboptimally.
2 It should also be noted that people often overestimate the value of redundant information for forecasting
Forecasters only consider a subset of relevant information
When trying to predict the outcome of a future event, people are naturally inclined to
imagine ways in which that event might unfold. For example, people trying to predict
how much they would enjoy going on a camping trip with friends might first imagine
what activities they would do on the trip, what the weather would be like, how well
everyone would get along, etc. Furthermore, people use how easy it is to imagine
scenarios leading to a certain outcome (e.g., enjoying the trip) to estimate how likely that
outcome is to occur, and so people rely heavily on the scenarios that they happen to
imagine to make predictions about the future (Kahneman & Tversky 1981; Tversky &
Kahneman 1973). However, people tend to only consider a handful of possible scenarios,
and potentially important but unimagined scenarios are not incorporated into forecasts,
leading to poor and inconsistent predictions (for reviews, see Dunning, 2007; Kahneman
& Lovallo, 1993; Lagnado & Sloman, 2004; Lovallo & Kahneman, 2003). Thus, this
scenario-based method of forecasting is vulnerable to a variety of errors stemming from
the forecaster’s inability to exhaustively consider all of the relevant information for the
prediction.
One example of such an error is focusing too narrowly on the target event and failing
to consider other factors that, while not directly related to the event, would significantly
affect outcomes. For example, when trying to predict how long it will take to complete a
shopping trip, people are likely to build scenarios around things that are directly related
to “getting shopping done” such as driving to the store, looking for products, waiting in
line at checkout, etc., but are unlikely to consider other intervening factors that would
with a cold (Dunning, 2007). Similarly, past research has found that when people try to
predict how much an event will affect their future well-being, they focus too heavily on
the direct impact of the event itself but fail to consider that other events in their lives will
also contribute to their overall well-being (Schkade & Kahneman, 1998; Wilson &
Gilbert, 2005; Wilson, Wheatley, Meyers, & Gilbert, 2000). For example, Wilson and
colleagues (2000) found that college football fans overestimated how long their
emotional well-being would be affected by their football team winning or losing a game
because they largely did not consider how other future events would also affect their
happiness (e.g., studying for exams, going to parties).
Forecasters also have difficulty considering information that is either abstract or not
explicitly presented to them at the time of the prediction. For example, when estimating
the likelihood that a complex system such as a car will fail, one strategy is to construct a
“fault tree” by listing all the things that could go wrong, such as “dead battery” or
“defective fuel system” (concrete causes), and adding a category for “all other problems”
(abstract causes). Then, the forecaster estimates the probability of failure for each
category to determine the total probability of failure for the entire system. However,
Fischhoff, Slovic, & Lichtenstein (1978) found that people did not appropriately transfer
probabilities to the “all other problems” category when some of the concrete causes for
failure were omitted from the fault tree. To illustrate with a simplified example, if
comparing a tree that consists of “dead battery”, “defective fuel system”, and “all other
problems” to a pruned tree consisting of only “dead battery” and “all other problems”, the
probability given to “all other problems” in the pruned tree would be considerably lower
in the full tree. In fact, the participants in Fischhoff et al.’s (1978) experiments were
largely insensitive to what information was missing from fault trees and therefore
significantly underestimated the probability of a system failure in trees that listed fewer
concrete sources of failure. Fischhoff and colleagues (1978) concluded that scenarios that
are not explicitly presented to forecasters are “out of sight, out of mind”, and are not
incorporated into forecasts. Importantly, even though people were able to improve their
predictions by generating their own list of concrete causes belonging to the “all other
problems” category (Dube-Rioux & Russo, 1988), they did not appear to do so unless
explicitly prompted.
Additionally, one of the most common omissions from forecasters’ predictions about
the future is information about what has happened in similar situations in the past
(Dunning, 2007; Kahneman & Lovallo, 1993; Lagnado & Sloman, 2004; Lovallo &
Kahneman, 2003). For example, imagine someone wants to predict how long it will take
her to complete a work project. Rather than considering all of the factors that might
influence how the project would progress (e.g., what resources she has at her disposal, the
availability of her teammates, what other tasks will be competing for her attention, etc.),
she could instead base her prediction on how long it has taken her to complete similar
projects in the past. Buehler and Griffin (2003), however, found that when people
predicted how long it would take them to complete tasks such as Christmas shopping or
class assignments, they mostly reported thinking about what they expected to happen in
the future and rarely reported thinking about how long it took them to complete similar
tasks in the past (see also Buehler, Griffin, & Ross, 1994). Furthermore, participants who
than those who were not. In fact, in many if not most cases, thinking about the outcomes
of similar past events generates superior predictions than imagining what might happen in
the future (Dawes, 1996; Grove, Zald, Lebow, Snitz, & Nelson, 2000; Lovallo &
Kahneman, 2003; Meehl, 1954). This is partially because the kinds of information that
forecasters frequently fail to consider usually has similar effects on the likelihood of
certain outcomes occurring in the future as they did on those outcomes occurring in the
past. However, information about past cases is rarely used as the basis for forecasts
(Dawes, 1996; Grove & Meehl, 1996; Lagnado & Sloman, 2004).
Forecasters use the information that is most accessible in memory
Given that people only consider a subset of the information available to them when
making predictions, it is important to understand the factors that influence what
information they think about. As mentioned in the previous section, the easier it is to
imagine scenarios leading to a certain outcome, the greater the perceived likelihood is
that the outcome will occur. This means that predictions are primarily influenced by the
information that comes most easily to mind, and so the outcomes or scenarios that are
most available (or “accessible”) in memory get incorporated into forecasts.
Indeed, research on this availability heuristic has frequently demonstrated that
incidents that come to mind easily are judged to be more likely (Morewedge & Todorov,
2012; Plous, 1993; Tversky & Kahneman, 1973; Tversky & Kahneman, 1974). There are
multiple factors that contribute to what information becomes readily available in memory.
The most straightforward reason is that some cue is frequently observed in conjunction
with a particular outcome, and over time, people learn the association between the cue
example, people who see dark clouds outside will predict a high chance of rain because
they have observed throughout their lives that dark clouds are usually followed by rain.
In such cases, these cues (e.g., dark clouds) are highly available because they are truly
correlated with outcomes (e.g., rain).
However, there are other factors that affect the availability of information in memory
that are not related to how likely different outcomes are, such as how vividly and how
recently an event was observed. For example, the judged likelihood of being in a car
accident goes up immediately after seeing an overturned car on the side of the road, and
people believe that shark attacks and plane crashes are more likely than they actually are
because these events are featured prominently in the news (Plous, 1993; Tversky &
Kahneman, 1973). Similarly, people erroneously estimate that there are more words that
begin with the letter “r” than words that have “r” as the third letter because it is easier to
generate instances of the former case (e.g., red, rabbit, radio) than the latter (e.g., card,
three, perfume; Tversky & Kahneman, 1973). In another illustration of the use of
non-predictive but highly available information, Morewedge and Todorov (2012) found that
people over-weighted atypical past behaviors in predictions about future behaviors
because atypical behaviors are more memorable, and Bastardi and Shafir (1998) found
that choosing to wait for information (e.g., waiting to find out the exact amount of debt a
mortgage applicant has) made this information more cognitively available and increased
its weight in judgments. Together, these findings mean that the most available
information is not always the most important information, but even so it is still likely to
be used in forecasts. Thus, increasing the availability of relatively unimportant
Also, because recently formed judgments are more available in memory, judgments
that people make earlier can have a downstream influence on subsequent judgments. For
example, in Feldman and Lynch’s (1988) accessibility-diagnosticity framework, answers
to previous questions are often used to approximate the answers to subsequent similar
questions in surveys (e.g., I might not immediately know how much I value animal
welfare, but I just told someone that I love dogs, so I am probably willing to donate $10
to the Animal Welfare Society). This is because preferences and beliefs are constructed
on the spot unless a pre-existing preference or belief is accessible in memory and
sufficiently diagnostic for the question at hand, in which case the pre-existing cognition
will be used instead. In fact, past research has identified several cases and conditions in
which answers to prior questions are used to approximate answers to subsequent
questions (Lynch, Marmorstein, and Weigold 1988; Menon & Raghubir, 2003; Menon,
Raghubir, & Schwarz, 1995; Simmons, Bickart, and Lynch, 1993). Also, as with the
literature on the availability heuristic, Feldman and Lynch (1988) identify that other
determinants of the accessibility of information in memory include how recently it was
activated, how vivid it is, cues from the environment (e.g., priming), etc. This means that
not only will recent judgments be highly accessible, but the information that was used to
make them will also be more accessible as well. These findings suggest that when
forecasters make predictions that are similar to other recent predictions, their previous
predictions and the information they considered when making them will be highly
Forecasters do not weigh information properly
So far we have discussed how forecasters only use a subset of available information,
and how the information they use is heavily influenced by what is most accessible in
memory. Another important component of forecasting, however, is how people use the
information they think about. Even if people were capable of considering all of the
relevant information about a prediction, they would still have a hard time weighing that
information properly. A wealth of past research has found that, in both judgments and
predictions, people tend to assign suboptimal weights to the information they consider.
For example, research on the dilution effect shows that giving people information that
provides little or no additional predictive power generally makes their predictions worse
(Edgell et al., 1996; Nisbett, Zukier, & Lemley, 1981; Troutman & Shanteau, 1977;
Zukier, 1982). For example, Nisbett and colleagues (1981) had graduate students in
social work rate the likelihood that a hypothetical client was a child abuser based on
information that was judged by other social work students to be diagnostic (e.g., “he was
abused by his stepfather”) and information that was judged to be nondiagnostic (e.g., “he
manages a hardware store”). They found that, holding the amount of diagnostic
information constant, increasing the amount of nondiagnostic information about the client
decreased his judged likelihood of being an abuser. Indeed, this detrimental effect of
adding nondiagnostic information to predictions has been found across a wide variety of
domains, including accounting (Hackenbrack, 1992; Hoffman & Patton, 1997; Shelton,
1999), legal decisions (Smith, Stasson, & Hawkes, 1998), and consumer choice (Meyvis
One explanation given to why adding nondiagnostic information makes predictions
worse is that doing so makes the target seem more or less representative of various
outcomes (Lichtenstein, Earl, & Slovic, 1975; Nisbett et al., 1981; but see also Tetlock,
Lerner, & Boettger, 1996). The representativeness heuristic proposed by Tversky and
Kahneman is a mental shortcut whereby people base their judgments and predictions on
how similar (i.e., representative) a situation is to a particular outcome, or how similar a
target is to a particular category (Kahneman & Tversky, 1972; Kahneman & Tversky,
1973; Tversky & Kahneman, 1971; Tversky & Kahneman, 1974). For example, people
judge the likelihood that a man named Tom is an engineer versus a lawyer based on how
well characteristics about Tom (e.g., that he likes mathematical puzzles) are
representative of a stereotypical engineer versus a stereotypical lawyer (Kahneman &
Tversky, 1973). In many cases, judgments of representativeness override more objective
information about the distribution of outcomes in the population (e.g., Tom was selected
from a population that contains 70% lawyers).
However, past research has demonstrated that adding nondiagnostic information
makes predictions worse even in cases where judgments of representativeness are
unaffected or irrelevant (Dana, Dawes, & Peterson, 2013; LaBella & Koehler, 2004;
Nelson, Bloomfield, Hales, and Libby, 2001; Simmons & Lynch, 1991; Tetlock &
Boettger, 1989). This is because, in general, people are bad at weighing different pieces
of information relative to their predictive strength (Buehler et al., 1994; Griffin &
Tversky, 1992; Grove et al., 2000; Helzer & Dunning, 2012; Hutchinson & Alba, 1991;
Slovic, 1975; Slovic & Lichtenstein, 1971; Soll, 1999; Weaver, Garcia, & Schwarz,
predictive power and too little weight to information that has relatively high predictive
power. For example, Hall, Ariss, and Todorov (2007) found that participants who were
only given the win/loss records and half-time scores of basketball games were better at
predicting winning teams than participants who were additionally given the names of the
teams. This was because, while the teams’ identities (and therefore their reputations) did
have some predictive power in isolation, they did not provide any predictive power over
and above the information that was already available (the win/loss records and half time
scores). However, participants did not seem to realize this and gave the team names too
much weight in their predictions. Similarly, people are largely unable to discount the
weight given to information that is largely redundant with existing information (Slovic,
1966; Slovic & Lichtenstein, 1971; Soll, 1999), and people also often give more weight
to the strength of evidence (e.g., how positive a letter of recommendation is) than to the
validity of evidence for predicting outcomes (e.g., how accurately recommendation
letters predict future performance) (Griffin & Tversky, 1992; Nelson et al., 2001). Given
that forecasters are bad at properly integrating and weighing information when making
predictions, it stands to reason that drawing forecasters’ attention to less important details
about the outcomes they are trying to predict would make their predictions worse.
The present research: How do detailed predictions affect prediction quality?
While much research has shown that giving people non-diagnostic information
worsens their predictions, our investigation focuses on how prediction quality might be
affected by the way predictions are elicited. Specifically, we investigate whether asking
people to make detailed predictions affects the quality of their predictions about other
Although Yoon and colleague’s (2013) finding that people who predicted final scores
made less accurate winning team predictions than people who only selected winners
seems to provide preliminary evidence that making detailed predictions can make other
predictions worse, this evidence is limited. First, whereas participants in the “Winner”
(non-detailed) condition were incentivized for correctly predicting the winning team,
those in the “Score” (detailed) condition were incentivized for correctly predicting the
exact final score. It is possible that participants in the Score condition were less
motivated to think carefully about their predictions since predicting exact final scores is
much harder (and therefore much less likely to pay off) than predicting winning teams.
Second, because participants in the Score condition gave their predictions using a more
complicated entry method (typing in each team’s score) it is possible that they simply
made more mistakes than those in the Winner condition. Finally, another potential
problem with Yoon et al.’s design is their definition of prediction quality. In their studies,
they assessed the quality of predictions by comparing the accuracy of predictions across
conditions. However, accuracy in sports predictions is a very unreliable, and thus poor,
measure of prediction quality; moreover, as we will later show, detecting differences in
prediction accuracy would likely require hundreds of games and thousands of participants
rather than the tens of games and participants recruited by Yoon and colleagues. Taken
together, it is unclear whether Yoon et al.’s (2013) result would replicate using a better
measure of prediction quality, and if so, whether it would emerge when the conditions
have the same incentives and the same chance of making mistakes. This means that
whether and how detailed predictions makes predictions about more general outcomes
A few observations from past research on the psychology of forecasting suggests that
making detailed predictions would have a detrimental effect on subsequent related
predictions. First, people only consider a subset of relevant information when making
predictions, and the information they think about depends on how available/accessible it
is in their minds. This suggests that information considered when making detailed
predictions will also be considered when making other similar predictions (so long as that
information seems sufficiently relevant). For example, if people are first asked to predict
how many hits each baseball team will get, they are likely to continue thinking about
information related to how many hits each team will get when predicting which team will
win the game.
Additionally, people do not weigh the information they think about properly, and tend
to give too much weight to information that is relatively unimportant and therefore too
little weight to information that is more important. This suggests that considering
information that relatively unimportant for making the more general prediction will take
weight away from more important information and make predictions worse.
To investigate the question of whether making detailed predictions actually makes
predictions worse, we report the results of 19 experiments examining 415,960 predictions
from 10,895 participants about the outcomes of 724 professional sporting events and find
that making detailed predictions (e.g., the exact final score) does generally make winning
team predictions worse as our theory suggests. Next, we will explore possible alternative
explanations of this effect. We will show that detailed predictions do not worsen
predictions by increasing inattention or fatigue, thinking too hard, or decreasing
thinking about game-relevant details before predicting the winning team causes people to
give less weight to important diagnostic information, presumably because the detailed
information becomes more accessible in memory. Finally, we demonstrate that the
dilution of more useful information means that not all games will show this effect, and
that knowing how people use the information available to them allows us to predict what
kinds of events will and will not be affected by detailed predictions.
GENERAL METHODS
In 19 experiments, we randomly assigned participants to make detailed or
non-detailed predictions about upcoming sporting events and then examined whether people
who made detailed predictions made worse predictions. Professional sports is a uniquely
useful context for studying predictions because sporting events occur frequently, have a
limited number of possible outcomes (win/lose/tie), yield timely and unambiguous results,
and are easy to incentivize. It is also easy to find a large sample of participants who have
some knowledge about the prediction context and are interested and motivated to predict
the outcomes (i.e., sports fans).
In total, we collected 415,960 predictions about 724 sporting events. Ten experiments
investigated predictions of Major League Baseball (MLB) games, five investigated
predictions of National Hockey League (NHL) games, three investigated predictions of
National Basketball Association (NBA) games, and one investigated predictions of
Sample
Across 19 experiments, we recruited 10,896 participants from Amazon’s Mechanical
Turk website for an average of 573 participants per experiment and 191 participants per
experimental condition.3 Most participants were male (71.7%) and the sample’s average
age was 32 years old (SD = 10.0).4 Each study was advertised as a “survey for [sport]
fans” because we wanted participants to have some knowledge about the sport they were
predicting; however, they were not required to prove any knowledge about the sport to
participate. Participants were paid 50 to 75 cents for completing each 10-20 minute
survey and they earned an additional 5 cents for each correct winning team prediction
(the few exceptions to this incentive scheme are described below). The average
participant earned $1.72 (SD = $0.61) in total.
Procedure
All experiments had similar procedures.5 In each study, participants were asked to
predict the outcomes of 29-48 upcoming sports games (M = 38 games per study, SD =
6.7). We sought to have participants predict as many games as possible without making
the survey too long and without asking them to predict games that were too far in the
future, and so the number of games varied by the sport asked about in the experiment. For
example, while there are about fifteen Major League Baseball games per day during the
regular baseball season, the number of National Basketball Association and National
3
We did not screen out participants who had participated in previous prediction studies because each new study required predictions about novel games, and we did not believe that participants needed to be blind to different conditions for the effect to occur. Furthermore, carryover effects between studies would lower the likelihood of finding significant differences between prediction conditions. Across our sample, 57.2% of participants had not previously participated in a prediction experiment.
4 The age calculations exclude five participants who reported ages less than 18 and seven who reported
ages greater than 100.
Hockey League games per day varies considerably (typically between two and twelve
games per day). As a consequence, experiments that asked about baseball games had
participants predict 39-45 games (three days’ worth) while experiments that asked about
basketball or hockey games had participants predict 29-32 games (four days’ worth).
Participants made their predictions all at once 0-3 days before the games, with the
exception of the 48 FIFA World Cup Group Stage predictions in Experiment 12, which
were made 1-15 days before the games.
We manipulated how we elicited participants’ predictions. In all experiments, we
randomly assigned participants to make their predictions by either selecting the winning
team for each game (the “Winner” condition) or by entering the final score for each
game—a more detailed version of the winning team prediction (the “Score Only” or
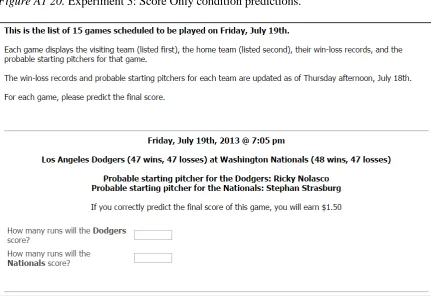
“Score + Winner” conditions).6 Experiments 1-3 included a Score Only condition in
which participants predicted each game’s final score without separately selecting the
winning team. In this condition, we inferred participants’ winner predictions from their
score predictions, as was done by Yoon and colleagues (2013). However, comparing
winning team predictions between “Winner” and “Score Only” conditions is problematic
because the mechanics of entering scores versus simply selecting winners could produce
artifactual differences between conditions. For example, condition differences could
emerge if participants are more likely to make errors when entering scores than when
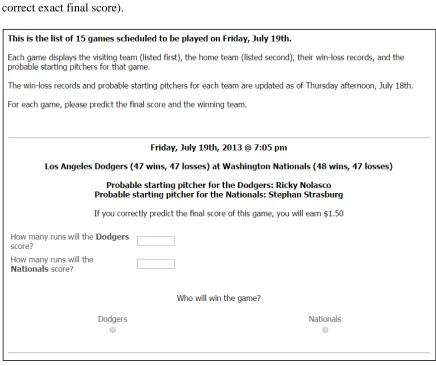
selecting winning teams. To remedy this, Experiments 2-19 included a “Score + Winner”
6 Because Major League Baseball games, National Basketball Association games, and National Hockey
condition in which participants both entered their predicted final score for a game and
then separately selected their predicted winning team.7 This allowed us to make an
apples-to-apples comparison between the Winner condition’s winner predictions and the
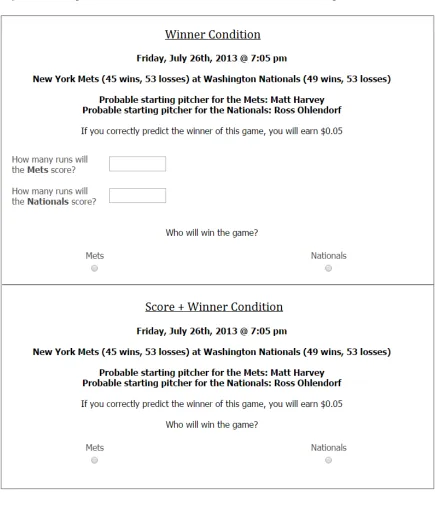
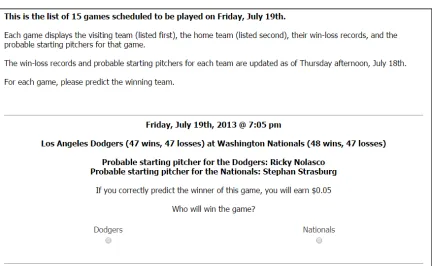
Score + Winner condition’s winner predictions. Figure 1 shows examples of the Winner
and Score + Winner conditions.
7 In every experiment except one (Experiment 2), participants in the Score + Winner condition predicted
Figure 1. Example of the Winner and Score + Winner conditions (Experiment 4).
All predictions were incentivized. Experiments 1-3 followed Yoon et al.’s (2013)
prediction and a larger amount (40 cents) for each correct final score prediction.8 In
Experiment 3, we manipulated whether participants in the Score + Winner condition
earned 5 cents for each correct winning team prediction or 40 cents for each correct final
score prediction. Note that incentivizing different outcomes (exact final scores vs.
winning teams) using different amounts (5 vs. 40 cents) across different conditions
introduces potential confounds when comparing the quality of winning team predictions
between conditions. For this reason, Experiments 4-19 held incentives constant across all
conditions (5 cents for each correct winning team prediction, with the exception of three
experiments described subsequently, in which the incentives were larger for half of the
games). In these studies, we paid all participants in all conditions for correctly predicting
the winning teams; they were never incentivized for accurately predicting any additional
details (e.g., scores, hits, etc.).
As previously mentioned, the 19 experiments investigated different sports: baseball,
basketball, hockey, and soccer. But they also differed in more meaningful ways. Most
importantly, although all experiments included Winner and Score conditions, many
experiments also included conditions in which participants predicted other details about
the game in addition to predicting the winning team. We included these other conditions
because we were interested in whether making any detailed predictions about the game
would make winning team predictions worse. In some conditions, these detailed
predictions were relevant to the game; for example, in three of the baseball experiments
(Experiments 4, 8, and 10), participants in the Hits + Winner condition predicted both the
8 Our payment amounts differed slightly from Yoon et al.’s, who paid 10 cents for each correct winning
number of hits each baseball team would accumulate and which team would win the
game. In other conditions, the predicted details were irrelevant to the game; for example,
in one of the hockey experiments (Experiment 16), participants in the Crowd + Winner
condition predicted what percentage of the crowd at the game would be American
citizens as well as the winning team. Our theory suggests that making any detailed
predictions that are relevant to the game should make winning team predictions worse to
the extent that they prompt forecasters to think about less useful information that gets
incorporated into their subsequent winning team predictions. All detailed predictions
were classified as either “relevant” or “irrelevant” a priori, and the conditions and
predictions in each experiment are described in greater detail in the Results section and in
the note to Table 1.
Experiments also varied in the information given to participants about each game. For
all games, participants were told the date, start time, location, the visiting and home
teams,9 and, in the baseball experiments, the names of the starting pitchers.10 In addition,
although most experiments also gave participants each team’s win/loss records (i.e., the
numbers of games won and lost so far that season), Experiments 6 and 12 did not give
9 Because Experiment 12 investigated FIFA World Cup matches that all took place in Brazil, only one team
(Brazil’s national team) out of 32 could be considered the “home” team. Thus, in this experiment, neither team was designated as “home” or “visiting”.
10 We also ran 8 additional experiments in which we gave participants each team’s “Points Scored” (the
any record information for the teams.11 This allowed us to examine whether providing
this information was necessary to produce the hypothesized effect.
Prediction Quality
We were interested in investigating whether making detailed predictions affects the
quality of people’s predictions. For this reason, in all experiments we compare
participants’ predictions to well-calibrated sports betting markets, which publish odds set
by professional oddsmakers. For each game, oddsmakers use attributes such as team
records, home field advantage, and other information to determine the probability that
each team will win, and those probabilities are reflected in the odds that they set for each
game. These odds provide accurate probability estimates: For example, the home team
won 57.1% of the games when the odds indicated that they had a 55-60% chance of
winning in our data. Importantly, these odds indicate which team is the “likely winner,”
meaning that it is more likely to win the game than the opposing team. In our analyses,
predicting that the likely winner will win the game is considered a “wise” prediction.12 In
all experiments, we assess the wisdom of participants’ winning team predictions,
regardless of prediction condition and what other detailed predictions they made.
11 Experiment 6 also had two conditions in which participants were given team records (wins, losses, points
scored, and points allowed) and two conditions in which participants were not given any records. For the reasons stated in the previous footnote, only the two conditions that did not give record information are included in the analyses presented here. However, we found the same detrimental effect of predicting the score in both the conditions with records, t(27) = 2.29, p = .030, and without records, t(27) = 3.16, p = .004.
12 We could have also defined a wise prediction as a prediction in favor of the team with the superior
Of course, another possible measure of prediction quality is accuracy. And, indeed,
this was the measure used by Yoon and colleagues (2013). However, accuracy is not an
appropriate measure of prediction quality in this context, as a wise prediction is one that
predicts that the most probable outcome will occur, regardless of whether that outcome
actually occurs. To illustrate, consider a biased coin that comes up heads 60% of the time.
A noisy and imprecise measure of prediction quality is whether someone’s prediction
about the outcome of the coin flip was accurate. A much better measure of prediction
quality is whether they predicted “heads”. Similarly, sports outcomes are extremely
noisy—across the 724 games in our data, the likely winner won only 57.7% of the time—
and so it would take many thousands of predictions about hundreds of games to detect
whether one condition makes more accurate predictions than another.13 In this case, a
better measure of prediction quality is whether people predicted the teams that were most
likely to win as opposed to the teams that actually won.14
Additional Measures
Winning Team Probabilities. In experiments 7, 9, 11, and 14-19, immediately after
predicting the outcomes of all games, participants indicated how likely each team would
be to win the game. Specifically, we asked participants to revisit each game and imagine
that the two teams played that exact same game 100 times, meaning that each of those
100 games would have the same time, location, players, injuries, etc. as the actual game
(see Appendix A2 for the exact wording of these instructions). Participants then reported
13 In fact, across all 724 games in our dataset, we find no significant effects of predicting scores on winning
team prediction accuracy. Thus, although we replicate Yoon et al.’s (2013) main result using a good measure of prediction quality, we do not replicate their result using the measure of prediction quality that they used.
how many games out of 100 they thought each team would win, and we converted these
responses into probabilities of each team winning the actual game. These self-reported
probabilities did not end up providing consistent evidence of participants’ prediction
processes, so we report their results in Appendix A2.
Reliance on Global vs. Local Information. In Experiments 1-16, we also collected
Yoon and colleagues’ (2013) measures of self-reported reliance on “global” and “local”
information for making predictions, where “global information” refers to holistic, overall
impressions of the teams, and “local information” refers to more nuanced information
about specific aspects of the teams (e.g., their offensive capabilities). After participants
made their predictions, we asked participants to “Please indicate the degree to which you
considered each of these factors while making your predictions” and had them rate how
much they considered three global factors (“overall impression of the two teams”,
“overall performance of the two teams in the past years”, “overall performance of the two
teams in recent years”) and three local factors (“the teams’ offensive abilities”, “the
teams’ defensive abilities”, “the teams’ coaching abilities”) on a scale from 1 (“not
considered at all”) to 7 (“seriously considered”). For experiments examining predictions
about baseball games, we included an additional local factor (“the teams’ pitching
abilities”) that was not included in, nor relevant for, Yoon et al.’s (2013) investigation of
soccer matches. All global and local considerations were presented in randomized order.
Following Yoon et al. (2013), we averaged participants’ ratings of the three global factors
into a single measure of “global considerations” (α = .68) and the four local factors into a
single measure of “local considerations” (α = .85) so we could attempt to replicate their