www.nat-hazards-earth-syst-sci.net/8/369/2008/ © Author(s) 2008. This work is licensed under a Creative Commons License.
and Earth
System Sciences
Automatic estimation of optimal autoregressive filters for the
analysis of volcanic seismic activity
P. Lesage
Laboratoire de G´eophysique Interne et Tectonophysique, CNRS, IRD: R157, Universit´e de Savoie, 73376 Le Bourget-du-Lac Cedex, France
Instituto de Geof´ısica, Universidad Nacional Aut´onoma de M´exico, Mexico, D.F., Mexico
Received: 23 October 2007 – Revised: 10 March 2008 – Accepted: 10 March 2008 – Published: 24 April 2008
Abstract. Long-period (LP) events observed on volcanoes provide important information for volcano monitoring and for studying the physical processes in magmatic and hy-drothermal systems. Of all the methods used to analyse this kind of seismicity, autoregressive (AR) modelling is particu-larly valuable, as it produces precise estimations of the fre-quencies and quality factors of the spectral peaks that are generated by resonance effects at seismic sources and, via deconvolution of the observed record, it allows the excitation function of the resonator to be determined. However, with AR modelling methods it is difficult to determine the order of the AR filter that will yield the best model of the signal. This note presents an algorithm to overcome this problem, together with some examples of applications. The approach described uses the kurtosis (fourth order cumulant) of the de-convolved signal to provide an objective criterion for select-ing the filter order. This approach allows the partial automa-tion of the AR analysis and thus provides interesting possi-bilities for improving volcano monitoring methods.
1 Introduction
The seismic signals recorded on volcanoes contain invalu-able information about the state and evolution of magmatic and hydrothermal systems and about the complex physical processes involved in volcanic activity. Observations and analyses of volcano seismic activity provide many basic tools for volcano monitoring and eruption prediction (Chouet, 1996a). This seismic activity is characterized by a large vari-ety of source processes and seismic signal features (Mc Nutt, 1996). Volcano-seismic events are usually classified into the following main types:
Correspondence to: P. Lesage ([email protected])
– Volcano-tectonic (VT) events display clear P- and S-wave arrivals and relatively high frequency spectral contents. They are related to brittle fractures in the solid volcanic structure caused by magmatic intrusion or gravity instabilities.
– Long-period (LP) events, also named “low-frequency” events, are characterized by more or less emergent first arrivals, a lack of clear S waves, and spectral energies that are usually concentrated at frequencies of less than 5 Hz and, in many cases, in sharp spectral peaks. – Volcanic tremors consist of long-duration oscillations,
whose energies are also concentrated at low frequencies and, in many cases, in sharp spectral peaks.
The sources of LP events and volcanic tremors are related to the presence of fluids (magma, water, vapour, gas or multi-phase mixtures) that fill cavities in the structure (magmatic conduit or chamber, dikes, sills, etc.). When a cavity is ex-cited by pressure perturbations, the elastic waves generated are trapped because of the impedance contrast between the solid rock and the fluid. These waves are probably interface waves that are partially reflected at the ends of the finite-size cavity. Thus, the sharp spectral peaks of LP events and vol-canic tremors may be caused by two different phenomena. In some cases they may result from a repetitive process that produces regularly spaced spectral peaks by the Dirac comb effect (Schlindwein et al., 1995; Jousset et al., 2003; Stur-ton and Neuberg, 2006; Lesage et al., 2006). In other cases they may be associated with the normal modes of a resonator (Chouet, 1996b; Kumagai and Chouet, 2000). In addition to these three types of event, seismic signals can also be pro-duced by other processes, such as rockfalls, collapses, pyro-clastic flows, explosions and deep mass transfers (Mc Nutt, 1986; Chouet et al., 1999; Ohminato et al., 1998).
of specific methods that includes spectral and autoregressive analysis, amplitude measurement, dynamical and stochastic approaches and noise analysis (Seidl et al., 1990; Nakano et al., 1998; Lesage et al., 2002; Endo and Murray, 1991; Carniel et al., 2003; Jaquet and Carniel, 2001; Vila et al., 2006; Brenguier et al., 2008). Autoregressive (AR) mod-elling is one of the most interesting methods for extracting information from LP event records (Nakano et al., 1998, Lesage et al., 2002). It is particularly well-suited to ana-lyzing signals generated by resonance processes, as it mod-els them as the output of an AR filter, also called an Infinite Impulse Response (IIR) filter, which can be considered a res-onator. This type of method (Levinson, Yule-Walker, Max-imum Entropy, Sompi) produces precise estimations of the frequencies of the main spectral peaks, together with their corresponding quality factors. The latter parameter can give important information about the type of fluid filling the res-onating cavity (Kumagai and Chouet, 2000). Moreover, tem-poral changes in the frequencies and quality factors of spec-tral peaks may reflect physical modifications in a magmatic or hydrothermal system (Kumagai et al., 2002). The detec-tion of these variadetec-tions may be a useful tool for volcano mon-itoring. Once AR modelling has been carried out for a given LP event, the record can be filtered using the corresponding inverse filter, in order to produce an estimation of the ex-citation function of the resonator; a function that is related to the physical processes occurring at the source (Nakano et al., 1998; Lesage et al., 2002). This function can be in-verted to obtain detailed information about the mechanism involved (Nakano et al., 2003). A major difficulty in apply-ing AR methods is to select the order of the filter. The num-ber of poles must be at least twice the numnum-ber of spectral peaks, plus some poles to take into account the noise; how-ever, there are no reliable general criteria for determining the optimal order (Adnet, 1990). One way of overcoming this difficulty is to calculate all the filters in a reasonable range of order, and then plot the poles of all the filters in the com-plex frequency plane (Kumagai and Chouet, 2000). Points representing real and stable poles merge in dense clusters, while scattered points in the plane are due to noise and non-resonating phenomena. In this procedure, the main clusters of points are manually selected and the mean values of their frequencies and quality factors are calculated, together with their standard deviations. However, in order to increase the use of this promising method and include it in volcano mon-itoring systems, algorithms for the easy estimation of AR fil-ter order must be developed and the method must be at least partially automated.
The present paper describes a method for determining the optimal order of the AR filter based on High Order Statistics (Donoho, 1981; Lacoume et al., 1997). The resulting algo-rithm can be used to automatically calculate the frequencies and quality factors of the resonating modes and to decon-volve the LP records from their oscillating parts, in order to facilitate estimation of the excitation function. A brief review
of the principle of AR analysis is followed by a description of the algorithm, the application of which is illustrated with reference to two volcanic LP events.
2 Method
When using AR modelling, the choice of the number of poles and zeros of the filter is crucial. Although estimates of the frequency of the dominant spectral peaks are not highly de-pendent on this choice, the corresponding quality factors can be strongly modified by varying the filter order. Hence, it is necessary to pay special attention to the determination of these orders by carrying out numerical tests, or by using the averaging procedure described in the introduction. As a re-sult, AR modelling is time-consuming and difficult to apply to large sets of events. The present article proposes an al-gorithm for selecting the optimal order, thereby allowing the partial automation of the analysis.
If the sharp spectral peaks of LP events are interpreted as being due to the resonance of a fluid-filled cavity, the cor-responding oscillations can be represented as decaying com-plex exponential functions. These functions are solutions of second-order linear differential equations. Due to the equiv-alence between linear differential equations and linear dif-ference equations, autoregressive methods are well suited to the analysis of this kind of signal. In this approach, a signal is considered as the output of an AR or an ARMA (autore-gressive moving-average) filter excited by Dirac impulses or white noise.
The output of an ARMA filter can be written as:
xn= p
X
k=1
akxn−k− q
X
k=1
bkyn−k (1)
wherexn andyn are samples of the output x and input y time series, respectively, p andq are the orders of the AR and MA parts of the filter, respectively, andakandbkare the coefficients of the AR and MA parts of the filter, respectively. If Eq. (1) is multiplied by the complex conjugatedxn∗−mand the expectation is taken, then the result is:
E(xnxn∗−m)= p
X
k=1
akE(xn−kxn∗−m)− q
X
k=1
bkE(yn−kxn∗−m). (2)
Thus: rxx[m] =
p
X
k=1
akrxx[m−k] − q
X
k=1
bkryx[m−k] (3)
0 1 2 3 4 5 6 7 8 9 10 −100
0 100
Time (s)
Velocity (a.u.)
a
Kelut volcano
0 1 2 3 4 5 6 7 8 9 10
−80 −60 −40
−200
20 40
Time (s)
Velocity (a.u.)
b
0 2 4 6 8 10 12
0 0.5 1
Frequency (Hz)
Normalized amplitude
c
0 2 4 6 8 10 12
−0.5 −0.4 −0.3 −0.2 −0.1 0
Frequency (Hz)
g (s
−1
)
Q=1
5 10
15 20
30 50 100
d
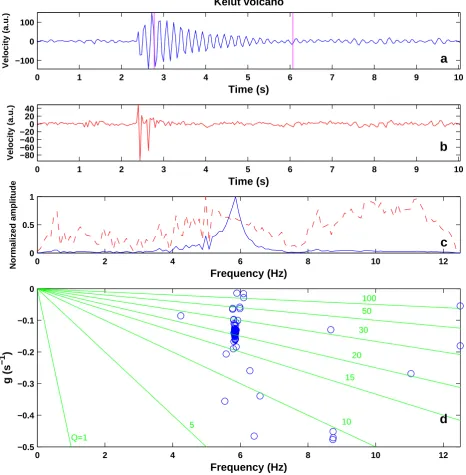
Fig. 1. Analysis of the LP event on Kelut volcano. (a) Velocity seismogram (arbitrary unit); the vertical lines indicate the section analyzed; (b) Signal obtained after deconvolution (arbitrary unit); (c) Normalized spectra of the original signal (continuous line) and of the deconvolved
signal (dashed line); (d) Representation in the complex frequency plane (f, g)of the poles of all the tentative filters, estimated by varying the numbers of poles and zeros. Some iso-value lines ofQare also plotted.
the coefficientsbkof the MA filter cannot be calculated from Eq. 3. In this case, the matrix relation yields the modified Yule-Walker equation, which does not take into account the firstq samples of the autocorrelation of the signal. This re-duces the influence of noise, as the auto-correlation of white noise is a Dirac impulse located at zero lag. The coefficients of the AR filter are obtained by solving the modified
Number of poles
Number of zeros
Kurtosis
5 10 15
0 1 2 3 4 5 6
0 10 20 30 40 50 60
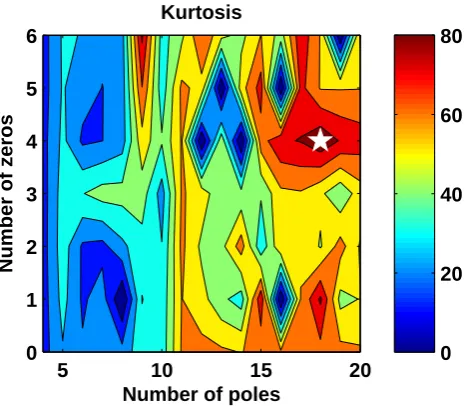
Fig. 2. Kurtosis of the deconvolved signal of the LP event on Kelut
volcano as a function of the numbers of poles and zeros. The white star indicates the position of the maximum value.
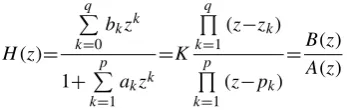
The filters obtained from the autocorrelation are minimum phase. Their coefficients are directly related to the character-istics of the resonator. Physical resonators can be considered minimum phase AR filters that are linear, stationary, causal and causally invertible. AR modelling is thus suitable for an-alyzing signals generated by physical resonators. Once the filter coefficients have been estimated, the z-transform of the corresponding impulse response can be written:
H (z)=
q
P
k=0 bkzk
1+
p
P
k=1 akzk
=K
q
Q
k=1 (z−zk)
p
Q
k=1 (z−pk)
=B(z)
A(z) (4)
wherezis a complex number, usually written asz=e−2iπf 1t, where1t is the sampling interval, andf is the frequency. The termszk andpk are, respectively, the zeroes and poles of the ARMA filterH (z). B(z)and 1/A(z)represent the MA and AR parts ofH (z), respectively. The orderspandq are also the numbers of poles and zeros of the filter, respec-tively. Every sharp spectral peak is associated with a pair of conjugated poles. The corresponding frequencyf and qual-ity factorQcan be calculated from the values of the poles or from the associated coefficientsak (Lesage et al., 2002). Finally, each pair of poles can be represented by a point in the complex frequency plane (f, g), whereg is the growth rate, defined asg= − f
2Q. When the signal is filtered by the inverse of the AR filter, its oscillatory content is eliminated and the corresponding excitation function – the input of the filter – can be obtained (Lesage et al., 2002). This operation corresponds to signal deconvolution by the inverse AR filter.
The method proposed to estimate the optimal orders of the filter is based on the use of High Order Statistics (HOS), specifically the fourth order cumulant, known as “kurtosis”. The kurtosis of a random variablexis defined as:
κx(4)=Kur(x)= E[x4]
E[x2]2−3 (5)
whereE[x]is the expectation ofx. An important property of a Gaussian signal is that it is completely described by or-der 2 statistics. Thus all its cumulants of oror-der greater than 2, including the kurtosis, are null. The signal produced by filtering a white noise is closer to a Gaussian signal than the non-filtered signal. Therefore, the kurtosis of the output of a filter is always smaller than that of the input (Lacoume et al., 1997). Conversely, the kurtosis of a signal deconvolved by the corresponding inverse AR filter is greater than that of the original signal. Hence, the algorithm is based on the maximization of the kurtosis of the deconvolved signal. The procedure is as follows:
1. Select the signal window to analyze (generally the coda of the event) and multiply it by a Ripley taper in order to reduce the edge effect that perturbs the kurtosis cal-culation.
2. Define the minimum and maximum values of the orders pandqof the filters to evaluate.
3. Calculate all the filters with their numbers of poles and zeros varying within the previously defined ranges. 4. Successively deconvolve the signal by all the
corre-sponding inverse filters and calculate the kurtosis of the resulting signals.
5. Look for the maximal value of the kurtosis obtained and select the corresponding filter.
3 Examples
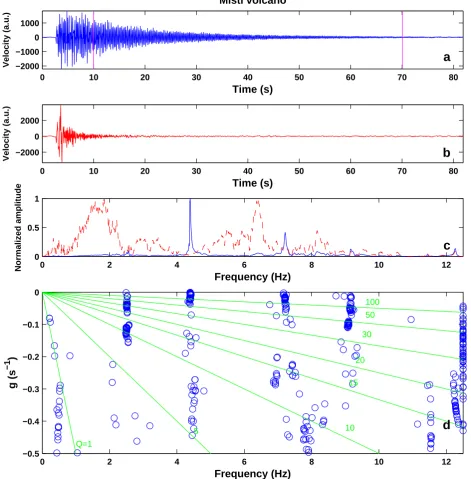
0 10 20 30 40 50 60 70 80 −2000
−1000 0 1000
Time (s)
Velocity (a.u.)
a
Misti volcano
0 10 20 30 40 50 60 70 80
−2000 0 2000
Time (s)
Velocity (a.u.)
b
0 2 4 6 8 10 12
0 0.5 1
Frequency (Hz)
Normalized amplitude
c
0 2 4 6 8 10 12
−0.5 −0.4 −0.3 −0.2 −0.1 0
Frequency (Hz)
g (s
−1
)
Q=1
5 10
15 20
30 50 100
d
Fig. 3. Same as Fig. 1 for the LP event on Misti volcano.
function ofpandq. A region of high value (>50) of kur-tosis is observed for 7≤p≤10 and 2≤q≤4, with a maximum of 60 for p=10 andq=3. The kurtosis of the non-filtered signal is 7.3. Thus, the AR filter that yields the best mod-elling and deconvolution of this record is of relatively low order. This is consistent with the monochromatic nature of the spectrum. The main pole is characterized by a frequency f=5.85 Hz and a quality factorQ=20.7, which is in agree-ment with the results of the “manual” estimation carried out by Lesage et al. (2002). Figure 1b and c show the
Number of poles
Number of zeros
Kurtosis
5 10 15 20
0 1 2 3 4 5 6
0 20 40 60 80
Fig. 4. Same as Fig. 2 for the LP event on Misti volcano.
the crater (Lesage and Surono, 1995; Vandemeulebrouck et al., 2000).
The second example is an LP event recorded on 7 April 1998 by a short-period station at the summit of Misti volcano, Peru (M´etaxian, personal communication). In this case, the analysis window is from 10 to 70 s (Fig. 3a), and the numbers of poles and zeros vary in the ranges [4–20] and [0–6], respectively. The spectrum is dominated by a peak at 4.4 Hz but other sharp peaks are present. The plot of kurtosis as a function of the number of polespand zerosq(Fig. 4) is more complex than in the Kelut LP event. However, a clear maximum with a kurtosis of 88 is observed for p=18 and q=4, while the kurtosis of the original signal is 8.2. The de-convolved signal obtained using the corresponding filter has a very short duration, compared with the observed seismo-gram (Fig. 3b). It includes a relatively low frequency oscilla-tion at its onset, which corresponds to the wide spectral peak at 1–2 Hz (Fig. 3c). The large number of poles of the op-timal filter determined using the kurtosis is consistent with the number of clusters of poles in the complex frequency plane (Fig. 3d). For the main spectral peak, the estimated fre-quency value isf=4.39 Hz and the estimated quality factor isQ=276, which is in agreement with the results of Lesage et al. (2002). Again, assuming that the source of the event is a fluid-filled crack, the high value ofQindicates that the fluid may be a dusty gas (Kumagai and Chouet, 2000).
4 Discussion and conclusion
AR modelling is particularly appropriate for studying LP events and volcanic tremors when the source can be repre-sented by an oscillator. In such cases it is a very useful method for extracting information about the physical state
of the volcanic system and the processes occurring within it. However, LP activity often occurs in swarms that in-clude large numbers of events. The systematic analysis of large sets of events requires efficient algorithms that allow partial automation of the analysis procedure. The kurtosis-based method described in the present article may meet this need. Furthermore, kurtosis provides an objective way of se-lecting the filter order. Although this method generally pro-duces reasonable solutions, some difficulties remain. Firstly, the result may depend on the choice of the analysis window, which must include the decaying part of the seismogram and should exclude the part that contains the excitation function. Secondly, when the parameterspandqvary, the kurtosis of the deconvolved signal may show several maxima. It is thus useful to plot this function in order to check for possible sec-ondary maxima and to verify that the defined range of vari-ation ofpandqis adequate. A semi-automatic and interac-tive program is useful both for selecting the analysis window and for checking the kurtosis. For this purpose, the method has been incorporated into the “Seismo volcanalysis” soft-ware package – an open-source MATLAB program that in-cludes several user-friendly interfaces for analysing volcanic seismic signals. This software is freely available upon re-quest to the author (go to: http://www.lgit.univ-savoie.fr/ EquipeVolcan/Seismo volcanalysis.pdf).
The algorithm used here is derived from the Yule-Walker method in which the first q samples (where q is the num-ber of zeros) of the autocorrelation of the signal are dis-carded. This is useful to reduce the effect of the noise, as the white noise autocorrelation is a centred Dirac impulse (Marple, 1987). However, the coefficients of the MA part of the ARMA filter are not explicitly evaluated. Some pro-cedures, such as the Durbin method, are designed to esti-mate the MA coefficients and can be used to deconvolve the MA part of the signal (Richard and Lesage, 2001). How-ever, they are not easy to use, as numerical instabilities may appear in this process and because the computation time is much longer. Furthermore, the physical significance of the MA part of the filter is generally not clear.
Acknowledgements. The present work was carried out during
a secondment to the Institute of Geophysics at UNAM, which was funded by the Institut de Recherche pour le D´eveloppement. This work was partly supported by the European Commission, 6th Framework Project “VOLUME”, Contract No. 08471. I am grateful to F. Glangeaud and J. Mars of Grenoble’s Joseph Fourier University for introducing me to new fields of signal processing. I would like to thank J. P. M´etaxian, R. Carniel, and P. Jousset for their constructive comments.
Edited by: Joan Marti
Reviewed by: R. Carniel and P. Jousset
References
Adnet, C.: Unification des m´ethodes d’analyse spectrale (Fourier et haute r´esolution) en vue de la r´ealisation d’un syst`eme expert d’aide `a l’analyse. Ph.D. Thesis, INPG, Grenoble, France, 1990. Brenguier, F., Shapiro, N. M., Campillo, M. et al.: Towards fore-casting volcanic eruptions using seismic noise, Nature Geo-science, 1, 126–130, doi:10.1038/ngeo104, 2008.
Carniel, R., Di Cecca, M. and Rouland, D.: Ambrym, Vanuatu (July–August 2000): spectral and dynamical transitions on the hours-to-days timescale. J. Volcanol, Geotherm. Res., 128, 1–13, doi:10.1016/S0377-0273(03)00243-9, 2003.
Chouet, B.: Dynamics of a fluid-driven crack in three dimensions by the finite difference method, J. Geophys. Res., 91(B14), 13 967– 13 992, 1986.
Chouet, B.: A seismic model for the source of long-period events and harmonic tremor, in: Volcanic seismology, edited by: P. Gas-parini, R. Scarpa, and K. Aki, Berlin, 133–156, 1992.
Chouet, B.: Long-period volcano seismicity: its source and use in eruption forecasting, Nature, 380, 309–316, 1996a.
Chouet, B.: New methods and future trends in seismological vol-cano monitoring, In: Monitoring and mitigation of volvol-cano haz-ards, edited by: R. Scarpa and R. I. Tilling, 23–97, 1996b. Chouet, B., Sacorrotti, G., Dawson, P., Martini, M., Scarpa, R.,
De Luca, G., Milana, G. and Cattaneo, M.: Broadband mea-surements of sources of explosions at Stromboli volcano, Italy. Geophys. Res. Lett., 26(13), 1937–1940, 1999.
Donoho, D.: On minimum entropy deconvolution, Applied time-series analysis II, Academic Press, 565–609, 1981.
Endo, E.T . and Murray, T.: Real-time seismic amplitude measure-ment (RSAM): a volcano monitoring and prediction tool, Bull. Volcanol., 53, 533–545, 1991.
Fukao, Y. and Suda, N.: Core modes of the Earth’s free oscillations and structure of the inner core, Geophys. Res. Lett., 16, 401–404, 1989.
Hori, S., Fukao, Y., Kumazawa, M., Furumoto, M. and Yamamoto, A.: A new method of spectral analysis and its application to the Earth’s free oscillations: The “Sompi” method, J. Geophys. Res., 94(B6), 7535–7553, 1989.
Jaquet, O. and Carniel, R.: Stochastic modelling at Stromboli: a volcano with remarkable memory. J. Volcanol. Geotherm. Res., 105, 249–262, 2001.
Jousset, P., Neuberg, J., and Sturton, S.: Modelling the time-frequency content of low-time-frequency volcanic earthquakes, J. Vol-canol. Geotherm. Res., 128, 201–223, 2003.
Kay, S. M.: Modern spectral estimation, theory and application, Academic Press, 1981.
Kumagai, H. and Chouet, B. A.: Acoustic properties of a crack containing magmatic or hydrothermal fluids, J. Geophys; Res., 105(B11), 25 493–25 512, 2000.
Kumagai, H., Chouet, B. A., and Nakano, M.: Temporal evolution of a hydrothermal system in Kusatsu-Shirane Volcano, Japan, in-ferred from complex frequencies of long-period events, J. Geo-phys. Res., 107(B10), 2236, doi:10.1029/2001JB000653, 2002. Kumazawa, M., Imanishi, Y., Fukao, Y., Furumoto, M., and
Ya-mamoto, A. A.: Theory of spectral analysis based on the charac-teristic property of a linear system, Geophys. J. Int., 101, 613– 630, 1990.
Lacoume, J.-L., Amblard, P.-O., and Comon, P.: Statistiques d’ordre sup´erieur pour le traitement du signal, Masson, Paris, 1997.
Lesage, P. and Surono: Seismic precursors of the 10 February 1990 eruption of Kelut volcano, Java. J. Volcanol. Geotherm. Res., 65, 135–146, 1995.
Lesage, P., Glangeaud, F. and Mars, J.: Applications of autoregres-sive and time-frequency analysis to the study of volcanic tremor and LP events, J. Volcanol. Geotherm. Res., 114, 391–417, 2002. Lesage, P., Mora, M., Alvarado, G., Pacheco, J. F., and M´etaxian, J.-P.: Complex behavior and source model of the volcanic tremor at Arenal volcano, Costa Rica, J. Volcanol. Geotherm. Res., 157, 49–59, 2006.
Marple, S. L.: Digital spectral analysis with applications, Prentice Hall, Englewood Cliffs, 1987.
Mars, J., Lacoume, J.-L., Mari, J.-L., and Glangeaud, F.: Traitement du signal pour g´eologues et g´eophysiciens – Vol. 3, Techniques avanc´ees, Technip, 2004.
McNutt, S.: Observations and analysis of B-type earthquakes, ex-plosions, and volcanic tremor at Pavlof volcano, Alaska. Bull. Seis. Soc. Am., 76, 153–175, 1986.
McNutt, S. R.: Seismic monitoring and eruption forecasting of vol-canoes: A review of the State-of-the-Art and case histories, in: Monitoring and mitigation of volcano hazards, edited by: R. Scarpa and R.I. Tilling, Springer-Verlag, Berlin, 99–146, 1996. Nakano, M., Kumagai, H., Kumazawa, M., Yamaoka, K., and
Chouet, B.: The excitation and characteristic frequency of the long-period volcanic event: an approach based on an inhomoge-neous autoregressive model of a linear dynamic system, J. Geo-phys. Res., 103, 10 031–10 046, 1998.
Nakano, M., Kumagai, H., and Chouet, B.: Source mechanism of long-period events at Kusatsu-Shirane volcano, Japan, inferred from waveform inversion of the effective excitation functions, J. Volcanol. Geotherm. Res., 122, 139–164, 2003.
Ohminato, T., Chouet, B. A., Dawson, P., and Kedar, S.: Waveform inversion of very long period impulsive signals associated with magmatic injection beneath Kilauea volcano, Hawaii, J. Geo-phys. Res., 103(B10), 23 839–23 862, 1998.
Richard, G. and Lesage, P.: Autoregressive models of resonators for volcanic tremors using Kurtosis, Phys. Signal Image Processing, Marseille, France, 2001.
Schlindwein, V., Wassermann, J., and Scherbaum, F.: Spectral anal-ysis of harmonic tremor signals at Mt. Semeru volcano, Indone-sia, Geophys. Res. Lett., 22, 1685–1688, 1995.
Merapi (central Java), Bull. Volcanol., 52, 460–474, 1990. Sturton, S. and Neuberg, J.: The effects of conduit length and
acoustic velocity on conduit resonance: implications for low-frequency events, J. Volcanol. Geotherm. Res., 128, 187–199, 2006.
Vandemeulebrouck, J., Sabroux, J.-C., Halbwachs, M., Surono, Poussielgue, N., Grangeon, J., and Tabbagh, J.: Hydroacoustic noise precursors of the 1990 eruption of Kelut volcano, Indone-sia, J. Volcanol. Geotherm. Res., 97, 443–456, 2000.