www.nat-hazards-earth-syst-sci.net/12/151/2012/ doi:10.5194/nhess-12-151-2012
© Author(s) 2012. CC Attribution 3.0 License.
and Earth
System Sciences
Tsunami risk assessments in Messina, Sicily – Italy
A. Grezio1, P. Gasparini2,3, W. Marzocchi4, A. Patera4, and S. Tinti5
1Istituto Nazionale di Geofisica e Vulcanologia, Via Creti 12, 40128 Bologna, Italy 2AMRA Scarl, Via Nuova Agnano 12, 80012 Naples, Italy
3Dipartimento di Scienze Fisiche, Universit`a di Napoli, “Federico II”, Naples, Italy
4Istituto Nazionale di Geofisica e Vulcanologia, Via di Vigna Murata 605, 00143 Rome, Italy 5Dipartimento di Fisica, Settore di Geofisica, Universit`a di Bologna, Bologna, Italy
Correspondence to: A. Grezio (grezio@bo.ingv.it)
Received: 14 April 2011 – Revised: 9 September 2011 – Accepted: 4 December 2011 – Published: 17 January 2012
Abstract. We present a first detailed tsunami risk assessment for the city of Messina where one of the most destructive tsunami inundations of the last centuries occurred in 1908. In the tsunami hazard evaluation, probabilities are calculated through a new general modular Bayesian tool for Probabil-ity Tsunami Hazard Assessment. The estimation of losses of persons and buildings takes into account data collected directly or supplied by: (i) the Italian National Institute of Statistics that provides information on the population, on buildings and on many relevant social aspects; (ii) the Italian National Territory Agency that provides updated economic values of the buildings on the basis of their typology (res-idential, commercial, industrial) and location (streets); and (iii) the Train and Port Authorities. For human beings, a fac-tor of time exposition is introduced and calculated in terms of hours per day in different places (private and public) and in terms of seasons, considering that some factors like the number of tourists can vary by one order of magnitude from January to August. Since the tsunami risk is a function of the run-up levels along the coast, a variable tsunami risk zone is defined as the area along the Messina coast where tsunami inundations may occur.
1 Introduction
The 28 December 1908 Messina earthquake was one of the most destructive events in Italy and was associated with one of the largest tsunami inundations in recent history. About 60 000 people died because of the earthquake and about 1500 were killed by the tsunami. The cities of Messina and Reggio-Calabria were damaged extensively. The tsunami run-up was 3 m in the Messina harbour and as high as 13 m in the village of Pellaro, and the tsunami waves entered 200 m
inland in several locations along the coast of the Messina Straits (Tinti et al., 1999). For the first time, a Tsunami Risk (TR) assessment for the city of Messina is presented, where the TR is evaluated considering the tsunami hazard, the vulnerability of the exposed elements and the value of such elements. Generally, TR assessment uses hazards pro-vided by the worst expected scenarios based on historical data and/or on few simulations (Papadopoulos and Derment-zopoulos, 1998; Sato et al., 2003; Kulikov et al., 2005). Grezio et al. (2010a) point out the need of an extensive set of potential tsunamigenic sources with the appropriate eval-uation of the aleatoric and epistemic uncertainties in order to consider a more comprehensive Probabilistic Tsunami Haz-ard Assessment (PTHA). As regHaz-ards the estimation of dam-ages, it is extremely difficult to establish levels of vulnera-bility of people and communities, because of the multiplicity of individual and social aspects (Dweyr et al., 2004). Recent studies have demonstrated that the vulnerability is a dynamic variable and depends on a number of parameters. As a conse-quence, buildings and spaces are not uniformly at risk within a potential inundation zone (Papatoma et al., 2003a, b). It is clear that time and spatial variability, involving multiple factors, make the TR assessment a complicated issue.
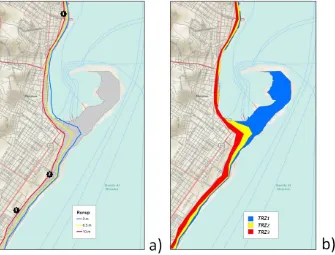
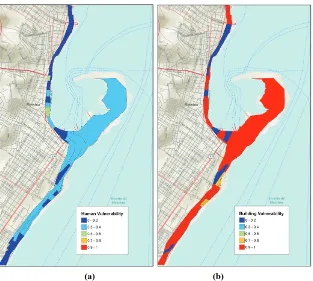
Fig. 1. Messina ISTAT sections on ArcGIS map: (a) the run-up isolines in Messina city (star symbols indicate the location of the correspond-ing number of buildcorrespond-ings with 4 or more floors) and (b) the Tsunami Risk Zones TRZi(i=1,2,3). The gray lines are the ISTAT section and the dark gray area in (a) (limited by 0.5 m and 10 m runup) is relative to the 54 sections of the TRZ.
2 Tsunami risk assessment methodology
The TR is based on the general definition of risk by Fournier D’Albe (1979):
Risk=(Hazard)×(Exposed Elements)×(Vulnerability)(1) where Hazard is the probability of any particular area be-ing affected by a calamitous event within a given period of time; Exposed Elements is a generic term indicating the num-ber of human lives at stake and/or the economic value of lands, buildings, infrastructures, or other productive facilities (factories, power plants, agricultural lands, tourist activities) which are exposed to that event; Vulnerability is the propor-tion of the exposed elements (in terms of human lives and/or economic values) which is likely to be lost in that event, and is therefore a number comprised between 0 and 1.
Here, we present TR assessment evaluated separately for Humans TR and Buildings TR. They are functions of the run-up levels along the coast, so that we define a Tsunami Risk Zone (TRZ) as the area along the Messina coast where a tsunami inundation may occur. In the present case, we fo-cus on three TRZi (i=1,2,3), considering the 0.5–3 m, 3– 6.5 m, and 6.5–10 m run-up level intervals. The lowest limit 0.5 m and is the one set by the PTHA analysis (Grezio et al., 2010a); the 3 m value is the run-up level of the 1908 tsunami event in Messina; the 6.5 m value is arbitrarily chosen and the upper limit 10 m is an extrapolation case. TRZ1 is the area limited by the run-up levels 0.5–3 m and is a strip about
35 m wide, on average with a total area of about 5.3×10⁵m2 including the peninsula of the port of Messina. TRZ2is lim-ited by the run-up levels 3–6.5 m and is a strip about 50 m wide with total area of about 2.3×10⁵m2. TRZ3is limited by the run-up levels 6.5–10 m and is a strip about 60 m wide with total area of about 3.7×10⁵m2.
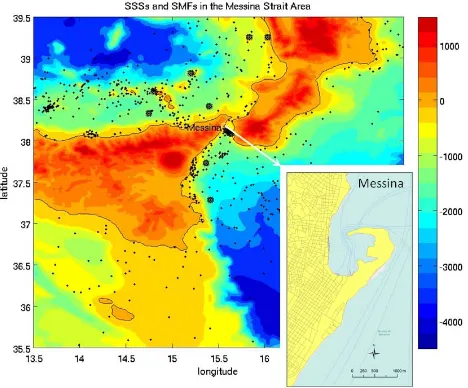
Fig. 2. The Messina Strait Area. Submarine Seismic Sources (SSSs) are the black dots and Submarine Mass Fail-ures (SMFs) are the black stars. The map of the city of Messina with the all ISTAT sections is shown in the lower box.
2.1 Probabilistic Tsunami Hazard Assessment (PTHA) In the present study, the tsunami hazard is computed from an extensive set of potential tsunamigenic sources with the relative aleatoric and epistemic uncertainties formally incor-porated. Note that this approach is different from other pro-cedures that consider only few seismic sources and scenarios. According to the Bayesian PTHA (Grezio et al., 2010a) and the relative application to the Messina Strait Area (Grezio et al., 2010b), the hazard is calculated as the annual probabil-ity that a tsunami run-upZ overcomes a selected threshold zt at the Messina coast. The procedure uses all informa-tion available for Messina: regional seismotectonics back-ground, empirical models, recent instrumental data, histori-cal catalogues. In this TR assessment, the Submarine Seis-mic Sources (SSSs) and Submarine Mass Failures (SMFs) are considered as the predominant tsunamigenic sources.
SSSs are localized on active faults around the Sicily re-gion at depths smaller than 15 km within the shallow part of the crust. The epicenters are extracted from the instrumen-tal Cainstrumen-talogue of the Iinstrumen-talian Seismicity that contains earth-quakes with a completeness magnitude of 2.5 (Castello et al., 2007). Figure 2 shows the SSSs locations recorded from 1981 to 2002 in the northern and eastern Sicily, that is called the Messina Strait Area. Since all instrumental magnitudes in such a short time span happened to be below the thresh-old to trigger a tsunami, virtual magnitudes in the range [5.5–7.5] Mw are associated with the catalogue locations. Specifically, we assume first that large earthquakes have the same spatial distribution of the smaller ones and second that they follow a Gutenberg-Richter frequency-magnitude relationship (Gutenberg and Richter, 1944). Note that the
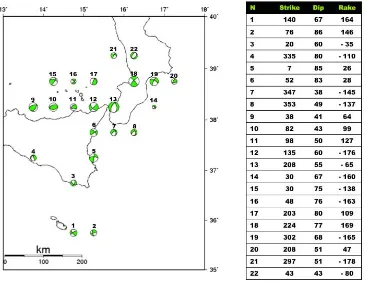
introduction of those magnitudes is necessary in order to make the SSSs potentially tsunamigenic. Other fault param-eters (width, length and slip) related to these SSSs magni-tudes are calculated using the empirical relationships pro-vided by Wells and Coppersmith (1994). Source depths are randomly distributed in the upper 15 km of the crust. Focal mechanisms are selected according to the Earthquake Mech-anisms of the Mediterranean Area database (Vannucci and Gasperini, 2004) and following the Harvard Central Moment Tensors procedures in the Mediterranean region (Pondrelli et al., 2004) (Fig. 3). Strike, dip and rake angles are selected taking into account the regional seismotectonics consistently with the background studies and are listed in Fig. 3. Sea floor deformations induced by the SSSs are calculated via the Okada (1992) analytical formulas in order to compute the initial tsunami sea surface heights.
SMFs are associated to areas with propensity to failure that are specified considering the bathymetry slopes and the mass centre depths in the Messina Strait Area (Fig. 2). SMFs vol-umes span from 5×10⁵to 5×10¹⁰m3on the basis of re-gional and historical SMF sizes measured in the Tyrrhenian and Ionian basins. Other geometric parameters are calcu-lated using the rigid body approximations following Grilli and Watts (2005) and Watts et al. (2005). In analogy with the sub-aerial mass failures, the frequency distribution of the SMFs is assumed to be a power-law distribution and poste-rior spatial conditional probabilities are introduced consider-ing past SMF scars that represent instability areas. The ini-tial tsunami sea surface amplitudes are computed following Grilli and Watts (2005) and Watts et al. (2005), who stated that it is reasonable to use the sea surface amplitudes for-mulas as first approximation in the tsunami hazard along any given slope. Finally, the surface elevations of the ini-tial tsunami waves are approximated using the surface am-plitudes (in the near field and away from the splash zone).
Fig. 3. Moment Tensors and correspondent Strike, Dip and Rake angles in the Messina Strait Area listed in the relative Table.
we computed an extensive set of run-upsZ using the conti-nental slope angle of an average slope computed in a reason-able area in front of Messina city.
The run-upsZ > ztat the Messina coast computed by Syn-olakis’ law are used to set the Beta distribution with param-etersαandβin the prior probability distributionfprior(θ )of the Bayesian PTHA (Grezio et al., 2010a):
fprior(θ )=Beta(α,β)=
1 B(α,β)θ
α−1
(1−θ )β−1, 0< θ <1 (2) where
B(α,β)=
1
Z
0
xα−1(1−x)β−1dx,α >0,β >0 (3)
is the Beta function. Theαandβ parameters are univocally determined in practical tsunami applications by the expected value E and the varianceV. The value E is set equal to the weighted percentage of times in whichZ > zt i in a sta-tistically relevant number of computed run-ups from theN different simulated tsunamigenic sources. In the present ap-plication zt i assumes the different run-up thresholds zt1= 0.5 m,zt2=3 m,zt3=6.5 m, andzt4=10 m. So that:
E(θ )=
N
X
j=1
pjH (Zj> zti) i=1,...4. (4)
H (Zi−0.5 m) is the Heaviside step function that is 1 when the simulated run-up Zi from the simulated i-th tsunami-genic source is larger than the thresholdszt iand 0 otherwise, andpi is the probability of occurrence of thei-th tsunami-genic source in a time window that was set equal 1 yr. The varianceV is calculated by
V=E(1−E)/(3+2) (5)
where3 is the reliability parameter which is set equal to 10 in the tsunami case. The 3 parameter is considered the assigned reliability of the prior model (Marzocchi et al., 2008), meaning that more than 10 historical data can change the prior probability distribution significantly (Grezio et al., 2010a). Following the definitions in Marzocchi et al. (2008), EandV can be expressed by
E=α/(α+β)andV=E(1−E)/(α+β−1) (6) Having calculatedEby Eq. (4) andV by Eq. (5) and in-verting forαandβ in Eq. (6) the prior distributionfprior(θ ) is univocally defined by those parameters.
Table 1. Mean of the posterior probability×yr−1in the TRZi(i= 1,2,3).
TRZ1 TRZ2 TRZ3
II 5.9×10⁻³ 3.9×10⁻³ 0.0003×10⁻³
tsunami intensity and the relative run-ups are indicated for tsunami events that occurred in the last 500 yr. For large run-up thresholds (zt i,i=2,3,4), the historical information in the catalogue of the Italian Tsunami are exhaustive because of the importance of the events. Small tsunami waves with intensity<3 usually meaning run-up<1 m and/or 0.5 m run-ups were not reported by the past observations in Messina. However, Papadopoulos (2009) showed the correlation be-tween earthquake magnitude and tsunami intensity expressed by the Sieberg-Ambraseys scale. In the magnitude range of the present study, it is possible to individuate 11 events of tsunami intensity≥2 in the Mediterranean Sea based on Pa-padopoulos’ (2009) study. Considering this general figure representative also for the Messina Strait Area, we conjec-ture that the annual probability of tsunami overcoming 0.5 m would be higher in TRZ1.
Finally, in the present study we calculated the annual pos-terior probabilityfpost(θ )by the Beta distribution
fpost(θ )=Beta(α+y,β+n−y) (7) whereyandnare respectively the number of events and the number of success. In general, iffpost(θ )defines the proba-bility of occurrence of at least one tsunami event, then 1-f (θ ) is the generic probability that no tsunami occurs. The final posterior distribution fpost(θfinal) that combines both SSSs and SMFs cases in the Messina Strait Area is then
fpost(θfinal)=1− [(1−fpost(θSSS))(1−fpost(θSMF))] (8) Specifically for this tsunami application, we calculated the mean of the annual posterior probability (5) that is asso-ciated to each TRZi (i=1,2,3) (Table 1). Further details on the General Modular Bayesian PTHA procedure and its application in the Messina area can be found in Grezio et al. (2010a, b).
2.2 Exposed Elements (EE)
The exposed elements (humans and buildings) represent the elements that can be lost in the TRZ during a calamitous tsunami.
2.2.1 Human Exposure (HE)
In the HE case, a factor indicating the time of exposition (TEXP)to a potential tsunami event is introduced. This fac-tor is expressed in terms of hours, h, per day (h/24): it is not constant during the year in private and public places and it
also changes from one category to the other. For example, the number of tourists and students varies by at least one or-der of magnitude from winter to summer. Two months (Jan-uary and August) are chosen to describe the minimum and maximum HE during a representative year. The HE was esti-mated in different places both private and public. The private places are grouped into the following categories: Residential Houses, Hotels and B&Bs. The public places are grouped in: Schools (nursery school and day nursery, primary, secondary, and high schools, both public and private schools) and Uni-versities; Hospitals and Emergencies; Trade Fair; Port and Train Station. Workers are almost a constant number dur-ing the year, generally with about 2 work shifts of about 8 h each. Students, patients, tourists, and visitors are in variable number during each month and during the day. For the HE estimations, we use the highest number of people present in the TRZ for the longest time. It means that the worst case of exposure to a potential tsunami is considered.
– The total number of Residents in the TRZ is about 788. TheirTEXP is 1 (=24/24); this assumption means that all the residents could be present in the TRZ at any time during the year. These data have been extracted from the ISTAT 2001 census.
– The number of Tourists in Messina in January is about 209 per day and in August about 2299; this is a number based on the available tourist accommodation in Hotels, B&Bs and campings in the city area. Since it is diffi-cult to locate the tourists, we consider them uniformly spread over the TRZ. In general we assume that their TEXP is 1 (=24/24), as it is for the residents. Infor-mation on tourists arriving in Messina is provided by ISTAT 2006 (Pontrelli, 2007; Tinti et al., 2008). – A High School and a University Office are present in the
TRZ3. On average there are about 30 PhD students dur-ing the day in January and just about 10 students per day in August and 10 employees in the University Office. In the High School edifice there are 560 students, 120 professors and 25 more workers. The assignedTEXPis 0.25 (=6/24) for the high school in January and 0 in August, when schools are closed. TheTEXPfor the peo-ple in the University Office is 0.333 (=8/24). These data have been provided respectively by the Headmas-ter of the High School and by the overseer of the PhD Office of the University for the school/academic year 2008–2009.
(a) (b) (c)
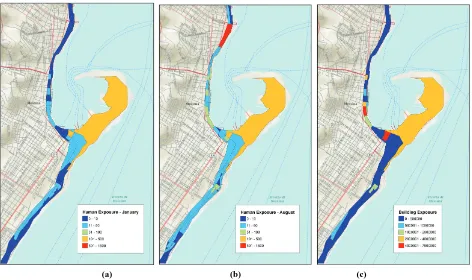
Fig. 4. Human Exposure HEji in terms of number of persons (a) in January and (b) in August, and (c) Building Exposure BEji in terms of economic value (Euro) in eachj-th section fraction in thei-th TRZi (j=1,54 andi=1,2,3).
– There are no hospitals and emergencies in the TRZ. However, since we suggest a general procedure, it is worth suggesting how to treat this category of struc-tures. We separate theTEXP of hospitals from theTEXP of emergencies. They are different and are respectively 1 (=24/24) for patients in hospitals, and 0.333 (=8/24) for working people like doctors, nurses, and so on, with 3 work shifts. TheTEXPin emergency is 0.083 (=2/24) for patients, a value calculated as an average waiting time in Messina, and 0.333 (=8/24) for working peo-ple.
– The total number of travelling people in the Messina Train Station is 4798 in winter and 4381 in summer dur-ing a typical workdur-ing day and it is 937 in winter and 1060 in summer during a holiday. Due to the location of the railway station, we assume that travellers are dis-tributed between TRZ1and TRZ2. We choose the high-est number in both cases (January and August) without distinction between working days and holidays and as-sume a mean waiting time of half an hour in the train station,TEXP 0.021 (=0.5/24). There is no available information about the staff. Data are provided by the Train Authorities.
– The total number of travelling people in the Messina Port is about 1203 per day and the number of working
people is 501. All these people are attributed to the TRZ1. The usual time of staying in the port before crossing the Messina Strait is about 1 h, then theTEXP of the travellers is 0.042 (=1/24). The working time ex-position factor is equal 0.333 (=8/24) because 8 h is a working shift, assuming 2 shifts per day with suspended work in the night. Data are provided by the Port Author-ities (Pontrelli, 2007; Tinti et al., 2008).
All these data are summarized in Table 2. According to the above data, the total daily HE in January is 1084 and in Au-gust, 5304. These results represent the lowest and the highest number of people exposed daily to a potential tsunami wave in Messina in the area limited by the run-up levels 0.5–10 m in two significant periods of a generic year.
The ISTAT sections are used to estimate the HE in a higher resolution representation of the Messina territory. Section extension and data are very different and heterogeneous in each TRZi (i=1,2,3). We also consider that each section and the relative data are not completely included in a single TRZ but can be divided by the runups isolines in two or more portions pertaining to different TRZs. First, we evaluate the mean areal densityAiof the daily HEi in eachi-th zone
Ai=HEi/SAi, i=1,2,3 (9)
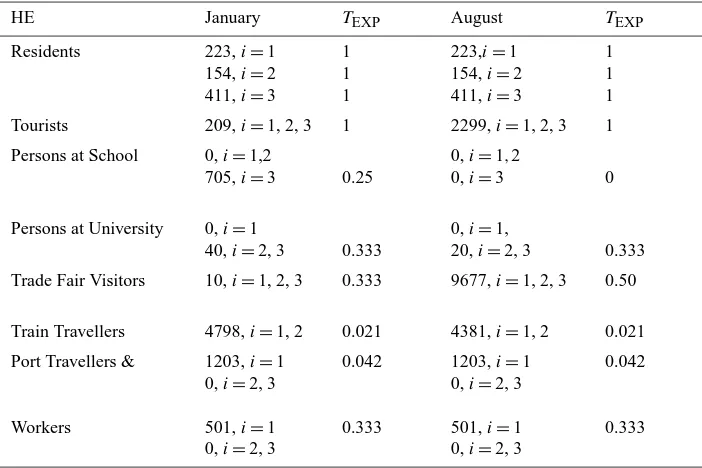
Table 2. Daily HE in the TRZi(i=1,2,3) in January and in August and corresponding assumedTEXP.
HE January TEXP August TEXP
Residents 223,i=1
154,i=2 411,i=3
1 1 1
223,i=1 154,i=2 411,i=3
1 1 1
Tourists 209,i=1, 2, 3 1 2299,i=1, 2, 3 1
Persons at School 0,i=1,2
705,i=3 0.25
0,i=1,2
0,i=3 0
Persons at University 0,i=1
40,i=2, 3 0.333
0,i=1,
20,i=2, 3 0.333
Trade Fair Visitors 10,i=1, 2, 3 0.333 9677,i=1, 2, 3 0.50
Train Travellers 4798,i=1, 2 0.021 4381,i=1, 2 0.021
Port Travellers & 1203,i=1 0,i=2, 3
0.042 1203,i=1
0,i=2, 3
0.042
Workers 501,i=1
0,i=2, 3
0.333 501,i=1
0,i=2, 3
0.333
Table 3. Daily HE in January and in August in the TRZi
(i=1,2,3).
TRZ1 TRZ2 TRZ3
HEJanuary 334 248 502 HEAugust 1055 1736 2513
each TRZi (i=1,2,3) is shown in Table 3. Second, we cal-culate the resulting portionSjAiof thej-th section pertaining to thei-th TRZ. Finally, we compute the value HEji in a such a portion of territory by means of the formula
HEij=Ai×SAij , i=1,2,3,j=1,....,54 (10) Figure 4a and b shows the value of HEji respectively in January and in August in the fraction of thej-th section be-longing to thei-th TRZi(i=1,2,3).
2.2.2 Building Exposure (BE)
In the BE case, it is assumed that the economic value de-pends on the surface and location of the buildings. The BE estimation is calculated only in terms of the economic value of the buildings in the TRZi (i=1,2,3). The build-ing value is available and freely provided by the Italian Na-tional Agency of the Territory (Agenzia Nazionale del Terri-torio, http://www.agenziaterritorio.it/). This agency gives the economic value of the buildings for each municipality in Italy according to some predefined typology (residential, commer-cial, industrial), and to their location (streets). We calculate
Table 4. BE in terms of Economic Value (millions of Euros) in the TRZi (i=1,2,3).
TRZ1 TRZ2 TRZ3
BE 6.16 11.14 26.40
an Averaged Economic Value per m2(AEV) for the TRZ of Messina, that results to be equal to 1677.80 Euro per m2. The BEi for each TRZi (i=1,2,3) is shown in Table 4. Finally, we compute the total BE that equals 43.70 millions of Euros in the TRZ limited by the run-up levels 0.5–10 m.
Typologies and locations of the single buildings are not provided in the ISTAT database, but other very useful data such as the edifice areas are given for each section. They allow us to estimate the BE in terms of economic value using the same procedure of Eq. (10) and introducing the AEV in the formula:
BEji =BAji×AEV, i=1,2,3,j=1,....,54 (11) where BAji is the area of the exposed buildings of the j-th section portion in eachi-th TRZ. A map of BEji is given in Fig. 4c.
2.3 Vulnerability (V)
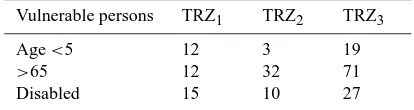
Table 5. Number of persons with vulnerable characteristics in the TRZi(i=1,2,3).
Vulnerable persons TRZ1 TRZ2 TRZ3
Age<5 >65
12 12
3 32
19 71
Disabled 15 10 27
2.3.1 Human Vulnerability (HV)
In various natural hazard assessments, the vulnerability of people and communities can be measured by indicators (Dwyer et al., 2004). The combination of these indicators describes the HV level. In Dwyer et al. (2004), the indi-cators were related to age, income, residential type, tenure, employment, English language skills, household type, dis-ability, house insurance, health insurance, debt and savings, car, gender. In the present study, two indicators only are cho-sen on the basis of the peculiarity of the Italian society:
– Age: people over 65 and under 5 are considered more vulnerable.
– Disability: disabled people at home are usually more vulnerable.
The number of people and their ages can be found in the IS-TAT database, whereas the number of disabled people living at home is not directly provided by the ISTAT. However, the Ministry of Work and Social Politics in Italy in collaboration with the ISTAT has elaborated an information project indi-cating the average number of disabled people in each Ital-ian region (http://www.handicapincifre.it/). Disabled people older than 5 yr living at home were 6.6 % of the total popula-tion in the Sicily region during the years 2004–2005. We use this general figure also for the population living in the TRZi (i=1,2,3) of Messina. We calculate the number of vulnera-ble persons, VP, as a portion of the residents (that are invari-able during the year) because there is no availinvari-able data on age and disability regarding the tourists, travelers, trade fair visitors, and students. For this reason, VP is constant in Jan-uary and August. More details are shown in Table 5. Finally, we assume that the greatest part (90 %) of all people younger than 5, older than 65, and disabled are vulnerable and that only a small portion portion (10 %) of residents (not present-ing any vulnerable indicator) could be vulnerable (10 %). So that
VP=P<5,>65,D×0.90+(PResidents−P<5,>65,D)×0.10 (12)
Also in this case, we used the mean areal densityaiin each i-th TRZi(i=1,2,3)
ai=VPi/SAi,i=1,2,3 (13)
Table 6. Number of buildings with vulnerable indicators in the TRZi (i=1,2,3).
Vulnerable buildings TRZ1 TRZ2 TRZ3
Isolated 2 2 9
Not reinforced concrete walls 3 4 14
Bad building conditions 19 17 58
and we compute the VPji using the formula
VPij=ai×SAij , i=1,2,3,j=1,....,54 (14) Finally, the HVji is the fraction of the exposed residents HE
Residentsji
HVji =VPji/HE
Residentsji, i=1,2,3,j=1,....,54. (15) in eachj-th section and is shown in Fig. 5a.
2.3.2 Building Vulnerability (BV)
According to Papathoma and Dominey-Howes (2003), the BV is related to the material of the building, the row, the number of floors, the building surroundings, the condition of the ground floor, the presence of sea defence in front of the building, and the width of the inter-tidal zone (in general the natural environments) in front of the building. In the present case we use three indicators:
– Isolated Building: they are considered more vulnerable. – Building materials: not reinforced concrete walls are
less resistant to tensile actions and more vulnerable. – Building conditions: bad conditions of a building
in-crease the vulnerability.
The total areaBof the vulnerable buildings covers the build-ings presenting at least one of the vulnerable indicators. More details are shown in Table 6.
The BVji is the fraction of BEji calculated considering the AEV in the following equation:
BVji =Bij/BEij×AEV, i=1,2,3,j=1,....,54 (16) whereBij is the total area of the vulnerable buildings of the j-th section portion in eachi-th TRZ. The considerable BV value is explained by the high number of buildings in bad conditions in the TRZ as is indicated in Table 6. A map of BVji is given in Fig. 5b.
(a) (b)
Fig. 5. (a) Human Vulnerability HVji and (b) Building Vulnerability BVji in eachj-th section fraction in thei-th TRZi (j=1,54 and i=1,2,3).
when the importance of the building vertical evacuation is considered (Dall’Osso et al., 2010; Omira et al., 2010; Pap-atoma et al., 2003a). In the case of a near-source-generated tsunami, the first wave can arrive within minutes and people with limited mobility (seniors, young children or disabled people) are assumed to walk or move slowly, much less than 1 m s−1. This vulnerable portion of population could con-sider vertical evacuation as a fast evacuation option. It is worth it to indicate the number of buildings offering a po-tential vertical evacuation for each section. We consider the edifices with 5 or more levels as buildings for potential ver-tical evacuation because more than 4-floored buildings are edifices higher than 10 m. They are indicated by black stars in Figure 1a. More detailed information on the resistant ca-pacity of those buildings to the seismic and tsunami forces are needed in order to indicate those buildings as effective for vertical evacuation. However, this kind of information is not available for the present study.
3 Tsunami damage assessment
In general, the degree of DamageDis defined asD=EE×V and quantifies the consequences of a natural event. We com-puted the Tsunami Damage (TD) in January and August both in the human case
HDji =HEji×HVji, i=1,2,3,j=1,....,54. (17)
and in the building case
BDji=BEji×BVji, i=1,2,3,j=1,....,54 (18) in the each portion of thej-th section belonging to thei-th TRZ.
(a) (b) (c)
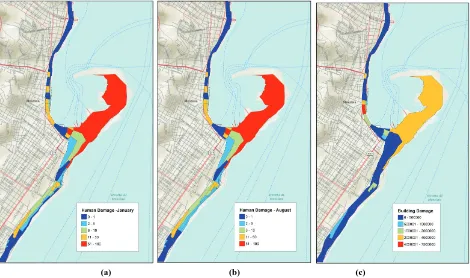
Fig. 6. Human Damage HDji in terms of number of persons (a) in January and (b) in August, and (c) Building Damage BDji in terms of economic value (Euro) in eachj-th section fraction in thei-th TRZi (j=1,54 andi=1,2,3).
Table 7. HD in January and August and BD (in millions of Euros) in the TRZi(i=1,2,3).
TRZ1 TRZ2 TRZ3
HDJanuary HDAugust
79 110
77 113
150 255
BD 3.74 5.10 20.12
if its velocity is higher than 3 m s−1. On the basis of this con-sideration, we could expect even higher values of HD in the TRZ1.
The BD is expressed by the economic value of the building and results to be 28.96 millions of Euros in the TRZ limited by the run-up levels 0.5–10 m. Figure 6c shows the BDji in eachj-th portion of each section in eachi-th TRZi.
Table 7 shows the degree of human and the building dam-age in the TRZi(i=1,2,3).
4 Tsunami Risk assessment
The TR based on the Fournier d’Albe definition of risk (Eq. 1) is equivalent to the TR expressed in terms of degree of damage, that is TR=5×TD.
Considering Eqs. (17) and (18), we calculate
HTRji =πi×HDji, i=1,2,3,j=1,....,54 (19)
Table 8. HTR daily in January and August and BTR (in Euro) daily in the TRZi(i=1,2,3).
TRZ1 TRZ2 TRZ3
HTRJanuary HTRAugust
1.3×10⁻³ 1.8×10⁻³
0.8×10⁻³ 1.2×10⁻³
0.0001×10⁻³ 0.0002×10⁻³
BTR 60.52 54.80 0.015
and
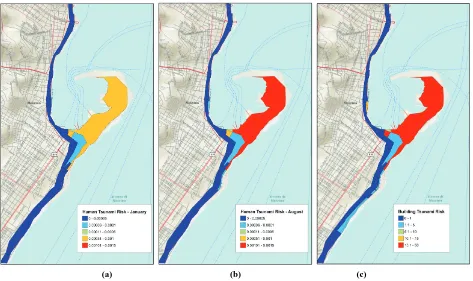
BTRji =πi×BDji, i=1,2,3,j=1,....,54 (20) that are respectively the Human Tsunami Risk (HTR) and the Building Tsunami Risk (BTR) in thej-th fraction area in eachi-th TRZi(i=1,2,3), whereπiis the occurrence proba-bility of a tsunami impact in each of the three TRZireferring to a given time period. In the following calculations we have considered daily occurrence probability. The minimum (in January) HTRi and the maximum (in August) HTRi and the BTRi in each TRZi (i=1,2,3) are summarized in Table 8.
(a) (b) (c)
Fig. 7. Human Tsunami Risk HTRji in terms of persons (a) in January and (b) in August, and (c) Building Tsunami Risk BTRji in terms of economic value (Euro) in eachj-th section fraction in thei-th TRZi (j=1,54 andi=1,2,3).
value in an annual time scale is about 42 000 Euro and on a century time scale it is about 4.2 million Euros.
5 Final remarks
The TR assessment taking into account the evaluation of the Hazard, Exposed Elements and Vulnerability (both for the human and building case) is presented here for the first time for the city of Messina. In the present study, the TR is cal-culated in three tsunami risk zones within the coastal area limited by the run-up levels 0.5–10 m. The Hazard is based on the new General Modular Bayesian PTHA Procedure for the case of submarine seismic sources and submarine mass failures (Grezio et al., 2010a, b). This procedure is inno-vative for two reasons: (a) the Bayesian procedure is ap-plied to an Italian/European site for the first time using both instrumental and historical data and (b) different types of sources are included to determine the tsunami hazard. The procedure can be further improved by the use of: (a) more advanced tsunami source generation and tsunami wave prop-agation models, and (b) longer data records. In this respect, we underline that the modular Bayesian PTHA is particu-larly suitable for the incorporation of any kind of update, in terms of new models and/or data availability. Any improve-ment will also allow the reliability parameter of Eq. (5) to be increased, making PTHA more precise. At this stage of
knowledge, we consider the modules adopted here adequate for a first order approximation of the probability.
These sections delineate the most complete set of available information at the highest resolution for the TR assessment.
The present tsunami risk assessment represents necessar-ily a lower limit, because it is based on the minimum value of the exposed and vulnerable elements. Many other elements (both material and social) cannot be evaluated at this stage. With the available information, we cannot evaluate reliably many factors that would increase the overall risk. A partial list of these factors contains the vulnerability of tourists, the exposure of many public infrastructure and private propriety, the economic activities damaged by a tsunami, the economic value of facilities such as the Port and the Train Station, the infrastructure (roads, railways and bridges), private property (cars, wagons, ships, goods and products in shops), etc. As a general estimation, we report the mean value of the con-struction cost of a road in Italy that is 258×103Euro km−1 (Maffei and Boccaccini, 2006). Further, we do not consider indirect damages such as the ones due to the disruption of the port that would heavily impact the city economy with signif-icant but not quantifiable economic losses. Moreover, we cannot yet consider the resilience. For example, the Messina Port is crucial for the economic and social connections of the city, and, more important, it is a decisive factor for the capacity of the city to recover after a calamitous event and to retrieve a normal economic, social, and cultural life. All these factors have to be considered in further analyses.
As final remark, we emphasize that the risk calculated here is due only to the tsunami. The combination of a tsunami event with an earthquake event (that could be close in time and could generate a tsunami itself) is not investigated here and the amplification of the catastrophic effects on the vul-nerable elements and exposed elements during the tsunami impact phase is also not examined in this study. The appro-priate analysis in this case requires a multi-risk assessment (Marzocchi et al., 2012) and was not the primary scope of this PTHA application.
Acknowledgements. The present study was supported by the EU Project TRANSFER. We thank Adriano Cavalieri for helping with ArcGIS and Laura Sandri for the discussions on PTHA. Finally, we thank the two referees for the useful comments that improved the quality of the paper.
Edited by: T. Glade
Reviewed by: G. Papadopoulos and M. Gonz´alez
References
Castello, B., Olivieri, M., and Selvaggi, G.: Local and duration magnitude determination for the Italian earthquake catalogue (1981–2002), Bull. Seismol. Soc. Am., 97, 128–139, 2007. Dall’Osso, F. and Dominey-Howes, D.: Public assessment of the
usefulness of “draft” tsunami evacuation maps from Sydney, Australia – implications for the establishment of formal evac-uation plans, Nat. Hazards Earth Syst. Sci., 10, 1739–1750, doi:10.5194/nhess-10-1739-2010, 2010.
Dweyr, A., Zoppou, C., Nielsen, O., Day, S., and Roberts, S.: Quantifying Social Vulnerability: A methodology for identify-ing those at risk to natural hazards, Geoscience Australia, Record 2004/14, 2004.
Fournier d’Albe, E. M.: Objectives of volcanic monitoring and pre-diction, J. Geol. Soc., 136, 321–326, 1979.
Grezio, A., Marzocchi, W., Sandri, L., and Gasparini, P.: A Bayesian procedure for Probabilistic Tsunami Hazard Assess-ment, Nat. Hazards, 53, 159–174, doi:10.1007/s11069-009-9418-8, 2010a.
Grezio, A., Marzocchi, W., Sandri, L., Argnani, A., and Gasparini, P.: Probabilistic Tsunami Hazard Assessment for Messina Strait Area (Sicily – Italy), Nat. Hazards, in review, 2010b.
Grilli, S. T. and Watts, P.: Tsunami generation by submarine mass failure, I: modeling, experimental validation, and sensitiv-ity analyses, J. Waterway Port Coast. Ocean Eng., 131, 283–297, 2005.
Gutenberg B. and Richter, C.: Frequency of earthquakes in Califor-nia, Bull. Seism. Soc. Am., 34, 185–188, 1944.
Jonkman, S. N. and Penning-Rowsell, E.: Human Instability in Flood flows, J. Am. Water Res. Assoc., 44, 1208–1218, doi:10.1111/j.1752-1688.2008.00217.x, 2008.
Kulikov, E. A., Rabinov, A. B., and Thomson, R. E.: Estimation Of Tsunami Risk For The Coasts Of Peru And Northern Chile, Nat. Hazards, 35, 185–209, doi:10.1007/S11069-004-4809-3, 2005. Maffei, P. L. and Boccaccini, R.: La determinazione dei costi
stan-dardizzati per la categoria di opere strade ed autostrade, Metodo, strumenti e sperimentazione su casi di studio, Autorit`a per la vig-ilanza sui lavori pubblici-Osservatorio dei lavori pubblici, 2006. Marzocchi W., Sandri, L., and Selva, J.: BET EF: A probabilis-tic tool for long- and short-term eruption forecasting, Bull. Vol-canol., 70, 623–632, doi:10.1007/s00445-007-0157-y, 2008. Marzocchi, W., Garcia-Aristizabal, A., Gasparini, P., Mastellone,
M. L., Di Ruocco, A., and Novelli, P.: Basic Principles of multi-risk assessment: a case study in Italy, Nat. Hazards, in press, 2012.
Okada, Y.: Internal deformation due to shear and tensile faults in a half-space, Bull. Seismol. Soc. Am, 82, 1018–1040, 1992. Omira, R., Baptista, M. A., Miranda, J. M., Toto, E., and Catida, C.:
Tsunami Vulnerability assessment of Casablanca-morocco using numerical modelling and GIS tools, Nat. Hazards, 54, 75–95, 2010.
Papadopoulos, G. A.: Tsunamis, in: Physical Geography of the Mediterranean, edited by: Woodward, J., Oxford University Press, Chapter 17, 493–512, 2009.
Papadopoulos, G. A. and Dermentzopoulos, T. H.: A Tsunami Risk Management Pilot Study in Heraklion, Crete, Nat. Hazards, 18, 91–118, 1998.
Papathoma, M. and Dominey-Howes, D.: Tsunami vulnerability assessment and its implications for coastal hazard analysis and disaster management planning, Gulf of Corinth, Greece, Nat. Hazards Earth Syst. Sci., 3, 733–747, doi:10.5194/nhess-3-733-2003, 2003a.
Papathoma, M., Dominey-Howes, D., Zong, Y., and Smith, D.: As-sessing tsunami vulnerability, an example from Herakleio, Crete, Nat. Hazards Earth Syst. Sci., 3, 377–389, doi:10.5194/nhess-3-377-2003, 2003.
2007, University of Bologna, 119 pp., 2007 (in Italian). Pondrelli, S., Piromallo, C., and Serpelloni, E.: Convergence vs.
retreat in the Southern Tyrrhenian Sea: insights from kinematics, Geophys. Res. Lett., 31, L06611, doi:10.1029/2003GL019223, 2004.
Sato, H., Murakami, H., Kozuki, Y., and Yamamoto, N.: Study of a simplified method of tsunami risk assessment, Nat. Hazards, 29, 325–340, 2003.
Synolakis, C. E.: The run-up of solitary waves, J. Fluid Mech., 185, 523–545, 1987.
Tinti, S., Maramai, A., and Graziani, L.: The new catalogue of Ital-ian Tsunamis, Nat. Hazards, 33, 439–465, 2004.
Tinti, S., Armigliato, A., Bartolucci, E., and Piatanesi, A.: Iden-tification of the Source Fault of the 1908 Messina Earthquake through Tsunami Modelling, Is it a possible task?, Phys. Chem. Earth (B), 24, 417–421, 1999.
Tinti, S., Tonini, R., Pontrelli, P., Pagnoni, G., and Santoro, L.: Tsunami risk assessment in the Messina straits, Italy, with ap-plication to the urban area of Messina. EGU General Assembly 2008, Vienna (Austria), 13–18 April 2008, Geophys. Res. Abstr., vol. 10, 2008, EGU2008-a-08045, 2008.
Vannucci, G. and Gasperini, P.: The new release of the database of Earthquake Mechanisms of the Mediterranean Area (EMMA2), Ann. Geophys., Suppl., 47, 307–334, 2004.
Watts, P., Grilli, S. T., Tappin, D., and Fryer, G. J.: Tsunami gen-eration by submarine mass failure, II: predictive equations and case studies, J. Waterway Port Coast. Ocean Eng., 131, 298–310, 2005.