Analyzing Internal Efficiency
Dynamics Of Turkish Banks:
Activity Based Multi-Objective
Dynamic DEA Model And Its Application
Tekiner Kaya, Ph.D., Nevsehir Haci Bektas Veli University, TurkeyAssoc. Prof. Yetkin Cinar, Ph.D., Hankuk University of Foreign Studies, Republic of Korea
ABSTRACT
Efficiency measurement is an important analysis for institutions in order to investigate their performance comparatively. On the other hand, evaluating efficiency of institutions carrying out more than one activity using common resources is important management problems. Since both efficiency and priorities may change in time, the problem set is getting more complex.
Sub-activities of total system (Decision Mak ing Sub-Units/DMSU) of institutions may act in different ways since they have different priorities or goals. In addition, factors effecting efficiencies of these DMSUs may differ. Each DMSUs' countermeasures can vary in order to reach the efficient frontier. Therefore, total system efficiency results may not represent the DMSUs' efficiencies.
In line with these inferences, the aim of this study is to analyze efficiency differences between DMUs and DMSUs in terms of their behaviors, efficiencies and countermeasures in a dynamic manner. A hybrid non-parametric dynamic efficiency evaluation model, "Multi-Activity Window Data Envelopment Analysis (MA-WDEA)", is developed first1. Then, internal dynamics of DMUs and DMSUs are analyzed via dynami c returns to scale(RTS) analysis and Tobit regression models. Both analysis are established on efficiency results of the MA-WDEA model.
The proposed process is applied to measure the performance of Turk ish bank ing system. The results first show that MA-WDEA is a suitable tool to measure efficiency trends of DMUs/DMSUs. There exist important differences among Turk ish bank s with respect to their operating and non -operating activities’ efficiencies. The results of the dynamic RTS and regression models also show that behavioral attitudes of DMUs and DMSUs are significantly different.
Keywords: Multi Activity Window-DEA: Decision Making Sub-Unit (DMSU); Dynamic Efficiency; Tobit Regression
1. INTRODUCTION
he measurement of relative efficiency is first implemented by Farrell (1957) based on the conceptual approach of Debreu (1951). In this perspective, Data Envelopment Analysis (DEA), a widely -used methodology for efficiency evaluation, was proposed by Charn es, Cooper and Rhodes (1978). It is a non-parametric efficiency measurement methodology which aims to measure efficiency of DMUs that produce similar product or service. There are lots of applications for non -profit corporations (e.g. universities, hospitals etc.) and private sector companies (e.g. banks, research & development projects, production facilities etc.) since it provides an efficient frontier in terms of comparisons among DMUs in the existing sample.
Evaluating efficiency of institutions carrying out more than one activity using common resources and deciding how to assign strategic priorities to these activities are important management problems. In recent years, hundreds of studies that use a network methodology of DEA which includes sub - activities of DMUs in efficiency evaluations have been published. Recently, as Kao et.al. (2014) mentioned, almost all of these studies of dynamic systems are restricted to the consideration of the only total structure of DMU (black box problem) in each period, and how to expand such approaches to network systems. Although a number of examples have been presented to show that an overall system may be efficient, this does not mean that all component processes or sub - activities are efficient. Considering the operations of the DMSUs may obtain more realistic results, DMSUs performance must be analyzed in detail.
On the other hand, investigating the dynamic trend of performance together with the black-box problem at the same time is important. The trend of efficiencies also give significant information for management. Although there are two discrete models i.e. one of which can ensure an activity based efficiency evaluation and one for investigating the dynamic trend of performance, there is a need for a hybrid dyna mic multi activity efficiency measurement model to cope with all issues at the same time.
In addition to dynamic multi activity efficiency measurement model, scale elasticity of DMSUs may also differ with DMUs in case of black-box issue. Returns to scale for multiple output–multiple input situations would use a recourse to prices, costs (or similar weights) to determine a “best” or “most economical” scale size.
Efficiencies of DMUs are also depend on different variables. So the decision makers struggle to understand the reasons behind these differences in success in timely basis. However, the variables effecting the success of total system and sub- activities may also differ. If there is a black -box structure in production system, different variables may be dominant on explaining the total and sub -efficiency trend.
In line with these inferences, aim of this study is to analyze the efficiency differences dynamically between total system and sub-systems in terms of their behaviors, problems, efficiencies and countermeasures that must be implemented to be an efficient DMU or DMSU. In order to do that, treatments of DMUs and DMSUs are analyzed based on MA-WDEA model developed by Kaya and Cınar (2015).
The rest of paper is organized as follows: Chapter 2 in troduces the methodologies used in this study: MA -WDEA, dynamic RTS analysis and dynamic Tobit regression analysis. Then an application is presented via introducing problem definition and data in terms of two main activities of banks in chapter 3. Chapter 4 presents results of application. Final chapter summarizes the findings and then concludes.
2. METHODOLOGY
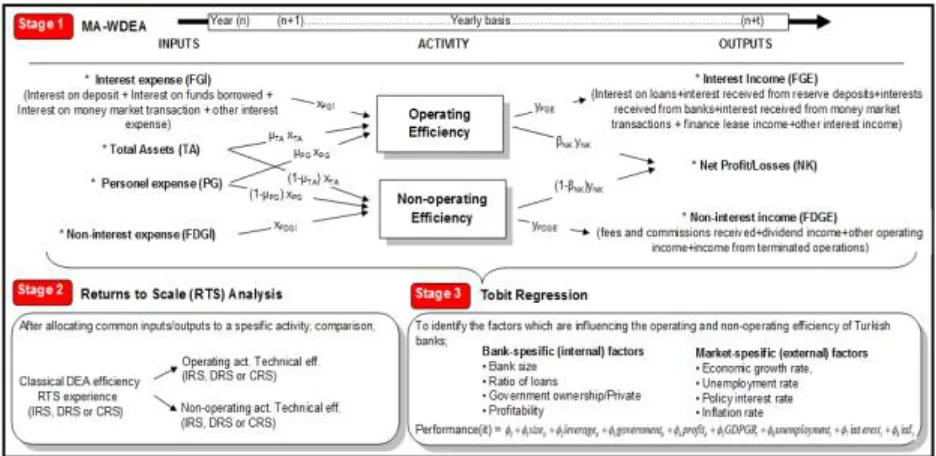
The study consists of 3 different models in order to figure out the behavioral differences between DMUs and DMSUs. In first stage, although there are two discrete models i.e. one of which can ensure an activity based efficiency evaluation and one for investigating the dynamic trend of performance, a hybrid non -parametric efficiency evaluation model called Multi-Activity Window Data Envelopment Analysis is presented to cope with all issues at the same time. On top of hybrid model, Window DEA (WDEA) version of Banker and Thrall (1992) model and dynamic Tobit regression analysis are established.
2.1. Hybrid Model: Multi - Activity Window Data Envelopment Analysis (MA-WDEA)
To obtain more reliable and detailed performance evaluation information, DMUs can be regarded as they have a network structure on their production processes. In other words, the complicated process of the entire production can be divided into several sub- activities called decision making sub-units. These sub- activities are called DMSU.
conventional black box approaches. In practice, generally operations have more than one activity. Ignoring the operations of the component processes may obtain misleading results, and a number of examples hav e been presented to show that some of the component processes may be efficient, even while the whole system is not (Kao and Hwang, 2008). The model has been applied to the efficiency evaluation of multi-objective, large-scaled, non-profit institutions in s uch fields as education, health, police forces, aviation and bus services (see, e.g. Cinar, (2013), Salerno (2006),Tsai & Mar Molinero (2002), Diez-Ticio & Mancebon (2002) and Yu (2007), Chen (2012), Chen et al.(2012), Yu and Lin (2008)).
Establishment of activity basis stability and performance sustainability is needed for institutions. In order to measure the stability and sustainability performance of DMUs and DMSUs simultaneously, a hybrid model called MA -WDEA is proposed by Kaya and Cinar (2015). The hybrid model is using the mathematical foundation of model that is known as MA-DEA approach by assigning common inputs/outputs among activities. At the same time, the hybrid model allows to make dynamic analysis of DMSUs by converting a panel into overlapp ing sequences of DEA Window Analysis. MA-WDEA is the combination of two DEA based models which are known as MA -DEA and DEA Window Analysis. The former is an efficiency measurement approach which provides to assign common inputs/outputs among activities, while the latter is used to make dynamic analysis of efficiencies by converting a panel data into overlapping sequences.
MA-WDEA model consist of time variables as in WDEA. tw is denoted as the window starting at time t, 1 ≤ t ≤ T − w + 1 and of width w, 1 ≤ w ≤ T. So the MA-WDEA model is;
Objective function:
Max.
Q
ktw=
kO,tw.
Q
kO,tw +
kN,tw.
Q
kN,tw (1) s.t.Operating efficiency (
Q
kO,tw)tw O S
Q
, = ,1
, , , , , , ,
a c tw ON s c tw c tw c tw O s a tw a g tw ON s g tw g tw g d tw O s d tw dx
u
x
v
y
u
y
u
s= 1,2,...k,...,S (2)
Non-operating Efficiency (
Q
kN,tw)N S
Q
=1
)
1
(
)
1
(
, , , , , , , ,
b c tw ON s c tqw c tw c tw N s b tw b g tw ON s g tw g tw g f tw N s f tw fx
u
x
v
y
u
y
u
s= 1,2,...k,...,S (3)
Priority of activities (weights)
tw N k tw O k , ,
=1 (4)Variable limits
twu
,v
tw
;Q
SN,tw,Q
SO,tw,Q
Stw
0s=1,...,S;
ctw,
gtw
(6)0
kO,tw
1
; 0
kN,tw
1
; (7)In order to present the MA-WDEA model, we define the parameters and variables of the model as:
tw k
Q
= k-th DMU's efficiency of t-th year in w-th period twO k
Q
, = k-th DMU's efficiency of “O”th activity of t’th year in w-th window twN k
Q
, = k-th DMU's efficiency of “N”th activity of t’th year in w-th window twO k
,
= the priority/weight of activity “O” of k-th DMU in t-the year in w-th window.tw N k
,
= the priority/weight of the activity “N” of k-th DMU in t-the year in w-th window.*
u
tw,v
tw show the weight allocations to the corresponding inputs and o utputs in t-the year in w-th windowrespectively.
*
x
aO,s,tw shows inputs which are only related with “O” activity in t -the year in w-th window (group-a);x
bN,s,tw showsinputs which are only related with “N” activity in t-the year in w-th window(group-b);
x
ONc,s,tw shows commoninputs which are shared by both activities in t-the year in w-th window(group-c);
*
y
Od,,stw shows outputs which are only related with “O” activity in t-the year in w-th window respectively(group-d);tw N
s f
y
,, shows outputs which are only related with “N” activity in t -the year in w-th window respectively(group-f); twON s g
y
, , shows common outputs which are shared by both activities in t -the year in w-th window respectively(group-g);*
ctwand
gtwshows the ratio of the allocation of shared variables, input(s) and output(s), to one specific activity int-the year in w-th window respectively.
2.2. Dynamic Returns to Scale Treatments
The economic concept of RTS has been widely studied within the different frameworks provided by DEA. RTS is considered to be increasing if a proportional increas e in all the inputs results in a more than proportional increase in the single output.
In order to be able to figure out the RTS treatments difference between DMUs and DMSUs, WDEA version of Banker and Thrall (1992) model is developed (9). In this model, it is only added time variable to Banker and Thrall (1992) model as in WDEA. tw is denoted as the window starting at time t, 1 ≤ t ≤ T − w + 1 and of width w, 1 ≤ w ≤ T. So the WDEA version of Banker and Thrall (1992) model is;
ma x z=
S r tw tw ro twr
y
u
u
1
0 , (8)
s.t.
S r tw rj tw ry
u
1 -
m i tw tw ij twi
x
u
v
1
0
0
, j=1,...,n,
m i tw io tw ix
v
11
,
tw iv
,u
rtw
,u
0twfree in sign.Banker and Thrall (1992) presented a theorem that identify RTS with the sign of
u
*0 in (8) as follows: Theorem. The following conditions identify the situation for RTS for the BCC model given in (8):(i) IRS prevail at ( 0
,
0 y
x
) if and only ifu
0* < 0 for all optimal solutions. (ii) DRS prevail at ( 0,
0
y
x
) if and only ifu
0* > 0 for all optimal solutions. (iii) Constant RTS prevail at ( 0,
0
y
x
) if and only ifu
*0 = 0 for at least one optimal solution.In order to be able to clarify common inputs/outputs, μ and β coefficients obtained via MA -WDEA model will be used. Then common inputs and outputs will be allocated each sub-activities. So, each DMSU's will be able to considered as a different DMU dynamically and RTS treatments of DMSUs will be able to introduced.
2.3 Determinants of Efficiency Via Dynamic Tobit Regression
Tobit model which was first suggested in econometrics literature by Tobin (1958) is used to investigate the determinants of efficiency. Model's aim is to explain the variation in calculated efficiencies to a set of explanatory variables i.e. inflation, loan ratio, interest rate etc. In addition to returns to scale issue issued in previous section, Tobit model can also handle the characteristics of the distribution of efficiency measures and thus provide results that can guide policies to improve performance.
The standard Tobit model can be defined as follows for observation "i":
i i
i
x
y
*
'
(9)* i i
y
y
ify
i* > 0 andi
where
i~ N(0,
2)
3,x
iand β are vectors of explanatory variables and unknown parameters, respectively. * iy
is a latent variable andy
iis the DEA score of DMU.3. APPLICATION: INTERNAL EFFICIENC Y DYNAMICS OF TURKIS H BANKING SYSTEM
3.1. Aim and the Scope of the Study
The aim of this study is to analyze the efficiency differences dynamically between total system and sub -systems (that generate the total system) in terms of their behaviors, problems, efficiencies and countermeasures that must be implemented to be an efficient DMU or DMSU. So, in line with this aim, dynamic trends of efficiencies and treatments of operating and non-operating activities of 11 largest Turkish commercial banks fo r the years 2003-2013 are evaluated first.
After figuring out the sub-efficiencies of DMSU over time, RTS treatments of DMUs and DMSUs are analyzed via dynamic version of Banker and Thrall (1992) model.
By using the efficiency results of MA-WDEA model, relationship between efficiency scores of DMSUs (operating and non-operating activities) and the market-specific(external) and bank-specific(internal) variables are exposed by dynamic Tobit regression analysis model.
3.2 Problem Definition and Data
Problems of this study can be classified into four category. First and the main problem is that there is no clear finding on the dynamic trends of efficiencies of operating and non -operating activities of Turkish banks simultaneously. Secondly, to find out whether DMUs' and DMSUs' efficiencies have relations or not in a dynamic manner. Thirdly, banks have no specific idea on both, operating and non -operating activities' efficiencies in terms of optimal RTS and how to be an efficient DMU by which experience; increasing returns to scale (IRS), constant returns to scale (CRS) or decreasing returns to scale (DRS). And finally, although indicators that are determining the performances of bank has been investigated in literature deeply, there are no clear indicators determining the performances of operating and non-operating activities of banks separately.
3.2.1 Data for MA-WDEA
This study consists of financial data for 11 largest Turkish commercial banks over the 2003–2013 periods (121 observations). The data obtained from the Banks Association of Turkey (BAT). These 11 banks can be divided into two groups as public and private. Banks were selected based on data availability for the years 2003-2013 on operating and non-operating activities for 45 banks. For the Tobit analysis, data are being obtained from BAT, Central Bank of the Republic of Turkey (CBRT) and Turkish Statistical Institute (TUIK).
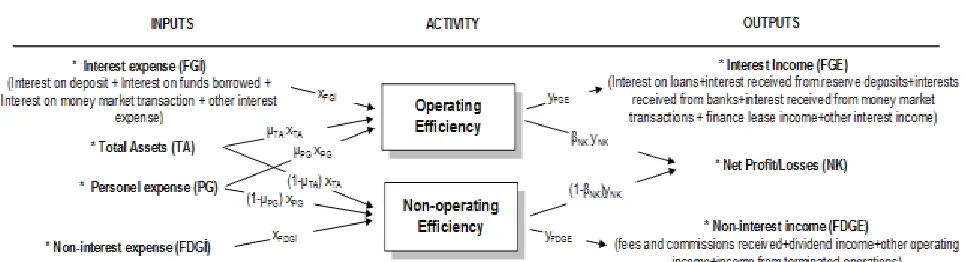
Figure 1. Inputs and outputs used in model
3.2.2 Data for Dynamic Tobit Regression Analysis
Dependent variables used for Tobit analysis can be classified into three groups: These are efficiencies of;
Total MA-WDEA Operating activity Non-operating activity
Independent variables are also categorized into two categories: market -specific(external) and bank-specific(internal) factors. Bank-specific(internal) factors are determined as ;
Bank size(total asset size)
Ratio of loans(Total loans to deposits)
Government ownership/Private(which is equal to 1 if government, 0 if private ownership is the case) Profitability (Net profit/Total asset)
And the market-specific(external) factors are determined as;
Economic growth rate, Unemployment rate Policy interest rate Inflation rate
3.3. Total Conceptual Framework of Study
Figure 2. Conceptual framework of production process
4. RESULTS
The results obtained from three different processes are evaluated in this section.
4.1 MA-WDEA Results
The efficiency scores are obtained by application of MA -WDEA model for each window width (w) and solved in Lingo software. The models are non-linear and have 100 variables in total.
Figure 3. Total efficiency of banks (2003-2013)
The total efficiency scores are fluctuating (figure 3). There is a significant increase on efficiency after 2006 and reached the maximum in 2010. After than, efficiencies reduced 15% till the end of 2013. The reason behind reduction on 2011 is based on the increase on provis ion for general loan losses in terms of legislation change.
Total Efficiency (%)
60% 70% 80% 90% 100%
2003 2004 2005 2006 2007 2008 2009 2010 2011 2012 2013
B
a
nk
s
'
E
ff
.
0% 9% 18% 27% 36% 45%
P
ol
ic
y
I
nt
e
re
s
t
R
a
te
s
(%
)
Figure 4. M A-WDEA scores of state-owned and private banks
In terms of state-owned (Vak, Zir and Hal) and private banks differences, state-owned banks’ efficiencies are significantly higher than privates (figure 4). However, the trends are similar. In addition, the fluctuations on state -owned banks are less than privates.
Figure 5. Average α value of DMU in each term
In figure 5, it is seen that operating activity has significant affect on total efficiency. (α score is the weight of operating activity’s efficiency in total efficiency).
MA-WDEA Total Eff. Scores by Periods & Bank Type
93,2% 90,9%
95,6% 94,4%
87,3% 92,9%
84,0%
88,3%
80% 90% 100%
2003-2005 "Contraction and Recovery"
2005-2007 "Growth and M&A (mergers and
acquisition)"
2007-2010 "Global Financial Crises and Its
Complications"
2010-2013 "Global uncertaintity and chary
policies" State-Owned
Private
α (Alfa)
0% 20% 40% 60% 80% 100%
2003 2004 2005 2006 2007 2008 2009 2010 2011 2012 2013
Zir Hal Vak Ak Gar İş Yap Teb Den Fin HSB
Figure 6. α weights of banks by bank type and periods
The changes on μ1 variable (figure 7) which are the personnel expense allocation ratio for operating activity is towards to increase year by year. Great majority of personnel expense was used for operating activities.
Figure 7. Average μ1 values of DMU in each term
For total asset allocation ratio (μ2), banks allocated majority of assets for operating activity naturally (figure 8). However, state-owned banks have used total asset on operating activity higher than private banks.
MA-WDEA Alfa Scores by Periods & Bank Type
54,1% 81,4%
88,1% 91,5%
83,8% 80,5%
84,3% 82,9%
40% 60% 80% 100%
2003-2005 "Contraction and
Recovery"
2005-2007 "Growth and M&A (mergers and acquisition)"
2007-2010 "Global Financial Crises and
Its Complications"
2010-2013 "Global uncertaintity and
chary policies" State-Owned Private
μ1
0% 20% 40% 60% 80% 100%
2003 2004 2005 2006 2007 2008 2009 2010 2011 2012 2013
Zir Hal Vak Ak Gar İş Yap Teb Den Fin HSB
Figure 8. Average μ2 values of DMU in each term
Figure 9. μ2 weights of banks by bank type and periods
Regarding common output (net profit) allocation ratio (β), net profits were generated via different policies in different years. So each bank had different profit policy in considered period.
Figure 10. Average β values of DMU in each term
μ2
0% 20% 40% 60% 80% 100%
2003 2004 2005 2006 2007 2008 2009 2010 2011 2012 2013
Zir Hal Vak Ak Gar İş Yap Teb Den Fin HSB
Policy Int.Rates
μ2 Scores by Periods & Bank Type
87,8%
94,8% 93,4%
80,6%
75,9% 82,2%
78,2%
89,1%
70% 80% 90% 100%
2003-2005 "Contraction and
Recovery"
2005-2007 "Growth and M&A
(mergers and acquisition)"
2007-2010 "Global Financial Crises
and Its Complications"
2010-2013 "Global uncertaintity and
chary policies"
State-Owned Private
β
0% 20% 40% 60% 80% 100%
2003 2004 2005 2006 2007 2008 2009 2010 2011 2012 2013
Zir Hal Vak Ak Gar İş Yap Teb Den Fin HSB
In general, net profit was gained via operating activities till 2007. After 2007, this scheme became reversed. This results show that, non-operating activities of banks have crucial role on profitability (figure 11).
Figure 11. β weights of banks by bank type and periods
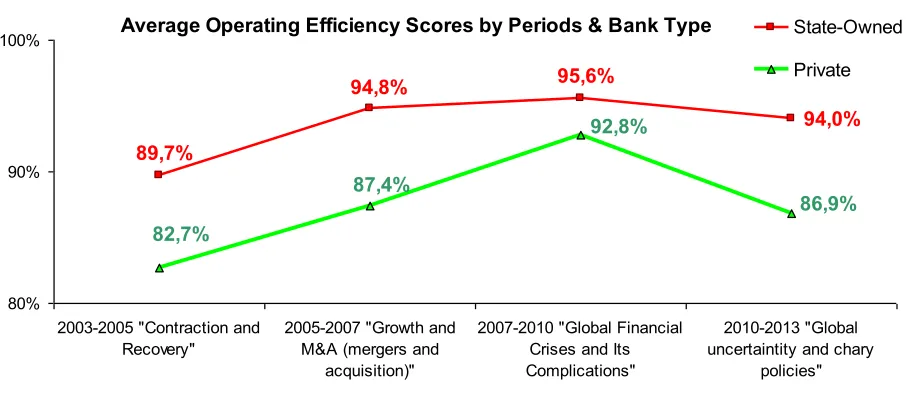
Operating efficiency scores are very similar to total efficiency scores of banks since the main activity of the banks are operating activity (average α scores of the banks are %86). In Global uncertainty period, all the banks' average operating efficiency ratios decreased.
Figure 12. Average operating efficiency of DM Us in each term
No difference observed between public or state-owned bank on operating activity efficiency (figure 13). However state-owned banks operating efficiencies are 7% higher than private banks.
β Scores by Periods & Bank Type
42,8% 50,6%
44,2% 49,4%
57,6% 60,1%
57,6%
47,3%
30% 50% 70% 90%
2003-2005 "Contraction and
Recovery"
2005-2007 "Growth and M&A
(mergers and acquisition)"
2007-2010 "Global Financial Crises
and Its Complications"
2010-2013 "Global uncertaintity and
Figure 13. Average operating efficiency of state owner / private banks
On non-operating activities efficiency side, the patterns are quite different comparing with operating and total efficiency results (figure 14). First, fluctuation on state owned banks are also higher than private ones. Since the non-operating activities' efficiencies are generally based on internal factors, the regulations done by Banking Regulation and Supervision Agency (BRSA) affected non -operating activities' efficiency more.
Figure 14. Average non-operating efficiency of DM Us in each term Average Operating Efficiency Scores by Periods & Bank Type
94,0%
94,8% 95,6%
89,7%
87,4% 82,7%
92,8%
86,9%
80% 90% 100%
2003-2005 "Contraction and Recovery"
2005-2007 "Growth and M&A (mergers and
acquisition)"
2007-2010 "Global Financial Crises and Its Complications"
2010-2013 "Global uncertaintity and chary
policies"
State-Owned
Private
Non-operating Efficency (%)
0% 20% 40% 60% 80% 100%
2003 2004 2005 2006 2007 2008 2009 2010 2011 2012 2013
Zir Hal Vak Ak Gar İş Yap Teb Den Fin HSB
Figure 15. Average non-operating efficiency of state owned / private banks by periods
Spearman correlation coefficient between operating and non -operating activity efficiencies are %30 which is quite weak. This means that there is no relation between operating and non-operating activity efficiencies of banks.
4.2. RTS Treatment Results
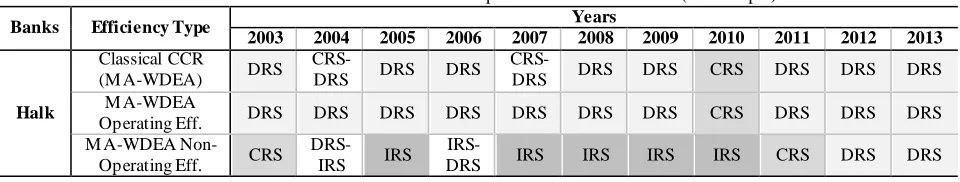
In table 1, the RTS results can be seen depending on total efficiency, operating and non -operating activity efficiency results. The results show that RTS treatment of firms as DMU and DMSUs are different. In example, in year 2005, Halkbank can reach the efficient frontier by DRS (table 1). However, Halkbank must use IRS for non -operating activity in order to reach efficient frontier.
Table 1. RTS results of banks in different periods based on activities (as a sample)
Banks Efficiency Type Years
2003 2004 2005 2006 2007 2008 2009 2010 2011 2012 2013
Halk
Classical CCR
(M A-WDEA) DRS
CRS-DRS DRS DRS
CRS-DRS DRS DRS CRS DRS DRS DRS M A-WDEA
Operating Eff. DRS DRS DRS DRS DRS DRS DRS CRS DRS DRS DRS M A-WDEA
Non-Operating Eff. CRS
DRS-IRS IRS
IRS-DRS IRS IRS IRS IRS CRS DRS DRS
And also in table 2, percentage of DRS treatments of DMUs and DMSUs that have been interpreted for four separate sub-periods can be seen.
Non-Operating Efficiency Scores by Periods & Bank Type
63,2%
60,2%
74,7% 82,2%
60,1% 70,3%
62,8% 66,1%
50% 60% 70% 80% 90%
2003-2005 "Contraction and Recovery"
2005-2007 "Growth and M&A (mergers and
acquisition)"
2007-2010 "Global Financial Crises and Its Complications"
2010-2013 "Global uncertaintity and chary
policies"
State-Owned
Table 2. Percentage of DRS of BCC efficiency scores that have been interpreted for four separate sub-periods for DM Us and DM SUs
Eff. Type
2003-2005 “Contraction and Recovery” Period
2005-2007 “Growth and M&A (mergers and acquistion)”
Period
2007-2010 “Global Financial
Crises and its Complications”
Period
2010-2013 “Global uncertainty and
chary policies” Period
Percentage of DRS
M A-WDEA
Total Eff. 78.8% 86.4% 84.8% 100.0%
M A-WDEA
Operating Eff. 72.7% 86.4% 72.7% 100.0% M A-WDEA
Non-Operating Eff. 60.6% 68.2% 42.4% 57.6% As a result of RTS treatment analysis, DMUs' and DMSUs' RTS treatments show distinctive differences in period basis. Since DMUs and DMSUs have generally different objectives, the internal dynamics and sub -activities of DMUs should also be considered.
4.3. Tobit Regression Results
Based on the classical regression models, a positive coefficient implies an efficiency increase whereas a negative coefficient means an association with an efficiency decline. The results of the regression are significant at 95% level or higher. Computations were conducted by EViews and R-square coefficients of regression models are obtained between 37% - 43%. %.
As a result of dynamic Tobit regression analysis, determinants of total system’s and sub -activities’ success are significantly different except profitability variable (Table 3).
Table 3. Significant effects of market and bank-specific independent variables to efficiency scores
Efficiencies
Market-specific (external) factors Bank-specific factors
Inflation GDPGR Unemploy. Interest
Rate S ize Leverage Govern. Profit
Total Eff. (-) (+)
Operating Activity Eff. (-) (-) (+)
Non-operating Activity Eff. (-) (+) (+) (-) (-) (+) * All the signs stand for statistical significance at 95%.
The Tobit results prove that the results of very weak correlation between operating and non -operating efficiencies in the period 2003-2013 since the variables that affecting operating and non -operating efficiencies are different. While market specific factors are affecting operating efficiency, bank-specific factors have higher impact on non-operating activities’ efficiency.
5. CONCLUS ION
The systems will be more complicated and more integrated in near future by the rapid developments on technology and globalization. Systems are growing up and covering more activities. The performance measurement of these kind of systems requires to be considered sub - activities since these sub- activities have different objectives, priorities and even management approaches. Considering and measuring the performance of only whole system may prevent decision makers to see actual and basic problems.
the decision makers can also see yearly basis activities’ efficiency score trend, they can also make root cause analysis DMSU based and learn from past experience.
The RTS results also show that RTS treatments of DMUs as one big mono-block system and DMSUs are different. Determinants of operating and non-operating activities' success also differentiate. The dynamic Tobit results prove the results of very weak correlation between DMSUs. While operating activity effic iencies of banks were being affected significantly by external factors, non-operating activities success depended on banks' internal factors.
Importance of jointly evaluating company level, activity -level and sub-activities level performance of banks would be indicated manifestly at the same time. For future projects, MA -WDEA approach can also be applied to determine the efficiency of different functions of universities, municipalities, hospitals, police stations, production facilities dynamically. And als o determinants of DMUs and DMSUs' efficiencies may be diversified.
AUTHOR BIOGRAPHIES
Tekiner Kaya, Ph.D. I graduated from Yildiz Technical University, Department of Industrial Engineering in 2003, then received a M.D. in Industrial Engineering in 2005 and a second M.D. in Management Engineering in 2008 from Istanbul Technical University. I worked for Toyota Motor Manufacturing in Turkey from 2005-2010 as a planning and development engineer. I received a Ph.D in from the Business Administration Departmen t at Ankara University. I have been working at Nevsehir Haci Bektas Veli University, in the Department of Business Administration, Quantitative Research branch as an assistant professor since April 2016. My field of studies are efficiency measurement, Toyota production systems, manpower planning, operations research, routing & scheduling. Email: [email protected]
Assoc. Prof. Yetkin Cinar, Ph.D. I graduated from Ankara University, department of Economics in 1999. I earned my M.A. and Ph. D. in Business Administration from Ankara University, in 2004 and 2007, respectively. I visited Moscow State University in 2006 as a researcher and Higher School of Economics, Moscow, in 2012, as a post– doctoral fellow. I have been working as an associate profess or since 2014 at Ankara University, Faculty of Political Science; and currently, I am a visiting professor at Hankuk University of Foreign Studies, Seoul. I have been studying on efficiency measurement, financial modeling and investment analysis; election systems and modeling; decision analysis and multi-criteria decision making. I have many articles and chapters in related areas.
REFERENCES
Banker R.D. and Thrall, R.M . (1992). Estimation of Returns to Scale Using Data Envelopment Analysis. European Journal of Operational Research, 62(1), 74-84.
Beasley, J. E. (1995). Determining Teaching and Research Efficiencies, "Journal of the Operational Research Society", 46, 441-452.
Berger, A.N., Humphrey, D.B. (1997). Efficiency of financial institutions: International survey and directions for future research, European Journal of Operational Research,98, p. 251-269.
Charnes, A., Cooper, W.W. and Rhodes, E. (1978). M easuring the Efficiency of Decision M aking Units, European Journal of Operational Research, 2, 419-444.
Chen, P. C., (2012). M easurement of technical efficiency in farrow-to-finish swine production using multi-activity network data envelopment analysis: Evidence from Taiwan, Journal of Productivity Analysis, 38, 319–331.
Chen, P. C., Chang, C. C., Yu, M . M ., & Hsu, S. H. (2012). Performance measurement for incineration plants using multi-activity network data envelopment analysis: The case of Taiwan, Journal of Environmental Management, 93, 95–103.
Cinar, Y. (2013). Research and Teaching Efficiencies of Turkish Universities with Heterogeneity Considerations: Application of M ulti-Activity DEA and DEA by Sequential Exclusion of Alternatives M ethods, Working Paper, Higher School of Economics, National Research University, M oscow, WP7, 04.
Coelli, T.J., Rao, D.S.P., O'Donnell, C.J., Battese, G.E. (2005). An Introduction to Efficiency and Productivity Analysis, Springer. Debreu, G., (1951). The Coefficient of Resource Utilization, Econometrica, 19, 3, 273-292.
Diez-Ticio, A. and M ancebon, M .J. (2002). The Efficiency of the Spanish Police Service: An Application of the M ultiactivity DEA M odel, Applied Economics, 34 (3), 351-362.
Farrell, M .J. (1957). The M easurement of Productive Efficiency, Journal of the Royal Statistical Society, 120, 253-281. Kao, H.Y., Chan, C.Y., Wu, D.J. (2014). A multi-objective programming method for solving network DEA, Applied Soft
Kao, C., Hwang, S.N. (2008). Efficiency decomposition in two-stage data envelopment analysis: An application to non-life insurance companies in Taiwan, European Journal of Operational Research, 185, 418–429.
Kaya, T., Çınar, Y. (2015). Activity-Based Multi-Objective Dynamic DEA Model and Its Application to Turkish Banking System, 3rd International Conference on Governance, Management and Entrepreneurship Conference Proceedings, Crotia, 60.
Salerno, C. (2006). Using Data Envelopment Analy sis to Improve Estimates of Higher Education Institution’s Per student Education Costs, Education Economics, 14 (3), 281-295.
Tobin, J. (1958). Estimation of Relationships for Limited Dependent Variables. Econometrica, 26, 24-36.
Tsai, P.F. and M ar M olinero, C. (2002). A Variable Returns to Scale Data Envelopment Analysis M odel for the Joint
Determination of Efficiencies with an Example of the UK Health Service, European Journal of Operational Research, 141, 21-38.
Yu, M .M . (2008). M easuring the Efficiency and Return to Scale Status of M ulti-M ode Bus Transit – Evidence from Taiwan's Bus System, Applied Economics Letters, 15 (8), 647-653.
Yu, M . M . and Lin, E. T. J. (2008). Efficiency and effectiveness in railway performance using a multi-activity network DEA model, Omega, 36, 1005–1017.