Lincoln
University
Digital
Thesis
Copyright
Statement
The
digital
copy
of
this
thesis
is
protected
by
the
Copyright
Act
1994
(New
Zealand).
This
thesis
may
be
consulted
by
you,
provided
you
comply
with
the
provisions
of
the
Act
and
the
following
conditions
of
use:
you
will
use
the
copy
only
for
the
purposes
of
research
or
private
study
you
will
recognise
the
author's
right
to
be
identified
as
the
author
of
the
thesis
and
due
acknowledgement
will
be
made
to
the
author
where
appropriate
you
will
obtain
the
author's
permission
before
publishing
any
material
from
the
thesis.
A Thesis in partial fulfilment of the requirements of the Master of Resource Studies degree, Lincoln University
11
Abstract of a thesis submitted in partial fulfilment of the requirements
of the Degree ofM.R.S.
ASSESSMENT OF URBAN NONPOINT SOURCE WATER
POLLUTION IN CHRISTCHURCH
by P. Scholes
A need has been identified for more information on the origins and impacts of contaminants to encourage moves towards preventative solutions to the problems of nonpoint source degradation of the aquatic environment. This study addresses information requirements by investigating the key nonpoint source contaminants of concern to water quality in Christchurch urban waterways, developing a ranking scheme to establish priority contaminants, and quantifying the sources of one priority contaminant. Using the Christchurch study as a template, the study also focuses on how the complex information generated on nonpoint source pollution may be effectively utilised in waterway management.
A review of historical, biological and physico-chemical data in urban Christchurch indicates that there are several degraded waterways and reveals that nutrients, heavy metal and sediments are the nonpoint source contaminants of most concern in Christchurch urban waterways. A contaminant ranking scheme is developed which incorporates the potential effects of nonpoint source contaminants on community values. A ranking scheme may provide water managers with a mechanism to prioritise monitoring or abatement.
One of the highest ranked contaminants was zinc and this metal was chosen for source analysis. Likely contributors of zinc to the aquatic environment were identified through a screening process. A quantitative assessment of the loads generated from various sources of zinc revealed that zinc is predominantly derived from tyres and zinc-clad roofmg materials.
An integrated approach to analysis and management of nonpoint source water pollution is developed. Greater integration of the complex information needed to defme nonpoint source water quality problems is the initial approach to qualifying the issues of nonpoint source pollution for planning and policy development. Management is facilitated by information gathering and utilisation processes that provide the justifications for pollution abatement.
ACKNOWLEDGMENTS
Numerous people helped in the completion of this thesis. I would especially like to thank Dr. Sandy Elliott for his time and effort in preparation of this thesis. Also I thank Dr. Ken Hughey for his input into the resource management component of this thesis.
A special thank you goes to Bianca Sullivan for her help in my hour of need.
Thanks to all the postgrads in DNRE who provide an atmosphere conducive to table tennis and always do their upmost to help with any problem, be it technical, theoretical or social.
CONTENTS
Page No.Abstract... 11
Acknowledgments... 111
Contents... ... ... ... ... IV List of Figures... ... V111 List of Tables... IX 1.0 INTRODUCTION... ... 1
1.1 BACKGROUND... 1
1.2 AIMS AND OBJECTIVES... 4
1.3 OVERVIEW OF THESIS... 5
2.0 AQUATIC DEGRADATION AND NONPOINT SOURCE... ... 7
CONTAMINATION 2.1 INTRODUCTION... 7
2.2 ASSESSING ENVIRONMENTAL QUALITy... 8
2.2.1 Urbanisation Effects... ... 8
2.2.2 Environmental Health... 9
2.2.3 Water Quality Assessment Tools Used In Aquatic Ecosystem Protection ... 11
2.3 PROBLEMS IN ASSOCIATING NONPOINT SOURCE CONTAMINANTS ... 13
AQUATIC DEGRADATION 2.4 CONCLUSION... ... ... 17
3. JUSTIFYING NONPOINT SOURCE CONTAMINANT ABATEMENT IN .... 19
CHRISTCHURCH URBAN WATERWAYS 3.1 INTRODUCTION... 19
3.2 HISTORICAL REVIEW... 19
3.2.1 Avon & Heathcote Rivers... 20
3.2.2 Avon-Heathcote Estuary... 22
3.2.3 Summary of Findings of Historical Review... 23
3.3 BIOLOGICAL ASSESSMENT ... 24
3.3.1 Method of Review of Biological Information... 24
3.3.2 Freshwater Biological Impacts... 24
3.3.2.1 Invertebrates and Periphyton... 24
3.3.2.2 Synthesis - Invertebrates and Periphyton... 26
3.3.2.3 Fish... 26
3.3.2.4 Synthesis - Fish... 28
3.3.3 Saltwater Biological Impacts... 29
3.3.4 Biological Assessment Summary... 30
3.4 PHYSICO-CHEMICAL ASSESSMENT... 31
3.4.1 Nutrients... 32
3.4.1.1 Phosphorus... 32
3.4.1.2 Ammoniacal Nitrogen... ... 33
3.4.1.3 Nitrate... 34
3.4.1.4 Synthesis - Nutrients... 34
3.4.3 Heavy Metals... 35
3.4.4 Sediments... 35
3.4.5 Physico-chemical Summary... 37
3.5 INTEGRATING ENVIRONMENTAL ANALYSIS: KEY NONPOINT SOURCE .... 38
CONTAMINANTS IN CHRISTCHURCH URBAN SURFACE WATERS 3.5.1 Correlating Biological and Physico-chemical Impacts... 38
3.6 CONCLUSION... 41
4.0 RANKING CONTAMINANTS: A STEP TOWARDS ABATEMENT ... 43
4.1 INTRODUCTION... ... 43
4.2 APPROACH TO PRIORITISING CONTAMINANTS... 44
4.3 METHOD USED TO RANK KEY CONTAMINANTS... 47
4.3.1 Overview... 47
4.3.2 Environmental Risk - Intrinsic Ecological Value... 49
4.3.3 Recreation... 51
4.3.4 Aesthetics... 52
4.4 CONTAMINANT RANKING OF IMP AIRED URBAN CHRISTCHURCH ... 54
FRESHWATER REACHES 4.4.1 Results ... 54
4.4.2 Further Discussion ... 56
4.5 CONCLUSION... 56
5.0 SOURCE IDENTIFICATION & QUANTIFICATION:... 58
ZINC ASSESSMENT STUDY 5.1 INTRODUCTION... 58
5.2 METHODOLOGy... 59
5.3 ORIGINS OF ZINC... 59
5.3.1 Buildings Materials... 60
5.3.2 Automotive Sources... 61
5.3.3 Residential Sources... 63
5.3.3.1 Household Products... ... ... ... 64
5.3.3.2 Pesticides, Herbicides and Fertilisers ... 64
5.4 ZINC LOAD ANAL ySIS... 66
5.4.1 Roofmg and Guttering... ... ... ... ... ... ... 66
5.4.1.1 Overview ofRoofmg Types and Durability ... 66
5.4.1.2 Concentration Approach to Roof Load analysis ... 68
5.4.1.3 Corrosion Approach to Roof and Gutter Load Analysis ... 70
5.4.1.4 Paint fromRoofmg ... 71
5.4.2 Automotive ... 72
5.4.2.1 Fraction of Automobile-Related Emissions Entering ... 73
Stormwater 5.4.2.2 Tyres ... 74
5.4.2.3 Coolant... 75
5.4.2.4 OiL... 75
5.4.2.5 Exhaust Emissions... 76
5.4.2.6 Brake Linings... 77
5.4.3 Summary of Results Of Automotive Source Load Analysis ... 77
5.5 SUMMARY OF TOTAL LOAD ANALySIS... 78
5.6 CONCLUSION... 79
6.0 INTEGRATING NONPOINT SOURCE POLLUTION ISSUES INTO' ... 81
WATERWAY MANAGEMENT 6.1 INTRODUCTION... 81
6.2 URBAN NONPOINT SOURCE POLLUTION: A DIRTY WORD? ... 82
6.3 APPROACHING NONPOINT SOURCE WATER QUALITY PROBLEMS ... 83
6.4 ASSESSING A WATER QUALITY PROBLEM... 85
6.5 MONITORING... 87
6.5.1 Monitoring The Condition Or State Of The Environment... 87
6.5.2 The Role Of Decision-makers... ... 89
6.6 FURTHER ASSESSMENT - ANALYSIS AND MODELLING... ... 90
6.7 PRIORITY SETTING - RISK ASSESSMENT... 93
6.8 LINKING NONPOINT SOURCE POLLUTION INTO PLANNING ... 95
6.9 CONCLUSION... 96
7.0 CONCLUSIONS AND RECOMMENDATIONS ... 97
7 .1 RECOMMENDATIONS AND FURTHER RESEARCH CONSIDERATIONS ... 99
REFERENCES... 104
APPENDICES... 120
A 1.0 RESOURCE MANAGEMENT ACT 1991: Section 5(2)... 121
A.2.0 ENVIRONMENTAL REVIEW OF CHRISTCHURCH URBAN WATERWA YS ... .123
A 2.1 BIOTA OF THE URBAN CHRISTCHURCH AQUATIC ENVIRONMENT.. ... 123
A 2.1.1 Fish ... 123
A 2.1.2 Freshwater Invertebrates & Macrophytes... 122
A 2.2 ESTUARINE BIOTA... 125
A 2.2.1 Fish ... 125
A 2.2.2 Invertebrate... 125
A 2.3 REVIEW OF PHYSICO-CHEMICAL DATA IN THE AVON-HEATHCOTE ... 127
CATCHMENT A 2.3.1 Heavy Metals ... 127
A 2.3.1.1 Heavy Metals in the Sediments of the Avon and Heathcote ... 127
Rivers A 2.3.1.2 Heavy Metals in the Sediments of the Avon-Heathcote ... 128
Estuary A 2.3.1.3 Heavy Metals in Estuarine Biota... 129
A 2.3.1.4 Heavy Metals in the Water Column... 130
A 2.3.1.5 Heavy Metals in Stormwater... 133
A 2.3.2 Organics... 135
A 2.3.2.1 Organics in the Water Column... 135
A 2.3.2.2 Organics in Stormwater... 135
A 2.3.3 Nutrients ... 136
A 2.3.3.1 Nutrients in the Water Column... 136
A 2.3.3.2 Nutrients in Stormwater... 140
A 2.3.4 Pathogens... 141
A 2.3.4.1 Pathogens in the Rivers... 141
A 2.3.4.2 Pathogens in the Estuary ... 142
A 2.3.5 Sediment ... 142
A 2.3.5.1 Sediment in the Rivers... 142
A 2.3.5.2 Sediments in the Avon-Heathcote Estuary... 144
A 3.0 AQUATIC CRITERIA AND GUIDELINES... 145
A 4.0 RANKING DATA... 147
A 5.0 ZINC LOADING ESTIMATIONS ... 150
A 5.1 ROOFING ... -... 150
A 5.1.1 Christchurch Residential Galvanised Roofmg Area ... 150
A 5.1.1.1 Roof ... 150
A 5.1.1.2 Gutter ... 1 51 A 5.1.2 Zinc Load Estimates From Christchurch Residential Roofs... 152
A 5.1.2.2 Method 1. Corrosion Rate... 152
A 5.1.2.2 Method 2 - Average Concentration... 153
A 5.1.3 Christchurch Industrial Galvanised Roofmg Area... 154
A 5.1.4 Zinc Load Estimates From Christchurch Industrial Roofmg ... 154
A 5.1.4.1 Method 1 - Corrosion Rate... 154
A 5.1.4.2 Method 2 - Average Concentration... 155
A 5.1.5 Zinc Load Estimates From Christchurch Guttering... 156
A 5.2 AUTOMOTIVE... 156
A 5.2.1 Tyres... 157
A 5.2.2 Coolant... 159
A 5.2.3 Oil... 160
A 5.2.4 Exhaust Emissions... 161
A 5.2.5 Brake Pads... 162
A 6.0 CHRISTCHURCH RESIDENTIAL & INDUSTRIAL ROOF FIELD SURVEy ... 164
A 6.1 METHODOLOGy... 165
A 6.1.1 Residential... 165
A 6.1.2 Industrial... ... ... ... 166
A 6.2 RESULTS AND DISCUSSION... 166
A 6.2.1 Residential... 166
A 6.2.2 Industrial... 168
A 7.0 SCHOOL ROOF SURVEy... 169
A 7.1 METHODOLOGy... 169
A 7.2 RESULTS AND DISCUSSION... 170
SCHOOL ROOF SURVEY FORM... 175
FIGURES
Page No.Figure 1.1 Christchurch urban waterways location map... .... .... ... ... ... ... ... 3
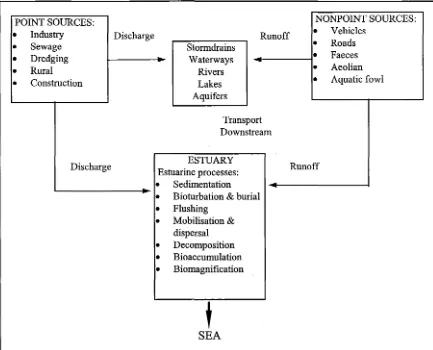
Figure 2.1 Possible flow of point source and nonpoint source contaminants in urban waterways .... 7
Figure 3.1 Comparison of trout densities to total fish densities for the Avon River.. ... 27
Figure 3.2 Total density of trout (per 100 m2 wetted area) vs impervious area, Avon River ... 28
1992. Figure 4.1 Schematic framework for a prioritisation mechanism through contaminant impact... 46
on waterway values. Figure 4.2 Example of ranking contaminants in Christchurch urban freshwater reaches... 49
Figure 4.3 Impact characteristics of contaminant exposure and toxicity/concentration on... 50
surface waters. Figure 4.4 Contaminant ranking of impaired Christchurch urban surface freshwater reaches ... .55
Figure 4.5 Cumulative % exceedence above recommended water quality criteria for leading ... 55
contaminants in Christchurch urban freshwater reaches. Figure 5.1 Flow and yield of zinc from major nonpoint pollution sources... ... 80
Figure A 2.1. Percentage fish occurrence by species for 3 Christchurch urban rivers, 1992... 123
Figure A 2.2. Comparison of trout densities to total fish densities for the Avon River... 124
Figure A 2.3. Comparison of copper concentrations in Christchurch baseflow with USEPA ... 130
criteria. Figure A 2.4. Comparison oflead concentrations in Christchurch baseflow with USEP A ... 131
criteria. Figure A 2.5 Comparison of zinc concentrations in Christchurch baseflow with USEPA ... 131
criteria. Figure A 2.6. Comparison of copper concentrations in Christchurch ~stuary waters with... 132
USEPA criteria. Figure A 2.7. Comparison oflead concentrations in Christchurch estuary waters with... 132
USEPA criteria. Figure A 2.8. Comparison of zinc concentrations in Christchurch estuary waters with ... 133
USEP A criteria. Figure A 2.9. Dissolved reactive phosphorus levels in the baseflow of the Avon River ... 137
Figure A 2.10. Dissolved reactive phosphorus levels in the baseflow of the Heathcote River ... 138
Figure A 2.11. Ammoniacal nitrogen levels in the baseflow of the Avon River... 138
Figure A 2.12. Ammoniacal nitrogen levels in the baseflow of the Heathcote River... 139
Figure A 2.13. Nitrate levels in the baseflow of the Avon River... 139
Figure A 2.14. Nitrate levels in the baseflow of the Heathcote River... 140
Figure A 2.15. Suspended Solids and guideline, Avon River 1989-94... 144
Figure A 2.16 Suspended solids and guideline, Heathcote River 1989-94... 145
Figure A 5.1 Zinc and lead concentrations distributed at the margins ofa roadway... 163
TABLES
Page No.Table 3.1 Ecological responses, possible contaminants, impacted sites, and possible sources of ... 30
nonpoint source surface water contamination for the freshwater reaches in the Avon-Heathcote catchment. Table 3.2 Contaminants exceeding recommended water quality guidelines and their... 37
locations, Avon-Heathcote catchment, 1989-94. Table 3.3 Physico-chemical, biological impainnent and hydrological observations in ... 40
Christchurch urban freshwater reaches. Table 4.1 Toxic/concentration ranking... 51
Table 4.2 Recreational ranking... 52
Table 4.3 Audience ranking ... 53
Table 5.1. Concentration of zinc in roof runoff... ... ... ... ... 61
Table 5.2 Zinc concentrations from automotive components... 63
Table 5.3 Zinc coated roofmg products and atmospheric corrosion rates for zinc... 67
Table 5.4 Average zinc concentrations from galv-steel roof runoff for excellent to poor... 69
roofmg conditions. Table 5.5 Results of zinc loading analysis from roofmg for Christchurch, 1996.... ... ... 72
Table 5.6 Estimated automotive source loads in urban Christchurch, 1996... 78
Table 5.7 Summary of non point sources and loads of zinc in urban Christchurch... 79
Table A 2.1 Organic compounds in the Christchurch aquatic environment... l35 Table A 3.1 Guidelines for the protection of aquatic ecosystems from heavy metals in... 145
sediment. Table A 3.2 Guidelines for the protection of aquatic ecosystems from heavy metals in ... 145
surface waters. Table A 3.3 Nutrient guidelines for limiting undesirable biological growths in freshwater... 146
Table A 3.4 Recommended guidelines for low and storm flow of nutrients and suspended... 146
solids in urban runoff. Table A 4.1 Means for contaminant data sets, 1989-95 in base flow... 147
Table A 4.2 Ranking of contaminants and freshwater reaches in Christchurch... 147
Table A 4.3 Ranking values for metals in Christchurch urban freshwater reaches... 148
Table A 4.4 Ranking values for nutrients and suspended solids in Christchurch urban... 149
freshwater reaches. Table A 6.1 Roof survey areas, ages and number of dwellings... 165
Table A 6.2 Results of Christchurch residential roofmg survey... 166
Table A 6.3 Weighted results of Christchurch residential roofing survey - roofmg conditions ... 167
for galv-steel roofs. Table A 7.1 Results of school roofmg survey... 172
Table A 7.2 Average zinc concentrations from galv-steel roof runoff for excellent to poor... 173 roofmg conditions.
N ow the stream of our common consciousness seems to be obliterating its own banks, loosing its central direction and purpose, flooding the lowlands, disconnecting and isolating the highlands and to no particular purpose other than the wasteful fulfilment of its own internal momentum. Some channel deeping is called for.
Introduction 1
1..
INTRODUCTION
1.1 BACKGROUND
There are two classes of waterway pollution, nonpoint source and point source. 'Nonpoint' or 'nonpoint source' pollution can be defined as pollution created from diffuse sources, often entering surface waters at intermittent or irregular intervals, and often related to meteorological events. Water pollution resulting from nonpoint sources is influenced by a variety of land uses or activities as well as hydrological and geological conditions. Examples of activities that can give rise to nonpoint source pollution are the application of fertilisers and pesticides, construction, and transportation (Novotny and Chesters, 1981, p6).
Point source pollution is readily identifiable as emanating from discrete, usually single locations that are easily measurable and quantifiable. Examples of point sources are effluent emitted from industry, and sewage treatment plants (Novotny and Chesters, 1981, p6).
Several countries have found their waterways still polluted after extensive clean up efforts of point source emissions over the past 40 years (e.g. United States of America, Canada, Sweden). This led to the realisation that only one side of the water quality problem was being tackled, bringing into focus the nonpoint source pollution issue.
Introduction 2
Nonpoint source pollution of waterways in urban areas is usually associated with stormwater runoff. Novotny and Chesters (1981, pll) suggest that work carried out in the US equates the amount of pollution generated from urban areas as being of similar order as the raw sewage contribution.
Major sources of urban nonpoint source pollutioninclude: accumulation of street rubbish, hydrocarbons, vehicle deposits, animal faecal wastes, and atmospheric fallout. Since nonpoint source contaminants by definition are diffuse in origin, revealing their sources becomes exceedingly complex. Previous research in this area has revealed that the origins of nonpoint source contaminants, and the contaminants themselves, have a wide spatial distribution, often linked to land-use (Novotny and Chesters, 1981; Thompson, 1983; Roesner and Robel, 1992; James and Whitman, 1995).
Identification of specific pollutant origins is necessary if effective management strategies are to be formulated to restrict nonpoint source pollution. Pollutant identification allows development and justification of mitigation strategies and leads to more effective abatement. Rence delineation and quantification of nonpoint source contaminants is one of the areas of environmental information that provides environmental managers with a better understanding of nonpoint source pollution problems.
New Zealanders agree that environmental protection is an urgent and immediate concern. This is reflected in the Ministry for the Environments (MfE) 'Environment 2010 Strategy' (1996(c)) in which the management of New Zealand's water resources and the management of pollution are recognised as two priority environmental issues. Webster and Gold (1989) listed damage to rivers, lakes and coastal waters as New Zealanders' third highest environmental concern. The extent of water quality problems associated with nonpoint source pollution found overseas (see above) may indicate what is in store for New Zealand if this form of pollution is ignored. Possible effects of nonpoint source pollution are eutrophication, loss of biodiversity, loss of potable water, health hazard, and loss of other beneficial water uses.
Introduction 3
value. Three waterways predominate in the urban environment (see Figure 1.1). These are the Avon-Heathcote estuary, the Avon River,and the Heathcote River. The Christchurch City Council (CCC) recognises issues involved in the contamination of stormwater run-off and anticipates enhancement of aquatic life through policies which serve to mitigate the effects of stormwater run-off and through control of land use activities. The CCC also recognises that these sources need to be identified to reduce the risk of further contamination (CCC, 1995).
Cotctvnent Bouncky -
---Scole I: a5CO.J
CHRISTCHURCH
Figure 1.1. Christchurch urban waterways location map.
Pacific Ocecn
Introduction 4
main contributors to nonpoint source pollution (Roesner and Hobel, 1992; Prey, 1994; Novotny and Chesters, 1983).
The approach usually taken in recent stormwater quality control programmes, once stormwater pollution is identified, is to treat stormwater through engineered treatment works such as stormwater treatment ponds. While this approach can significantly reduce the impact of contaminants in the system it is not clear whether such controls are adequately alleviating surface water contamination. Such interception measures in stormwater management fail to deal directly with contaminant origins, that is, those sources in the urban environment directly responsible for nonpoint source contamination.
Nonpoint source pollution is evident in Christchurch urban waterways but it is an issue not adequately addressed by current management strategies. To be able to implement policies that reduce or control the contaminants generated from the sources of nonpoint source pollution, firstly requires sound information on those sources, the quanities produced from them, and their effects on waterway ecology. To be of further use to pollution abatement planning, information gathered on nonpoint source pollution should be in-line with waterway management objectives.
By exploring the existing historical, biological and physico-chemical data on Christchurch urban waterways this thesis will attempt to identify the key nonpoint source contributors to waterway degradation. Once this is achieved, this information will help to delineate a broader scope of planning tools to help alleviate or identify nonpoint source surface water pollution.
Thus this thesis through identification and quantification of urban nonpoint source pollution in the Christchurch urban environment outlines the information considerations necessary to initiate targeted pollution abatement options.
1.2 AIMS AND OBJECTIVES
Introduction 5
abatement. Greater delineation and quantification of the origins of urban nonpoint source contaminants may initiate more targeted preventative pollution control options. Consequently, providing waterway managers with comprehensive environmental information on nonpoint source issues enlarges the scope of nonpoint source pollution abatement strategies. Information such as provided by this investigation may provide the justification society needs to take the initiative and eliminate contaminants before they arrive in waterways. The aim of this investigation is:
To review and quantify the origins of key nonpoint source contaminants of concern in Christchurch waterways, and to establish a framework for incorporating nonpoint source pollution issues into waterway management.
The following specific objectives will need to be addressed:
1. Review existing research and information on Christchurch waterways, to ascertain which key contaminants are, or are likely to be a pollution concern.
2. Develop an inventory of sources of key nonpoint contaminants and estimate the relative contribution of these sources to the contamination of Christchurch waterways, i.e. from readily identified origins, quantify key contaminants from impermeable surfaces (primarily corrosive and less durable building materials), transport (vehicle emissions and general vehicle wear) and other miscellaneous sources.
3. Investigate integrating information considerations identified through a Christchurch case study into water management and planning, with a view to providing a greater range of nonpoint source pollution abatement options.
1.3 OVERVIEW OF THESIS
Introduction 6
associations between nonpoint source contaminants and degradation of the aquatic environment in Chapter 2.
Chapter 3 examines these issues in the context of the Christchurch urban environment. The Christchurch case study provides a focus by which the issues surrounding water quality protection can be illustrated in a New Zealand context. It also identifies contaminants of concern to water quality in Christchurch, the initial step in outlining waterway impainnent and contaminant abatement.
Chapter 4 provides a more intense focus on nonpoint contaminants of concern in urban Christchurch's urban aquatic environment. It does this by way of a prioritisation mechanism which couples community perspectives with contaminant exposures to provide an impact ranking for contaminants.
In Chapter 5 sources of a priority contaminant are assessed. An inventory of sources emitting the contaminant is established and the contribution of each source is quantified.
Chapter 6 draws on the previous chapters to outline a range of infonnation generation and management processes that can be adopted to define and assess nonpoint source water pollution. These are discussed with respect to their incorporation into the decision-making process.
Literature Review 7
2. LITERATURE REVIEW: RELATIONSHIP BETWEEN URBAN
AQUATIC DEGRADATION AND NONPOINT SOURCE
CONTAMINATION
2.1 INTRODUCTION
Previous studies have tried to gain a better understanding of the contents of urban runoff and its impacts on receiving waters (Sartor and Boyd, 1975; Whipple, Berger, Gates, Ragan and Randall, 1975; Pitt, Field, Lalor and Brown, 1995). Such studies have examined complex interactions of physical, chemical and biological systems (Figure 2.1). Two of the largest studies have occurred. in North America. One focused on agriculturally and urban derived contamination in the Great Lakes Region of North America (Novotny and Chesters, 1981) and the other on urban runoff in US cities (USEPA, 1993).
POINT SOURCES: NONPOINT SOURCES: Industry Discharge Runoff
•
Vehicles•
Sewage Stormdrains
•
Roads•
Dredging Waterways
•
Faeces•
Rural Rivers
•
Aeolian•
Construction Lakes
•
Aquatic fowl•
Aquifers
Transport Downstream
.
Discharge Estuarine processes: ESTUARY Runoff
•
Sedimentation•
Bioturbation & burial•
Flushing•
Mobilisation &dispersal
•
Decomposition•
Bioaccumulation•
Biomagnificationt
SEA
Literature Review 8
The investigation into pollution of the Great Lakes in the early 1970s found detrimental effects from nonpoint sources. Contaminants found to be adversely effecting the lakes were phosphorus, sediments, industrial and agricultural organics, and some heavy metals (Marsalek, 1990).
Between 1978 and 1983 the US Environmental Protection Agency (USEPA; 1983) funded an investigation into urban nonpoint source pollution of waterways. Called the National Urban Runoff Program (NURP) it covered 28 cities and consistently found several contaminants in urban runoff. The most prevalent contaminants found were heavy metals, especially copper, lead, and zinc. Less commonly detected heavy metals were arsenic, cadmium, chromium and nickel. Other contaminants found included 63 organics, high levels of coliform bacteria, nutrients, oxygen demanding substances (oil, grease, organic matter), and suspended solids.
To understand the connections between nonpoint source contaminants and the aquatic environment requires the exploration of the physical, chemical and biological parameters and processes that combine to support healthy ecosystems. Establishing how contaminants collectively or singularly act to degrade these systems is of particular relevance if the possible mitigation measures of this form of pollution are to be adequately addressed and justified in the public arena.
2.2 ASSESSING QUALITY OF URBAN WATERWAYS
2.2.1 Urbanisation Effects
Generally, urbanisation leads to alteration of the landscape and morphology of the drainage network. Changes to the drainage system can result in ecosystem stress or loss. Alterations can include changes to flow regimes, altered organic contributions, disease, competition, addition of introduced species, alteration of biotic interactions (Karr, 1992). The extent of the change will depend on the type, size, and designated beneficial use of the waterway. The aquatic ecosystem will reflect these changes.
Literature Review 9
Measuring or assessing these alterations can be relatively straightforward (e.g. measure water temperature, flow rates). However, establishing the factors responsible for observed deterioration of the aquatic environment is not easy.
Physical alteration of a catchment by human development changes the amounts of chemicals and nutrients delivered to the aquatic environment. A variety of contaminants produced from anthropogenic actions will be added to background chemicals and nutrients.
These transformations may make it difficult to ascertain a waterway's characteristic biological, chemical and physical state. Urbanisation makes it difficult to define what an aquatic ecosystem should consist of, its 'natural state'. The natural state of New Zealand's waterways could be defined as pre-European or perhaps pre-Maori impact. More realistically an assessment could be based on the chemical, physical and biological components needed to sustain a healthy aquatic environment.
To do this it is first important to establish what defines 'environmental health' or 'environmental quality' in a waterway. This will support a clearer concept of the requirements of the aquatic environment. It will also assist defining and measuring goals andlor objectives regarding the well-being of the aquatic environment, and the policies or mandates recommended to achieve these goals (Chapter 6).
2.2.2 Environmental Health
All New Zealand ecosystems are now recognised for their intrinsic values and native components by the Resource Management Act 1991 (RMA). This legislation has developed from the reckoning that the integrity of the biosphere is dependant on ecosystem sustainability (Wilson and Harris, 1991). Hence environmental health should be considered the central component when striving towards ecosystem sustainability.
Literature Review 10
designed to protect ecosystems while social and/or cultural wellbeing through economic productivity protects society. The task of resource managers, future and present, is to find the balance between these two poles in the interests of ecosystem health. If ecosystem protection is ignored for too long in favour of societal resource use there exists a danger of ecosystem and species destruction.
To distinguish or define an ecosystem as healthy or impoverished requires a definition that recognises the dynamic nature of ecosystems, moulded by natural and anthropogenic processes. Haskell et al. (1992) provides such an operational definition:
An ecological system is healthy and free of "distress syndrome"
if
it is stable and sustainable - that is,if
it is active and maintains its organisation and autonomy over time and is resilient to stress. "Distress syndrome" concerns irreversible system collapse.Thus, a biological system can be considered healthy when its innate potential is realised, minimal management input takes place, it has a stable condition, and has capacity for se1f-repair from stochastic disastrous events (Karr, 1992). Karr suggests to assess biological integrity a number of criteria encompassing the elements and processes of biological systems be used. In this sense the biological integrity of waterways would be maintained by the sum of chemical, physical, and biological components.
Defining the nature or extent of environmental degradation is hampered by the lack of attributes to measure biological conditions (Karr, 1992) and the paucity of knowledge on ecological· systems. Thus, defining water quality has often relied on the use of physico-chemical indicators.
Literature Review 11
2.2.3 Water Quality Assessment Tools Used In Aquatic Ecosystem Protection
Verifying the condition of an ecosystem depends upon the combination and quality of infonnation provided by measuring environmental parameters (biological, chemical and physical).
Most water quality tools suffer from numerous problems making their selection a complex task. Lack of understanding about which qualities of the environment are important can lead to problems in selection of water quality tools.
Two approaches can be used to ascertain a waterway's environmental quality:
1. comparison of measured physico-chemical parameters with physico-chemical water quality criteria or standards. (e.g. pH, heavy metals); and/or
2. assessment of parts of an ecosystem's biological composition and/or comparison with previous assessments or other locations.
Criteria or standards are usually developed from scientific experiments or based on scientific principles. For example, toxicity tests use bioassay procedures to test organisms under controlled conditions to ascertain a relevant endpoint, such as mortality, reduced fertilisation or growth. They provide a reference point to which a measured quantity can be set against. Hvitved and Jacobsen (1986; cited House et al., 1993) provide the following definition of criteria:
A water quality criterion represents ideally a concentration of a substance which results in a certain degree of environmental effect upon which scientific judgement may be based. For practical purposes a criterion means a designated concentration of a substance that, when not exceeded, will protect an organism, a community or a prescribed water use or quality with an adequate degree of safety.
Literature Review 12
• an element, or group of elements, which furnish indirect information concerning the state of an ecosystem and its evolution. For example, the energy balance of a system is an indicator;
• a variable used to identify the presence or condition of a phenomenon that cannot be measured directly;
• a measure of the welfare of the system under study.
Standards are fonned when criteria are adopted by a regulatory agency as policies or rules. Another fonn of standard recently introduced into New Zealand environmental refonn is 'environmental bottom lines'. The MfE (1994) defines these as:
the thresholds below which ecological systems suffer irreversible damage, for example the reduction of water flows in a river to such a level that river ecosystems will not fully recover. It is also recognised that such thresholds are difficult to scientifically ascertain.
Environmental bottom lines have a similar use to other environmental criteria, but can undertake a wider role in policy implementation or evaluation. In defining objectives or goals, 'environmental bottom lines' can outline the "boundaries or limits beyond which there is a high risk that the quality of the environment will be unacceptably degraded" (Brash, 1992).
Indices or index numbers refer to a condensed measure of several quantities or qualities related to an ecosystem. Numerical values delineated by an index can then be used to detennine the trends and nonns in ecosystem functioning. Indices may indicate a change in circumstances such as changes in species assemblage. Environmental indices have been used to monitor aspects of environmental quality ranging from water pollution to amenity aesthetics. One example used in New Zealand is the macroinvertebrate community index (MCI) developed by Stark (CCC, 1992). The MCI system involves allocating scores to taxa, with pollution-intolerant taxa gaining higher scores than pollution-intolerant taxa.
Literature Review 13
3). This may help to establish the extent of pollution and may build a picture of the causes and effects of waterway degradation. For example, data from 5 cities in the USA found urban streams to be grossly polluted by sediments and toxicants. In that study such conclusions could not have been reached without a combination of chemical analyses and biological analyses (e.g. biotic indexes) (Pitt et al., 1995).
2.3 PROBLEMS IN ASSOCIATING NONPOINT SOURCE CONTAMINANTS WITH AQUATIC DEGRADATION
Establishing causal links between environmental data (e.g. pH, dissolved oxygen, diversity indices) and contaminants is an important step in ascertaining if, and what, urban nonpoint source contaminants are responsible for aquatic degradation.
Numerous studies have implicated urban runoff as a probable cause of degradation in the aquatic environment (Bradford, 1972; Baffor, Boyd and Agardy, 1974; Laxen and Harrison, 1977; Novotny and Chesters, 1981; EPA, 1983; Novotny et al., 1985; Stotz, 1990; Linforth, Vorreiter, Constandopolous and Beddeph, 1994; Pitt et al., 1995).
However, these studies rarely provide direct evidence of a link between nonpoint source pollutants and deleterious effects to the aquatic ecosystem.
Linforth et al. (1994) in an investigation of sources and effects of major pollutants in Sydney stormwater fail to connect contaminants (faecal coliforms and nutrients) measured in stormwater with any deleterious effects on the aquatic environment. Consequently, elevated levels of contaminants measured in stormwater or the receiving environment may be deemed pollutants while they may have little of no adverse impact on the aquatic environment. Basing nonpoint pollution controls on the assumption that elevated physico-chemical levels are of environmental concern can waste limited resources and erode public support for abatement. It can also lead to researching causes that are not related to the effects.
Literature Review 14
Lee and Jones-Lee (1993) have some sympathy with Karr's criticism, based on the few documented cases of toxicants causing impainnent of beneficial uses of water. They argue that toxic materials (e.g. heavy metals,synthetic organics) actually rarely cause impainnent of the beneficial use of waterways. However, some authors have found urban stonnwater to have a strong heavy metal component.
Heavy metals within the urban environment predominantly stem from anthropogenic activities (apart from background concentrations), many of these being diffuse in nature. Unlike pervious areas no infiltration capacity is required to initiate runoff and thus small rainfall events can result in highly concentrated loads charged with a variety of heavy metals. Although other contaminants are present in runoff from impervious areas heavy metals are often the dominant contaminant in urban impervious runoff.
Several overseas studies have gauged heavy metal concentrations from nonpoint sources. The USEPA (1984; cited Wanielista and Yousef, 1995, p160) found that 57% oflead, 41 % of copper and 70% of zinc were derived from nonpoint sources. Bannennann et al. (1993)
and Prey (1994) collected rainfall runoff samples from various surfaces. Streets, parking lots and roofs were found to be critical source areas for heavy metals.
In the United States, where Lee and Jones-Lee operate, the emphasis of investigations on toxic or carcinogenic contaminants, namely heavy metals, may be a result of the National Pollution Discharge Elimination System (NPDES) program's push for contaminant reductions within limited time periods. This can force pennit holders in the NPDES program to eliminate or reduce contaminants that may not have any adverse effects on the beneficial use of waterways at a huge cost.
Literature Review 15
Pitt, Field, Lalor and Brown (1995) found that stonnwater contaminants can lead to water quality problems, although they do concede that acute toxicity effects in the water column are uncommon. More likely is that urban receiving waters are impaired by contaminants over an extended time, predominantly from contaminated sediment.
Why is it that stonnwater toxicants in the short tenn do not often cause beneficial use impainnents even though water quality criteria are not met? One of the problems in attempting to answer this question arises from the complexities associated with aquatic chemistry and aquatic toxicology. Potentially toxic or carcinogenic contaminants persist in several different fonns or states. These fonns are either toxic (available) or non-toxic (unavailable) to the aquatic ecosystem. Most authors agree that when the chemical fonn is associated with particulate material contaminants are generally less toxic. When associated with particulate or organic material the contaminant has to exert its effect through digestion of the sediment (Williamson, 1993).
Although contaminants coupled with particulate matter may initially be non-toxic, they may represent a future threat to the aquatic ecosystem as physical and chemical conditions change. Particulate contaminant fonns can be introduced to the benthos environment through binding to sediment and organic matter, which settles on the waterway bed, or by hydraulic and gravitational forces. Once sediments are infiltrated by contaminants they can pose a significant ecological threat. The structure and health of the benthic and other aquatic communities can be impaired through resuspension of contaminants which may then exist in a more available fonn (US EPA, 1996).
Lee and Jones-Lee (1993) point out that while water quality numeric criteria are often exceeded, water quality criteria are usually based on total concentration of the representative contaminant. Hence, Lee and Jones-Lee (1994) find that structural stonnwater control devices are being considered based on a "laundry list of chemical concentrations." Water quality is being judged on single numerical criteria that gives no actual data on the fluctuations, fonns and intensities of contaminants.
Literature Review 16
different than in-situ waterway situations where contaminants exposure, duration and availability can fluctuate dependant on event intensity, fonn of contaminant, pH, temperature, or water hardness, rendering a significant proportion of the contaminant unavailable.
One general assumption is that organisms can be exposed to higher concentrations of contaminants without detrimental consequences when exposure is of a shorter duration (Lee and Jones-Lee, 1994). Even highly toxic fonns may be available for a brief period without detrimental effects.
This is dependant on the dilution effects and 'assimilative capacity' (see below) of the water body and organisms. The contaminant's environmental distribution and ecosystem availability will be detennined by the physico-chemical fonn of the contaminant. Dilution will also affect the impact of the contaminant on the water body (Laxen and Harrison, 1977). However, only small amounts of contaminant are needed to affect function, efficiency and composition of organisms at the lowest trophic level. Novotny and Chesters (1981, p27) cite an example of heavy metals in trace measures effecting algal species resulting in disruption ofthe food web.
Evidence is compounding on intennittent contaminations having deleterious effects on aquatic organisms (House et al., 1993). Such effects are not usually encountered in standard laboratory tests and can range from delayed mortality numbers to reduced respiration productivity (as noted in the freshwater shrimp example above).
Literature Review 17
High concentration effects, dilution and acclimatisation in urban discharge have been noted in a study by Adams and Pratt (1983). Immediately downstream from a discharge point macroinvertebrates have been limited and heavy metal sediment concentrations are high. With increasing distance downstream species increase, the habitat becomes more diverse, and aquatic macrophytes and heavy metal sediment contamination declines.
The use of organisms that better reflect the total mixture of contaminants and/or physical changes in the aquatic environment can better facilitate toxicity testing. Ecotoxicological studies often utilise benthic macroinvertebrates in a role of environmental response organIsm.
Segar and Milne's (1990, cited House et al., 1993) study of an in-situ test is a good example of stormwater runoff impairing beneficial use of a waterway, with a cause and effect isolated in the study. Segar and Milne assessed stormwater toxicity using freshwater shrimp, Gammarus pulex. Acute effects increased 42% after a series of runoff events compared to freshwater shrimp in water unaffected by urban runoff.
This examination of the problems of using physico-chemical parameters to implicate stormwater runoff as a cause of waterway degradation highlights the difficulties water managers must face in protecting aquatic ecosystems.
Studies of urban runoff and urban receiving waters have tried to correlate urbanisation andlor land use with degradation of urban receiving waters. While heavy industrial areas and construction activities are often related to adverse effects in the aquatic environment, no consistent pattern concerning nonpoint contaminants emerges. To adequately assess contaminant contributions from an origin or source area to water pollution can only be of direct relevance to one specific locality.
2.4 CONCLUSION
Literature Review 18
Detennining the detrimental effects of nonpoint source contaminants on aquatic ecological health may be achieved by assessing biological criteria or with physico-chemical water quality guidelines. However, both biological and physico-chemical methods of assessment have constraints and uncertainties. Hence a combination of analyses (chemical and biological) may help ascertain if nonpoint source contaminants are a threat to aquatic ecosystem health.
With respect to contaminant input, a surface waterbody's response to contaminant input will be 'site specific'. The response will be dependant on the nature and strength of contaminants, the ecosystem constitution, meteorological conditions, the physico-chemical state of the water body, and the type of water body and the physical mechanisms at work within that body.
Justifijing Nonpoint Source Contaminant Abatement in Christchurch Urban Watenvays 19
3. JUSTIFYING NONPOINT SOURCE CONTAMINANT
ABATEMENT IN CHRISTCHURCH URBAN WATERWAYS
3.1 INTRODUCTION
This chapter examines whether degradation is occurring in Christchurch urban waterways, and if so, whether nonpoint source contaminants are contributing to degradation. To determine the impacts nonpoint source pollutants may be having on waterway ecology three waterbodies in the Christchurch urban region are examined. Environmental quality data, biological surveys, monitoring information, and historical reports form the basis of a quantitative and qualitative assessment of the aquatic environment. Waterbodies reviewed are the Heathcote and Avon Rivers, and the Avon-Heathcote Estuary.
An understanding of the historical and present environmental health of Christchurch urban waterways will help determine to what extent degradation is occurring. This chapter also examines the correlation between contaminants and degradation to ascertain if there are any causal relationships. Finding the relationship between waterway impairment and nonpoint source contaminants would provide justification for abating nonpoint source contaminants.
For greater detail on biological and chemical components of Christchurch water quality refer to Appendix 2.
3.2 HISTORICAL REVIEW
Justifying Nonpoi.nt Source Contaminant Abatement in Christchurch Urban Watenvays 20
Historical information may also reveal the· quality of the· aquatic environment that may be achieved if maintenance and enhancement of the aquatic environment is maintained and improved.
3.2.1 Avon and Heathcote Rivers
Recorded history of the Avon has been traced back to 1847 by Lamb (1981). Edward Ward's diary captured the quality of the River around that period:
The water was cool and clear as crystal - most delicious to taste. I never enjoyed bathing so much, for I think I never had been so weary, hot and thirsty.
The first pollution scare occurred when Christchurch Hospital was found to be emptying its wastes into the river. This prompted a review of Christchurch water supplies by the city surveyor. It was recommended that the Avon not be used for water supply purposes as it was "impregnated with vegetable matter." By 1866 Christchurch had artesian water to drink and dumping wastes into the Avon was recommended practice. Continued discharge of domestic slops and sewage was practiced into the 1920s.
Water tested in 1877 was reported as "pure and wholesome" (Lamb, 1981), the inference being waste could be continually discharged into the river unabated and without deleterious effects.
A survey of the river in 1887 found only occasional places free from siltation, revealing that most of the river bottom was covered in mud from 1 to 4 feet thick. Pooling precipitation was seen to drain within half an hour of falling due to efficient Christchurch drainage, taking with it large amounts of solid matter. Urbanisation was seen as the cause of increased sediment runoff.
JustifiJing Nonpoint Source Contaminant Abatement in Christchurch Urban Watenvays 21
(1929; in Lamb 1981) also reports on the Acclimatisation Society trout releases, his dissection work revealing the stomach contents of trout to be mostly caddis larvae.
By 1955 trout sizes and takes were greatly reduced. Some observers equated this with disappearances of aquatic larvae, primarily larvae of the caddis fly. Changes in riparian vegetation that provided food and shelter for the caddis fly are blamed for the reduction. Also observed was a layer of silt instead of gravel composing the river beds, decreasing the growth of a film of plant material such as a caddis fly would utilise.
The Fish and Game Council (previously the Acclimatisation Society) have more recently released salmonoids into the Avon and Heathcote Rivers. The release of catchable trout in 1977 was followed by the release of chinook salmon in 1980 as a publicity stunt in light of Dunedin's salmon success (pers comm. Bruce Ross, Fish and Game Council). No establishment ofthese fish has been recorded. In the late 1980s trout ova were released into the Wirarapa tributary.
Watkins' (1989) history of the Heathcote County Council attests to a similar history for the Heathcote River. The environment changed from the more familiar flax lined banks to watercress which clogged the river, possibly fuelled by nutrients from human and animal excrement.
Effluent discharged by Christchurch City via the Ferry Road Drain added to the problem. The problem was notified in 1914, but it took to 1932 to connect the Heathcote suburbs to the Christchurch sewage system.
Industries located close to the estuary produced soap, candles and performed lime-burning, woolscouring, meat processing, tanning, and fat-rendering. Industrial pollution was tolerated until 1911 by local authorities, although frowned upon by ratepayers. In 1917 the Christchurch Drainage Board secured an injunction to prevent further discharges into the nver.
Justifijing Nonpoint Source Contaminant Abatement in Christchurch Urban Watenvays 22
with the most notable period of deterioration occurring from 1956 to 1968 (Watkins, 1989).
3.2.2 Avon-Heathcote Estuary
When Europeans first started settling the Christchurch region they found a broad wetland pitted with shallow lakes, traversed by the meandering Avon and Heathcote Rivers.
The vegetation around the margin of the estuary was removed and the area landscaped to accommodate residential dwellings (CCC, 1992(c)). This change, along with the city effluent and silt pouring from the rivers, marked a period of transition in the estuary.
Formed from sand dunes in 1883, the Bromley sewage farm filtered sewage through sand before discharging it into the estuary. From 1880 to 1925 industrial pollution was another addition to the estuary via discharge into the rivers. Contaminants included arsenic, copper, chromium, iron, lead, nickel, zinc, acids, alkalies, tars, oils, and sulphur compounds. Some areas were reported to have been so polluted that all vegetation was decimated. Sediment cores identify these periods of severe pollution and attest to the large amounts of silt pushed down the rivers, encouraged by river sweeping (CCC, 1992(b)).
Bromley had a two stage treatment system in 1962. By 1970 almost all industrial effluent and sewage was being treated at Bromley, but it was not until 1981 that effluent containing phenols, tars, and oils from the Gas Works ceased to be discharged into the estuary (CCC, 1992(c)).
The influence to flora and fauna in the estuary is best documented through the reduction in eel grass (Zostera nera) and the shrimps and fish that utilised it. Increasing mud and silt swamped the grasses providing a substrate only suitable for burrowing organisms and algae. Mud and silt contributed to the rapid demise of eel grass and the loss of a vital niche.
JustifiJing Nonpoint Source Contaminant Abatement in Christchurch Urban Waterways 23
An influx of nutrients from the Bromley sewage fann was marked by growth of the microorganism, Euglena. Several studies report the distribution of this single cell organism (Thompson, 1929, Bruce; 1953; Knox and Kilner, 1973) that thrives on decomposing wastes, reducing oxygen levels often producing hydrogen sulphide. Increased sewage effluent also produced other algal blooms such as sea lettuce and Enteromorpha.
Bruce's (1953) study on pollution in the estuary observed that fauna were more abundant with increasing distance from the effluent source (Bromley sewage farm). All the fauna that were observed by Thompson (1929, in Bruce, 1953) are still represented in the estuary including an increase in bird life associated with the increased productivity in the estuary.
Sediments have been polluted from previous periods of unrestricted industrialisation. Sediment quality has been experiencing a period of recovery since most industrial effluents were removed from the rivers and estuary in 1972 (CCC, 1992(c)).
3.2.3 Summary of Findings of Historical Review
Several conclusions on the present state of the Avon and Heathcote Rivers' health and nonpoint source contaminants' role in this may be deciphered from a historical review:
• decades of pollution from point and nonpoint sources have altered the ecology of the rivers and estuary;
• the effects of changing land uses have altered the ecology and geomorphology of the rivers and estuary;
• silt is a nonpoint source contaminant that has historically taken its toll on the river ecology and could have similar implications in the present aquatic environment (e.g. impacts on benthic invertebrates and trout);
• excessive silt build-up in parts of the Avon and Heathcote Rivers may reflect past conditions rather than present silt input;
• excess sediment has degraded estuarine ecology, probably as a result of river sediment and colloidal material from the sewage works;
JustifiJing Nonpoint Source Contaminant Abatement in Christchurch Urban Waterways 24
• Avon and Heathcote River water quality was acceptable for drinking and bathing, a quality that may present an aim for future waterway management.
3.3 BIOLOGICAL ASSESSMENT
Proper management requires understanding of pattern and processes in biological systems and development of assessment and evaluation procedures that assure protection of biological resources. That assessment must include biological monitoring. This can often be controversial in water resources management.
Karr,1986.
3.3.1 Method of Review of Biological Information
This section reviews available biological information to reveal occurrences of waterway degradation based on the state of ecosystem health. Ecosystem health is assessed on integrity of individual organisms (e.g. growth rate) and/or changes in population assemblages (diversity or composition).
The previous chapter (Section 2.2) elucidates the aspects that comprise a healthy ecosystem and tools used to assess this. These tools and further analyses are used in an attempt to establish the state of the aquatic habitats and assess if these habitats contain organisms capable of maintaining a balanced, integrated and adaptive community structure and function (Karr, 1986). This may also help reveal what causes changes to the integrity of aquatic ecosystems.
3.3.2 Freshwater Biological Impacts
3.3.2.1 Invertebrates and Periphyton
JustifiJing Nonpoint Source Contaminant Abatement in Christchurch Urban Watenvays 25
The application of Stark's macroinvertebrate community index (MCI) to the 1980 and 1989-91 invertebrate surveys found a general decrease in scores possibly indicating a change to more pollution tolerant species (Appendix 2). Invertebrates indicative of moderate to fast flowing waters and low sedimentation appear to be succeeded by invertebrates more tolerant of pollution, and characteristic of slower waters and increased sedimentation (CCC, 1992(b), 1994(a); Suren, 1993). Reduced flow has been observed for the Avon River CCC (1992(b» between the 1980 and the 1989-91 surveys, but there is little evidence to suggest sedimentation has increased.
Increased siltation is often a· feature of slower moving waters providing a habitat suitable for burrowing organisms such as molluscs and oligochaetes. These organisms are found to dominate in many areas of the Avon and Heathcote Rivers.
An increase in the number of taxa was observed from 1980 to 1989-91 in the Avon and Heathcote Rivers. A proportion of this increase has been attributed to differing sampling techniques and better taxa identification (CCC (1992(a», although some of the increases and changes in taxa suggest that riverine conditions have also changed. One of the most noted biological changes is an increase in filamentous algae throughout the A von-Heathcote catchment (CCC (1992(a».
The expansion in filamentous algae chronologically parallels changes in the invertebrate composition. This periphyton provides a niche for several new taxa while possibly smothering the substrate vital to other taxa. Filamentous algae usually proliferate due to increased available nutrients introduced into the waterways and changes in river hydrology. Thus, increased invertebrate diversity and periphyton could be a result of elevated river nutrient levels increasing food availability (e.g. periphyton).
JustifiJing Nonpoint Source Contaminant Abatement in Christchurch Urban Watenvays 26
Reaches with severe contamination also experience reductions in invertebrate diversity. These are noticeably pronounced in industrial areas (e.g. Haytons Drain) and downstream of certain stormwater outlets (e.g. Mackenzie Avenue).
3.3.2.2 Synthesis -Invertebrates and Periphyton
Measures of invertebrate diversity and composition assessed in the biological evaluation of the Avon-Heathcote catchment may be useful in determining the relative health in isolated reaches of the rivers. However, to relate these assessments to pollution indices, such as the macroinvertebrate composition index (MCI) , indices need to be representative of the invertebrate compositions and habitats found in the Christchurch urban waters (pers comm. Jonet Ward). MCI scores may be useful for relating the catchment wide health of the ecosystem, but are less useful for determining reaches of moderate to light chemical contamination.
In summary, while changes in macro invertebrates and periphyton indicate degradation to be occurring in several reaches of the Avon and Heathcote Rivers, the cause(s) of impairment remain unclear. The most likely explanation is degradation is the result of a combination of factors. These include reduced baseflow, increased siltation, increased nutrients, chronic effects of contaminants, and excessive periphyton growth.
3.3.2.3 Fish
Possibly a better indicator of the overall aquatic ecosystem health and areas of moderate to light chemical contamination are fish. Fish according to Karr (1986) are excellent indicators of biological change due to their sensitivity to a wide range of environmental conditions. The reasons for monitoring fish can include, for example:
• functional attributes (debilitated growth and reproduction) and species composition (acute toxicity) can be rapidly assessed,
• fish are usually present in most streams, the exceptions being those severely polluted, • macroenvironmental effects dominate, not the microenvironmental influences that can
affect algae and invertebrates,
Justifijing Nonpoint Source Contaminant Abatement in Christchurch Urban Waterways 27
Abundance of the trout occupying the headwater tributaries was greater than main-stem counterparts in one study (Ministry of Agriculture and Fisheries (MAF), 1992; Figure 3.1). This may be due to urbanisation effects, for example, increased peak flows and elevated contaminant levels in the headwaters. Stunted trout growth also was found in the headwaters of the Avon River (MAF, 1992), the dominant habitat of trout during the 1991-92 MAF survey (Appendix 2). There may be several reasons for this. For example, Hellawell (1986, pS8) found in several studies that the growth and longevity of trout is dependant on water quality. Therefore the Avon River brown trout populations might indicate that the chemical constitution of the waters of some reaches is of substandard quality.
E o o
...
~ III
..c: I!! .!!! III
II. "C '0
!
~;
1/1 r::::
III
C
Total Density of Fish and Trout, Avon River 1992
--+-Total Density --II-Trout
120 ,-________________________________________ -, 100 80 60 40 20 Headwaters
o
+-+-+-+-~~~~~~~~~~~~~~~L+ __ ~C\I ....
Distance upstream from Pleasant Point (kms)
Figure 3.1. Comparison of trout densities to total fish densities for the Avon River. Data from MAF, 1992.
In nutrient rich waters with moderate hardness, trout growth would be expected to be rapid with an average lifespan of approximately 6 years (Hellawell, 1986, pS9). Since the river waters are not lacking in nutrients it is likely that other contaminants, such as heavy metals, may be limiting trout growth.
Diet may also be a factor in slowed trout growth. Changes in the benthic community can mean alternative food sources must be sought. As discussed in Section 3.3.2.1, changes in benthic community may be caused by increases in sediment and possibly other contaminants.
Justifijing Nonpoint Source Contaminant Abatement in Christchurch Urban Watenvays 28
urbanisation affects trout populations. Therefore in this study trout densities are used in an attempt to assess the impact of urbanisation on water quality. For each sub catchment included in a trout survey (MAF, 1992), the percentage impervious area was calculated based on impervious area data from Elliott (1996). Percentage impervious area is plotted against total density of trout in Figure 3.2. Several of reaches with high and zero trout densities indicated in Figure 3.1 are not included in Figure 3.2. This is because alternative fishing methods were used to count fish populations or the presence of a weir makes it unlikely that there will be any trout present in these reaches.
Percent Impervious Area vs Brown Trout Density
30.-______________________________________________ ~
:; - 25 o ca ... I!! I- ca 20
'O"g ~
tl
15~ ~ ~
E
10- 0
J! o _ ~ 5 I-~
• •
•
•
•
•
•
O+---r---~---~·~~---_+---~*~
10 20 30 40 50 60
% Impervious Area
Figure 3.2. Total density of trout (per 100 m2 wetted area) vs impervious area, Avon River 1992. Trout density data from MAF, 1992.
A negative correlation between impervious areas and trout density is apparent in Figure 3.2. This suggests that trout densities decrease with increased impervious area.
Similar trends were found by Klein (1975) using fish diversity. Waterway degradation was found to occur from impervious areas greater than 15%, with severe reductions occurring when 30 to 70% of a watershed was covered by impervious surfaces.