R E S E A R C H A R T I C L E
Open Access
Differences in perinatal and infant mortality
in high-income countries: artifacts of birth
registration or evidence of true differences?
Paromita Deb-Rinker
1*, Juan Andrés León
1, Nicolas L. Gilbert
1, Jocelyn Rouleau
1, Anne-Marie Nybo Andersen
2,
Ragnheiður I. Bjarnadóttir
3, Mika Gissler
4, Laust H. Mortensen
2, Rolv Skjærven
5, Stein Emil Vollset
5, Xun Zhang
6,
Prakesh S. Shah
7, Reg S. Sauve
8, Michael S. Kramer
6, K. S. Joseph
9and for the Canadian Perinatal Surveillance
System (Public Health Agency of Canada)
Abstract
Background:Variation in birth registration criteria may compromise international comparisons of fetal and infant mortality. We examined the effect of birth registration practices on fetal and infant mortality rates to determine whether observed differences in perinatal and infant mortality rates were artifacts of birth registration or reflected true differences in health status.
Methods:A retrospective population-based cohort study was done using data from Canada, United States, Denmark, Finland, Iceland, Norway, and Sweden from 1995–2005. Main outcome measures included live births by gestational age and birth weight; gestational age—and birth weight-specific stillbirth rates; neonatal, post-neonatal, and cause-specific infant mortality.
Results:Proportion of live births <22 weeks varied substantially: Sweden (not reported), Iceland (0.00 %), Finland (0.001 %), Denmark (0.01 %), Norway (0.02 %), Canada (0.07 %) and United States (0.08 %). At 22–23 weeks, neonatal mortality rates were highest in Canada (892.2 per 1000 live births), Denmark (879.3) and Iceland (1000.0), moderately high in the United States (724.1), Finland (794.3) and Norway (739.0) and low in Sweden (561.2). Stillbirth:live birth ratios at 22–23 weeks were significantly lower in the United States (79.2 stillbirths per 100 live births) and Finland (90.8) than in Canada (112.1), Iceland (176.2) and Norway (173.9). Crude neonatal mortality rates were 83 % higher in Canada and 96 % higher in the United States than Finland. Neonatal mortality rates among live births≥28 weeks were lower in Canada and United States compared with Finland. Post-neonatal mortality rates were higher in Canada and United States than in Nordic countries.
Conclusions:Live birth frequencies and stillbirth and neonatal mortality patterns at the borderline of viability are likely due to differences in birth registration practices, although true differences in maternal, fetal and infant health cannot be ruled out. This study emphasises the need for further standardisations, in order to enhance the relevance of international comparisons of infant mortality.
Keywords:Birth registration, Infant mortality, Gestational age, Birth weight, Stillbirths, Neonatal mortality
* Correspondence:[email protected]
1Maternal and Infant Health Section, Surveillance and Epidemiology Division,
Centre for Chronic Disease Prevention, Public Health Agency of Canada, 785 Carling Avenue, AL 6804A, Ottawa, Ontario K1A 0K9, Canada
Full list of author information is available at the end of the article
© 2015 Deb-Rinker et al.Open AccessThis article is distributed under the terms of the Creative Commons Attribution 4.0 International License (http://creativecommons.org/licenses/by/4.0/), which permits unrestricted use, distribution, and reproduction in any medium, provided you give appropriate credit to the original author(s) and the source, provide a link to the Creative Commons license, and indicate if changes were made. The Creative Commons Public Domain Dedication waiver (http://creativecommons.org/publicdomain/zero/1.0/) applies to the data made available in this article, unless otherwise stated. Deb-Rinkeret al. BMC Pediatrics (2015) 15:112
Background
The infant mortality rate is a key population health indica-tor and commands widespread public attention since it re-flects economic development, social equity, and health care services within a population [1]. It’s ready availability and importance as a health indicator makes the infant mortality rate a common tool for international comparisons of health status [2]. Several institutions like the United Nations
Children’s Fund (UNICEF) and the Organization for
Economic Cooperation and Development (OECD) use this and related indicators to rank countries annually [3, 4].
The popularity of the infant mortality indicator notwith-standing, international variations in birth registration laws and practices have the potential to bias comparisons of in-fant mortality. Problems can arise from differential registra-tion of live births and stillbirths, especially births occurring at the borderline of viability (e.g., gestational age <22 weeks or a birth weight <500 grams, who typically do not survive the neonatal period), and/or their classification as stillbirths versus live births [5]. It is important to ascertain if inter-national rankings by perinatal or infant mortality are af-fected by the above-mentioned biases, as such rankings often serve as the basis for evaluating national health care systems and for changing health policy. Although several
studies [6–8] have suggested that variations in birth
registration challenge international comparisons among high-income countries, the practice of annually ranking and comparing international infant mortality rates re-mains in vogue.
We examined variations in infant and fetal mortality rates based on birth registration practices at the border-line of viability, and the potentially differential classifica-tion of stillbirths and live births. We compared Canada and the United States to the Nordic countries because of the reported low levels of perinatal and infant mortality in the Nordic countries and their widely known em-phasis on egalitarian ideals [9], lesser social disparities [10], and high quality of perinatal care [11].
Methods
We used data for the period 1995 to 2005 from Canada, the United States and all five Nordic countries (Denmark, Finland, Iceland, Norway, and Sweden). We obtained reported counts of live births, stillbirths,
neo-natal deaths (0–27 days after birth) and post-neonatal
deaths (28–364 days) by gestational age (GA) and birth
weight (BW) from the vital registration systems or birth registries of each country. The gestational age cat-egories that we examined included <22, 22–23, 24–25, 26–
27, 28–31, 32–36, 37–41, ≥42 weeks and unknown
gesta-tional age, and birth weight categories included <500, 500–
749, 750–999, 1000–1499, 1500–1999, ≥2000 grams and
unknown birth weight. We also obtained reported counts of neonatal, post-neonatal, and infant deaths by cause of
death (congenital anomalies, immaturity-related and other causes). In addition, we collected and contrasted the rules and registration requirements for stillbirths and live births for each country.
We obtained birth cohort linked live birth-infant death and fetal death data files for Canada from the vital regis-tration files of Statistics Canada through an agreement between the Public Health Agency of Canada and Statistics Canada (which grants permission to the Agency to use this data). We excluded data from Ontario because of data quality concerns [12]. We obtained information from the United States from the birth cohort linked live birth-infant death data files and fetal death data files from the National Center for Health Statistics. Foreign
residents and infants born at <20 weeks’ gestation in
the United States were excluded from the study. We obtained Danish data from the Cause of Death Register and the Medical Birth Register of Denmark. The analyses were approved by the Danish Data Protection Agency. We obtained data for Finland from the Medical Birth Register of the National Institute for Health and Welfare (THL) and Cause-of-Death Register of Statistics Finland (no ap-proval was needed). We obtained data for Iceland from the Landspitali University Hospital and participation in the study was approved by the Icelandic Directorate of Health. We obtained data for Norway from the Medical Birth Registry of Norway (MBRN) and the Cause of Death Registry. The data delivery was authorized by Medisinsk fødselsregisterforskriften. Data from Sweden was based on information from the Medical Birth Register and the Cause of Death Register and restricted to live births >22 weeks and stillbirths >28 weeks. Analyses of individual data were performed at Karolinska Institutet and permission was granted by the Ethical Committee of Karolinska Institutet.
Gestational age in Canada was based on the best clinical estimate of pregnancy duration as reported on the birth registration [12], while in the United States it was based on the last menstrual period substituted by the best clinical es-timate of gestation (where available) if different from the
menstrual estimate [13–15]. In Denmark, gestational age
represented the clinical estimate made by the midwife at birth based on a combination of menstrual dates, menstrual cycle information and ultrasound scans (with approxi-mately 70 % of women having received an ultrasound scan at 18 weeks gestation). In Sweden, gestational age was based on a hierarchical assessment, with 95 % of values based on early second trimester ultrasound and the remader on menstrual dating or a pediatric assessment of the in-fant at birth [16]. Gestational age estimates in Finland, Iceland, and Norway were also based on a combination of information from menstrual, ultrasound and clinical dating. We calculated the reported proportion of live births at each gestational age and birth weight category, and neo-natal mortality rates by gestational age and birth weight.
Similar analyses were carried out for stillbirth and post-neonatal mortality rates. Gestational age—and birth weight-specific stillbirth:live birth ratios (stillbirths per 100 live births) were also calculated to assess any proclivity towards labeling live births as stillbirths near the threshold of viabil-ity. Other comparisons included contrasts of cause of infant death, perinatal mortality and feto-infant mortality.
For all contrasts of interest, we calculated mortality rate ratios and 95 % confidence intervals to determine the mag-nitude and statistical significance of observed differences. We used Finland as the reference group for these calcula-tions, as it had a reasonably large number of live births and mortality rates that were not outliers relative to other Nor-dic countries. We assessed the statistical significance of dif-ferences in rate ratios using 95 % confidence intervals and based on a test of heterogeneity of the odds ratios [17].The manuscript was prepared in line with the STROBE guide-lines (see Additional file 1: STROBE Checklist).
Results
Gestational age and birth weight criteria for the registration of live births and stillbirths differed internationally. Coun-tries such as Canada, the United States, Denmark, Finland, Iceland and Sweden required live birth registration for“any
product of conception that shows signs of life at birth,”
while Norway required registration of live births at a
gesta-tional age≥16 weeks. Canada, Finland and Iceland required
registration for stillbirths with a gestational age at delivery of≥20 weeks or a birth weight≥500 g; these criteria were ≥20 weeks or ≥350 g in the United States. The stillbirth
registration criterion for fetal deaths was ≥16 weeks in
Norway and ≥28 weeks in Sweden (until 2008), while
Denmark changed its criterion from ≥28 weeks to
≥22 weeks in 2004. Canada, Denmark, Iceland and Sweden required stillbirth registration following medical pregnancy termination if birth weight and gestational age criteria for
stillbirth were satisfied, whereas the United States, Finland and Norway required reporting of such cases as pregnancy terminations but not as stillbirths (Table 1).
The proportions of live births <22 and 22–23 weeks were significantly higher in Canada and (especially) the United States as compared with the Nordic countries (Table 2). Differences between Canada and the Nordic countries were less evident at 24–25, 26–27 and 28–31 weeks gestation
(with rates at 28–31 weeks being higher in Denmark and
Norway than in Canada), although rates in the United States remained higher than in the other countries. Sub-stantially higher proportions of live births with birth weights <500 g were reported in Canada and especially the United States compared with the Nordic countries. How-ever, this pattern of variation was not observed among live
births 750–999 g, 1000–1499 g and 1500–1999 g, with
Canada (but not the United States) having rates similar to the Nordic countries (Table 2). The Nordic countries had higher rates of post-term births (≥42 weeks) compared with Canada and the United States.
At 22–23 weeks gestation, Iceland had the highest
neo-natal mortality rate (1000.0 per 1000 live births); similar rates were observed in Canada and Denmark. Rates in Finland (794.3 per 1000 live births) were lower and similar
to rates in the United States and Norway, while Sweden’s
rates were significantly lower than in any other country (561.2 per 1000 live births, 95 % CI 506.2 to 615.1,
P <0.05). The mortality rate patterns were similar at 24–25 weeks between countries, but differed at later gestational
ages. At 37–41 weeks gestation, neonatal mortality rates
were lowest in Iceland, highest in Denmark and not signifi-cantly different among the other countries (Table 3). Pat-terns of birth weight-specific neonatal mortality were similar to those based on gestational age. Ratios of still-births to live still-births varied widely, with ratios in Canada lower than those in the United States, Finland and Norway
Table 1Gestational age and birth weight criteria for registration of live births and stillbirths among selected high-income countries, 1995–2005
Country Live birth Stillbirth Stillbirth registration
following termination of pregnancya
Canada Any signs of life regardless of gestational age or birth weight ≥20 weeks or≥500 g Yes
USA Any signs of life regardless of gestational age or birth weight ≥20 weeks and/or≥350 gb No
Denmark Any signs of life regardless of gestational age or birth weight ≥28 weeks till 2003 and≥22 weeks from 2004 Yes
Finland Any signs of life regardless of gestational age or birth weight ≥22 weeks or≥500 g No
Iceland Any signs of life regardless of gestational age or birth weight ≥22 weeks or≥500 g Yes
Norway ≥16 weeks ≥16 weeks Noc
Sweden Any signs of life regardless of gestational age or birth weighte ≥28 weeks Yes
a
If stillbirth definition is satisfied
b
A few states in the US report fetal deaths for all periods of gestation
c
In Norway, pregnancy terminations≥16 weeks were reported as stillbirths prior to 1999 and reported on a special form since 1999 Sweden did not report stillbirths <28 weeks until 2008
e
Data set provided by Swedish birth register only included live births from 154 days (22 completed weeks)
at <22 weeks and <500 g. However, the United States had significantly lower stillbirth ratios than Canada, Finland, Iceland and Norway in the other preterm gestational age categories and in other birth weight categories <1,500 g (Table 4). Exclusion of births <28 weeks attenuated but did not eliminate the differences between Canada and the United States versus Finland.
Contrasts of crude neonatal mortality rates in 2005
showed that Canadian rates were 83 % (95 % CI 71–96)
higher and U.S. rates were 96 % (95 % CI 93–99) higher
than those in Finland (Table 5). Denmark had a signifi-cantly higher neonatal mortality rate (rate ratio 1.55) than Finland, while Sweden had a significantly lower rate (rate ratio 0.67). When live births <22 weeks gestation and live births <24 weeks were excluded from calculations of neo-natal mortality, the differences between Canada and the United States versus Finland were substantially attenuated. Canadian neonatal mortality rates in 2005 among live
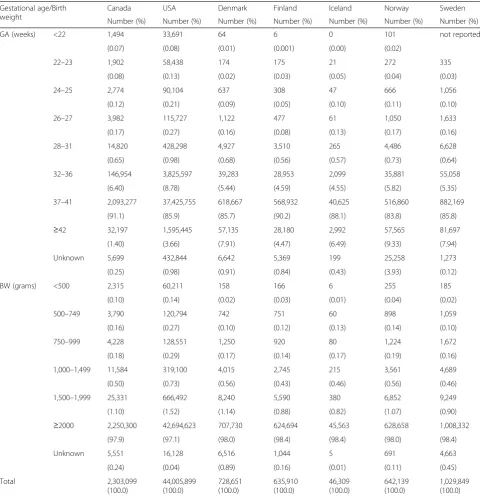
Table 2Distribution of live births by gestational age (GA) and birth weight (BW) among selected high-income countries, 1995–2005
Gestational age/Birth weight
Canada USA Denmark Finland Iceland Norway Sweden
Number (%) Number (%) Number (%) Number (%) Number (%) Number (%) Number (%)
GA (weeks) <22 1,494 33,691 64 6 0 101 not reported
(0.07) (0.08) (0.01) (0.001) (0.00) (0.02)
22–23 1,902 58,438 174 175 21 272 335
(0.08) (0.13) (0.02) (0.03) (0.05) (0.04) (0.03)
24–25 2,774 90,104 637 308 47 666 1,056
(0.12) (0.21) (0.09) (0.05) (0.10) (0.11) (0.10)
26–27 3,982 115,727 1,122 477 61 1,050 1,633
(0.17) (0.27) (0.16) (0.08) (0.13) (0.17) (0.16)
28–31 14,820 428,298 4,927 3,510 265 4,486 6,628
(0.65) (0.98) (0.68) (0.56) (0.57) (0.73) (0.64)
32–36 146,954 3,825,597 39,283 28,953 2,099 35,881 55,058
(6.40) (8.78) (5.44) (4.59) (4.55) (5.82) (5.35)
37–41 2,093,277 37,425,755 618,667 568,932 40,625 516,860 882,169
(91.1) (85.9) (85.7) (90.2) (88.1) (83.8) (85.8)
≥42 32,197 1,595,445 57,135 28,180 2,992 57,565 81,697
(1.40) (3.66) (7.91) (4.47) (6.49) (9.33) (7.94)
Unknown 5,699 432,844 6,642 5,369 199 25,258 1,273
(0.25) (0.98) (0.91) (0.84) (0.43) (3.93) (0.12)
BW (grams) <500 2,315 60,211 158 166 6 255 185
(0.10) (0.14) (0.02) (0.03) (0.01) (0.04) (0.02)
500–749 3,790 120,794 742 751 60 898 1,059
(0.16) (0.27) (0.10) (0.12) (0.13) (0.14) (0.10)
750–999 4,228 128,551 1,250 920 80 1,224 1,672
(0.18) (0.29) (0.17) (0.14) (0.17) (0.19) (0.16)
1,000–1,499 11,584 319,100 4,015 2,745 215 3,561 4,689
(0.50) (0.73) (0.56) (0.43) (0.46) (0.56) (0.46)
1,500–1,999 25,331 666,492 8,240 5,590 380 6,852 9,249
(1.10) (1.52) (1.14) (0.88) (0.82) (1.07) (0.90)
≥2000 2,250,300 42,694,623 707,730 624,694 45,563 628,658 1,008,332
(97.9) (97.1) (98.0) (98.4) (98.4) (98.0) (98.4)
Unknown 5,551 16,128 6,516 1,044 5 691 4,663
(0.24) (0.04) (0.89) (0.16) (0.01) (0.11) (0.45)
Total 2,303,099
(100.0)
44,005,899 (100.0)
728,651 (100.0)
635,910 (100.0)
46,309 (100.0)
642,139 (100.0)
1,029,849 (100.0)
Percentages calculated after excluding live births with unknown gestational age or birth weight (except for total and unknown cells)
births ≥28 weeks were 14 % (95 % CI 4–23) lower than rates in Finland, while the same rates in the United States
were 9 % (95 % CI 7–11) lower than those in Finland.
Neonatal mortality rates in Denmark and Sweden relative to Finland were not similarly affected by the exclusion of live births <28 weeks. Contrasts of neonatal mortality rates calculated after excluding live births <500 g and <1,000 g birth weight showed a similar pattern (Table 5).
Between-country comparisons of crude stillbirth rates showed that Norway, the United States, and Canada had the highest rates (Appendix 1 Table 7). In 2005, Norway had a crude stillbirth rate that was
145 % (95 % CI 123–169) higher than Finland’s.
Com-parisons restricted to births ≥28 weeks rendered this
difference non-significant (rate ratio 0.95, 95 % CI 0.80–1.12).
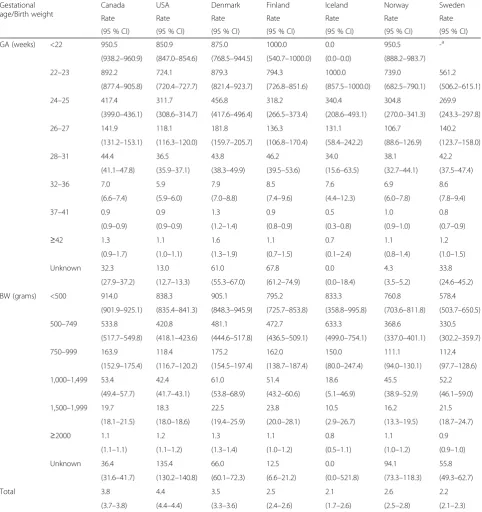
Table 3Neonatal mortality rates by gestational age (GA) and birth weight (BW) among selected high-income countries, 1995–2005
Gestational age/Birth weight
Canada USA Denmark Finland Iceland Norway Sweden
Rate Rate Rate Rate Rate Rate Rate
(95 % CI) (95 % CI) (95 % CI) (95 % CI) (95 % CI) (95 % CI) (95 % CI)
GA (weeks) <22 950.5 850.9 875.0 1000.0 0.0 950.5 -a
(938.2–960.9) (847.0–854.6) (768.5–944.5) (540.7–1000.0) (0.0–0.0) (888.2–983.7)
22–23 892.2 724.1 879.3 794.3 1000.0 739.0 561.2
(877.4–905.8) (720.4–727.7) (821.4–923.7) (726.8–851.6) (857.5–1000.0) (682.5–790.1) (506.2–615.1)
24–25 417.4 311.7 456.8 318.2 340.4 304.8 269.9
(399.0–436.1) (308.6–314.7) (417.6–496.4) (266.5–373.4) (208.6–493.1) (270.0–341.3) (243.3–297.8)
26–27 141.9 118.1 181.8 136.3 131.1 106.7 140.2
(131.2–153.1) (116.3–120.0) (159.7–205.7) (106.8–170.4) (58.4–242.2) (88.6–126.9) (123.7–158.0)
28–31 44.4 36.5 43.8 46.2 34.0 38.1 42.2
(41.1–47.8) (35.9–37.1) (38.3–49.9) (39.5–53.6) (15.6–63.5) (32.7–44.1) (37.5–47.4)
32–36 7.0 5.9 7.9 8.5 7.6 6.9 8.6
(6.6–7.4) (5.9–6.0) (7.0–8.8) (7.4–9.6) (4.4–12.3) (6.0–7.8) (7.8–9.4)
37–41 0.9 0.9 1.3 0.9 0.5 1.0 0.8
(0.9–0.9) (0.9–0.9) (1.2–1.4) (0.8–0.9) (0.3–0.8) (0.9–1.0) (0.7–0.9)
≥42 1.3 1.1 1.6 1.1 0.7 1.1 1.2
(0.9–1.7) (1.0–1.1) (1.3–1.9) (0.7–1.5) (0.1–2.4) (0.8–1.4) (1.0–1.5)
Unknown 32.3 13.0 61.0 67.8 0.0 4.3 33.8
(27.9–37.2) (12.7–13.3) (55.3–67.0) (61.2–74.9) (0.0–18.4) (3.5–5.2) (24.6–45.2)
BW (grams) <500 914.0 838.3 905.1 795.2 833.3 760.8 578.4
(901.9–925.1) (835.4–841.3) (848.3–945.9) (725.7–853.8) (358.8–995.8) (703.6–811.8) (503.7–650.5)
500–749 533.8 420.8 481.1 472.7 633.3 368.6 330.5
(517.7–549.8) (418.1–423.6) (444.6–517.8) (436.5–509.1) (499.0–754.1) (337.0–401.1) (302.2–359.7)
750–999 163.9 118.4 175.2 162.0 150.0 111.1 112.4
(152.9–175.4) (116.7–120.2) (154.5–197.4) (138.7–187.4) (80.0–247.4) (94.0–130.1) (97.7–128.6)
1,000–1,499 53.4 42.4 61.0 51.4 18.6 45.5 52.2
(49.4–57.7) (41.7–43.1) (53.8–68.9) (43.2–60.6) (5.1–46.9) (38.9–52.9) (46.1–59.0)
1,500–1,999 19.7 18.3 22.5 23.8 10.5 16.2 21.5
(18.1–21.5) (18.0–18.6) (19.4–25.9) (20.0–28.1) (2.9–26.7) (13.3–19.5) (18.7–24.7)
≥2000 1.1 1.2 1.3 1.1 0.8 1.1 0.9
(1.1–1.1) (1.1–1.2) (1.3–1.4) (1.0–1.2) (0.5–1.1) (1.0–1.2) (0.9–1.0)
Unknown 36.4 135.4 66.0 12.5 0.0 94.1 55.8
(31.6–41.7) (130.2–140.8) (60.1–72.3) (6.6–21.2) (0.0–521.8) (73.3–118.3) (49.3–62.7)
Total 3.8 4.4 3.5 2.5 2.1 2.6 2.2
(3.7–3.8) (4.4–4.4) (3.3–3.6) (2.4–2.6) (1.7–2.6) (2.5–2.8) (2.1–2.3)
Rates expressed per 1,000 live births.a
Live births <22 weeks not recorded in the Swedish Medical Birth Register
Table 4Stillbirth to live birth ratios, by gestational age (GA) and birth weight (BW) among selected high-income countries, 1995–2005
Gestational age/Birth weight Canada USA Denmark Finland Iceland Norway Sweden
Ratio (95 % CI) Ratio (95 % CI) Ratio (95 % CI) Ratio (95 % CI) Ratio (95 % CI) Ratio (95 % CI) Ratio (95 % CI)
GA (weeks) <22 155.8 (145.9–166.4) 163.6 (161.4–165.9) -a 200.0 (69.5–649.6) - 2073.3 (1698.6–2559.6) -a
22–23 112.1 (105.3–119.3) 79.2 (78.3–80.2) - 90.8 (72.8–113.3) 176.2 (100.5–316.8) 173.9 (149.5–202.6)
-24–25 38.2 (35.6–41.0) 26.7 (26.3–27.1) - 37.0 (29.6–46.0) 42.6 (23.9–73.2) 40.7 (35.2–46.9)
-26–27 18.2 (16.8–19.7) 15.3 (15.0–15.5) - 23.5 (18.9–28.9) 23.0 (11.9–41.5) 20.1 (17.2–23.3)
-28–31 9.6 (9.1–10.1) 7.6 (7.5–7.7) 11.4 (10.4–12.4) 9.4 (8.3–10.5) 10.9 (7.2–16.1) 8.6 (7.7–9.6) 9.2 (8.5–10.0)
32–36 1.7 (1.6–1.7) 1.3 (1.3–1.3) 2.0 (1.9–2.2) 1.6 (1.5–1.7) 2.0 (1.4–2.7) 1.7 (1.6–1.9) 1.9 (1.8–2.0)
37–41 0.2 (0.2–0.2) 0.1 (0.1–0.1) 0.2 (0.2–0.3) 0.1 (0.1–0.1) 0.1 (0.1–0.2) 0.2 (0.2–0.2) 0.2 (0.2–0.2)
≥42 0.2 (0.1–0.2) 0.1 (0.1–0.1) 0.2 (0.2–0.2) 0.1 (0.0–0.1) 0.0 (0.0–0.2) 0.2 (0.2–0.2) 0.2 (0.2–0.2)
Unknown 2.4 (2.1–2.9) 7.0 (7.0–7.1) 1.3 (1.1–1.6) 10.1 (9.2–11.0) 0.0 (0.0–1.9) 2.3 (2.1–2.5) 2.1 (1.4–3.1)
BW (grams) <500 128.6 (121.7–135.8) 139.4 (137.9–140.8) 51.3 (38.7–67.4) 196.4 (162.4–238.2) 383.3 (151.8–1151.6) 1077.9 (947.1–1229.8) 13.5 (8.5–20.6)
500–749 59.5 (56.4–62.7) 32.7 (32.3–33.1) 18.5 (15.3–22.2) 47.0 (41.3–53.4) 71.7 (47.3–107.8) 54.7 (48.9–61.1) 9.6 (7.8–11.8)
750–999 22.0 (20.5–23.6) 13.8 (13.5–14.0) 11.4 (9.6–13.6) 21.1 (18.0–24.6) 21.3 (11.8–36.2) 16.8 (14.4–19.4) 8.6 (7.2–10.1)
1,000–1,499 9.7 (9.1–10.3) 7.5 (7.4–7.6) 7.6 (6.7–8.5) 9.5 (8.3–10.8) 12.1 (7.7–18.2) 8.3 (7.3–9.3) 8.4 (7.6–9.3)
1,500–1,999 4.2 (4.0–4.5) 3.3 (3.2–3.3) 3.8 (3.4–4.2) 4.3 (3.8–4.9) 2.4 (1.1–4.5) 3.8 (3.4–4.3) 4.5 (4.1–5.0)
≥2000 0.2 (0.2–0.2) 0.2 (0.2–0.2) 0.3 (0.2–0.3) 0.2 (0.2–0.2) 0.2 (0.1–0.2) 0.2 (0.2–0.2) 0.2 (0.2–0.3)
Unknown 15.8 (14.7–17.0) 308.0 (302.4–313.4) 7.3 (6.7–8.0) 4.7 (3.4–6.2) 0.0 (0.0–109.1) 48.0 (42.0–54.8) 2.5 (2.0–3.0)
Total 0.6 (0.6–0.6) 0.7 (0.7–0.7) 0.4 (0.4–0.5) 0.4 (0.4–0.4) 0.4 (0.4–0.5) 0.9 (0.9–0.9) 0.4 (0.3–0.4)
Ratios are expressed per 100 live births
a
Denmark and Sweden did not report stillbirths <28 weeks until 2004 and 2008, respectively
Deb-Rinke
r
et
al.
BMC
Pediatrics
(2015) 15:112
Page
6
of
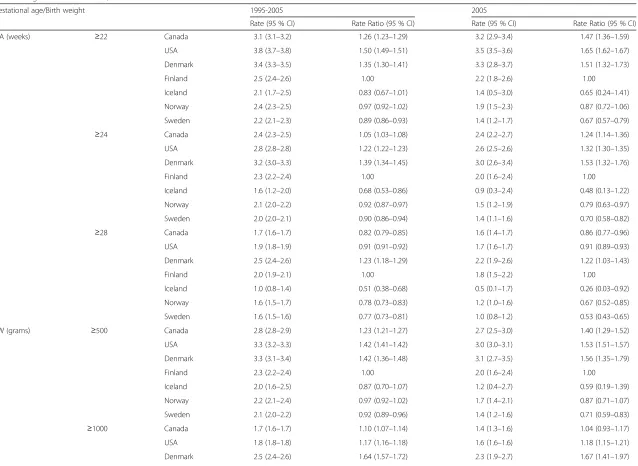
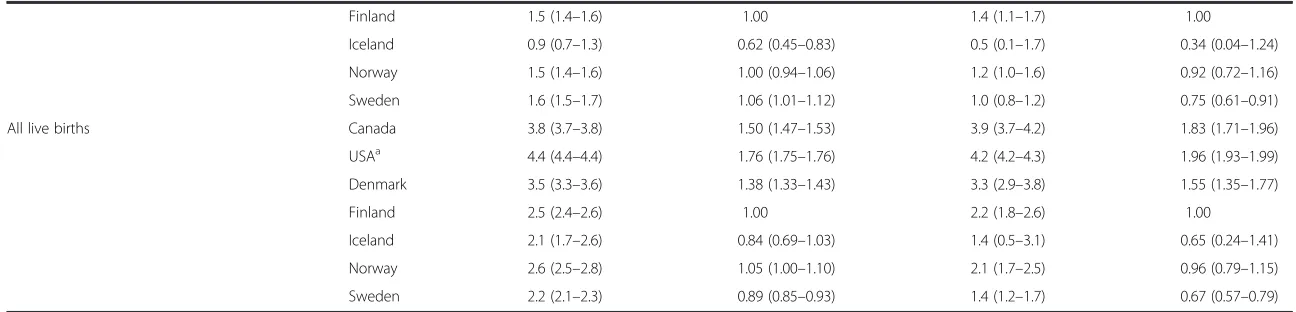
Table 5Crude neonatal mortality rates and rate ratios, and neonatal mortality rates and rate ratios after excluding live births <22 weeks, <24 weeks and <28 weeks, among selected high-income countries, 1995–2005 and 2005
Gestational age/Birth weight 1995-2005 2005
Rate (95 % CI) Rate Ratio (95 % CI) Rate (95 % CI) Rate Ratio (95 % CI)
GA (weeks) ≥22 Canada 3.1 (3.1–3.2) 1.26 (1.23–1.29) 3.2 (2.9–3.4) 1.47 (1.36–1.59)
USA 3.8 (3.7–3.8) 1.50 (1.49–1.51) 3.5 (3.5–3.6) 1.65 (1.62–1.67)
Denmark 3.4 (3.3–3.5) 1.35 (1.30–1.41) 3.3 (2.8–3.7) 1.51 (1.32–1.73)
Finland 2.5 (2.4–2.6) 1.00 2.2 (1.8–2.6) 1.00
Iceland 2.1 (1.7–2.5) 0.83 (0.67–1.01) 1.4 (0.5–3.0) 0.65 (0.24–1.41)
Norway 2.4 (2.3–2.5) 0.97 (0.92–1.02) 1.9 (1.5–2.3) 0.87 (0.72–1.06)
Sweden 2.2 (2.1–2.3) 0.89 (0.86–0.93) 1.4 (1.2–1.7) 0.67 (0.57–0.79)
≥24 Canada 2.4 (2.3–2.5) 1.05 (1.03–1.08) 2.4 (2.2–2.7) 1.24 (1.14–1.36)
USA 2.8 (2.8–2.8) 1.22 (1.22–1.23) 2.6 (2.5–2.6) 1.32 (1.30–1.35)
Denmark 3.2 (3.0–3.3) 1.39 (1.34–1.45) 3.0 (2.6–3.4) 1.53 (1.32–1.76)
Finland 2.3 (2.2–2.4) 1.00 2.0 (1.6–2.4) 1.00
Iceland 1.6 (1.2–2.0) 0.68 (0.53–0.86) 0.9 (0.3–2.4) 0.48 (0.13–1.22)
Norway 2.1 (2.0–2.2) 0.92 (0.87–0.97) 1.5 (1.2–1.9) 0.79 (0.63–0.97)
Sweden 2.0 (2.0–2.1) 0.90 (0.86–0.94) 1.4 (1.1–1.6) 0.70 (0.58–0.82)
≥28 Canada 1.7 (1.6–1.7) 0.82 (0.79–0.85) 1.6 (1.4–1.7) 0.86 (0.77–0.96)
USA 1.9 (1.8–1.9) 0.91 (0.91–0.92) 1.7 (1.6–1.7) 0.91 (0.89–0.93)
Denmark 2.5 (2.4–2.6) 1.23 (1.18–1.29) 2.2 (1.9–2.6) 1.22 (1.03–1.43)
Finland 2.0 (1.9–2.1) 1.00 1.8 (1.5–2.2) 1.00
Iceland 1.0 (0.8–1.4) 0.51 (0.38–0.68) 0.5 (0.1–1.7) 0.26 (0.03–0.92)
Norway 1.6 (1.5–1.7) 0.78 (0.73–0.83) 1.2 (1.0–1.6) 0.67 (0.52–0.85)
Sweden 1.6 (1.5–1.6) 0.77 (0.73–0.81) 1.0 (0.8–1.2) 0.53 (0.43–0.65)
BW (grams) ≥500 Canada 2.8 (2.8–2.9) 1.23 (1.21–1.27) 2.7 (2.5–3.0) 1.40 (1.29–1.52)
USA 3.3 (3.2–3.3) 1.42 (1.41–1.42) 3.0 (3.0–3.1) 1.53 (1.51–1.57)
Denmark 3.3 (3.1–3.4) 1.42 (1.36–1.48) 3.1 (2.7–3.5) 1.56 (1.35–1.79)
Finland 2.3 (2.2–2.4) 1.00 2.0 (1.6–2.4) 1.00
Iceland 2.0 (1.6–2.5) 0.87 (0.70–1.07) 1.2 (0.4–2.7) 0.59 (0.19–1.39)
Norway 2.2 (2.1–2.4) 0.97 (0.92–1.02) 1.7 (1.4–2.1) 0.87 (0.71–1.07)
Sweden 2.1 (2.0–2.2) 0.92 (0.89–0.96) 1.4 (1.2–1.6) 0.71 (0.59–0.83)
≥1000 Canada 1.7 (1.6–1.7) 1.10 (1.07–1.14) 1.4 (1.3–1.6) 1.04 (0.93–1.17)
USA 1.8 (1.8–1.8) 1.17 (1.16–1.18) 1.6 (1.6–1.6) 1.18 (1.15–1.21)
Denmark 2.5 (2.4–2.6) 1.64 (1.57–1.72) 2.3 (1.9–2.7) 1.67 (1.41–1.97)
Deb-Rinke
r
et
al.
BMC
Pediatrics
(2015) 15:112
Page
7
of
Table 5Crude neonatal mortality rates and rate ratios, and neonatal mortality rates and rate ratios after excluding live births <22 weeks, <24 weeks and <28 weeks, among selected high-income countries, 1995–2005 and 2005(Continued)
Finland 1.5 (1.4–1.6) 1.00 1.4 (1.1–1.7) 1.00
Iceland 0.9 (0.7–1.3) 0.62 (0.45–0.83) 0.5 (0.1–1.7) 0.34 (0.04–1.24)
Norway 1.5 (1.4–1.6) 1.00 (0.94–1.06) 1.2 (1.0–1.6) 0.92 (0.72–1.16)
Sweden 1.6 (1.5–1.7) 1.06 (1.01–1.12) 1.0 (0.8–1.2) 0.75 (0.61–0.91)
All live births Canada 3.8 (3.7–3.8) 1.50 (1.47–1.53) 3.9 (3.7–4.2) 1.83 (1.71–1.96)
USAa 4.4 (4.4–4.4) 1.76 (1.75–1.76) 4.2 (4.2–4.3) 1.96 (1.93–1.99)
Denmark 3.5 (3.3–3.6) 1.38 (1.33–1.43) 3.3 (2.9–3.8) 1.55 (1.35–1.77)
Finland 2.5 (2.4–2.6) 1.00 2.2 (1.8–2.6) 1.00
Iceland 2.1 (1.7–2.6) 0.84 (0.69–1.03) 1.4 (0.5–3.1) 0.65 (0.24–1.41)
Norway 2.6 (2.5–2.8) 1.05 (1.00–1.10) 2.1 (1.7–2.5) 0.96 (0.79–1.15)
Sweden 2.2 (2.1–2.3) 0.89 (0.85–0.93) 1.4 (1.2–1.7) 0.67 (0.57–0.79)
GAgestational age andBWbirth weight. Rates are expressed per 1,000 infants at risk. Only births with gestational age <22 weeks excluded from the rate calculation for births≥22 weeks i.e., births with unknown gestational age included in the calculations. Calculations of rates for births≥28 weeks and birth weight≥500 g and≥1000 g were carried out in a similar manner. Finland was used as the reference category for calculation of rate ratios
a
US rates are based on live births with GA≥20 completed weeks
Deb-Rinke
r
et
al.
BMC
Pediatrics
(2015) 15:112
Page
8
of
Table 6 shows crude, gestational age-specific and birth weight-specific post-neonatal mortality rates. Compared with Finland, crude rates of post-neonatal mortality in
2005 were 54 % (95 % CI 36–73) higher in Canada and
160 % (95 % CI 154–165) higher in the United States.
Gestational age-specific comparisons after restriction to
live births≥22 weeks and≥28 weeks did not significantly
attenuate the differences between Canada and the United States versus Finland.
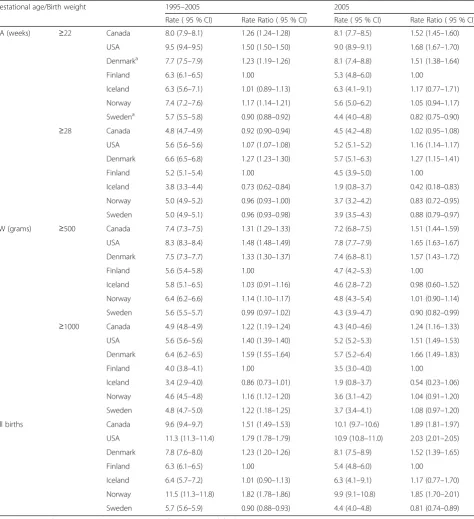
Analyses of gestational age—and birth weight-specific
perinatal and feto-infant mortality showed similar results
(Appendix 2 Table 8 and Appendix 3 Table 9). Compari-sons of cause-specific infant mortality rates for the period
of 1995–2005 showed that infant deaths due to congenital
anomalies, immaturity and other causes were all higher in Canada and the United States compared with the Nordic countries (except for Denmark, Appendix Table 4).
Discussion
The higher rates of live births <22 and 22–23 weeks ges-tation in Canada as compared with the Nordic coun-tries, and the lack of similar differences between them
Table 6Crude post-neonatal mortality rates and rate ratios, and post-neonatal mortality rates and rate ratios after excluding live births <22 weeks and <28 weeks, among selected high-income countries, 1995–2005 and 2005
Gestational age/Birth weight 1995-2005 2005
Rate (95 % CI) Rate Ratio (95 % CI) Rate (95 % CI) Rate Ratio (95 % CI)
GA (weeks) ≥22 Canada 1.6 (1.5–1.6) 1.62 (1.57–1.68) 1.4 (1.2–1.5) 1.54 (1.36–1.73)
USA 2.4 (2.3–2.4) 2.41 (2.40–2.43) 2.3 (2.3–2.3) 2.59 (2.54–2.65)
Denmark 1.2 (1.1–1.3) 1.17 (1.09–1.25) 1.0 (0.8–1.3) 1.12 (0.86–1.43)
Finland 1.0 (1.0–1.1) 1.00 0.9 (0.7–1.2) 1.00
Norway 1.1 (1.1–1.2) 1.18 (1.09–1.26) 0.7 (0.5–1.0) 0.79 (0.56–1.08)
Sweden 1.1 (1.0–1.2) 1.14 (1.07–1.21) 1.1 (0.9–1.3) 1.19 (0.98–1.44)
≥28 Canada 1.5 (1.4–1.5) 1.49 (1.44–1.54) 1.2 (1.1–1.4) 1.43 (1.26–1.61)
USA 2.1 (2.1–2.1) 2.13 (2.11–2.14) 2.0 (1.9–2.0) 2.32 (2.27–2.37)
Denmark 1.2 (1.1–1.2) 1.15 (1.07–1.23) 0.9 (0.7–1.2) 1.04 (0.79–1.35)
Finland 1.0 (0.9–1.1) 1.00 0.9 (0.6–1.1) 1.00
Norway 1.0 (1.0–1.1) 1.06 (0.98–1.15) 0.6 (0.4–0.8) 0.70 (0.48–0.98)
Sweden 1.0 (0.9–1.1) 1.03 (0.96–1.09) 0.9 (0.7–1.1) 1.07 (0.86–1.31)
BW (grams) ≥500 Canada 1.6 (1.5–1.6) 1.57 (1.52–1.62) 1.4 (1.2–1.5) 1.53 (1.36–1.72)
USA 2.3 (2.3–2.3) 2.32 (2.30–2.33) 2.3 (2.2–2.3) 2.56 (2.51–2.61)
Denmark 1.2 (1.1–1.3) 1.18 (1.10–1.26) 1.0 (0.8–1.3) 1.12 (0.86–1.42)
Finland 1.0 (0.9–1.1) 1.00 0.9 (0.7–1.2) 1.00
Norway 1.1 (1.1–1.2) 1.13 (1.05–1.22) 0.7 (0.5–0.9) 0.77 (0.55–1.05)
Sweden 1.1 (1.0–1.2) 1.10 (1.04–1.16) 1.0 (0.9–1.3) 1.18 (0.97–1.43)
≥1000 Canada 1.5 (1.4–1.5) 1.51 (1.46–1.57) 1.2 (1.0–1.3) 1.52 (1.33–1.72)
USA 2.0 (2.0–2.1) 2.13 (2.12–2.14) 1.9 (1.9–2.0) 2.48 (2.43–2.54)
Denmark 1.1 (1.1–1.2) 1.20 (1.12–1.28) 0.9 (0.7–1.2) 1.00 (0.76–1.30)
Finland 1.0 (0.9–1.0) 1.00 0.8 (0.6–1.0) 1.00
Norway 1.0 (1.0–1.1) 1.09 (1.01–1.18) 0.6 (0.4–0.8) 0.76 (0.53–1.06)
Sweden 1.0 (0.9–1.1) 1.04 (0.98–1.11) 0.9 (0.7–1.1) 1.16 (0.93–1.42)
All live births Canada 1.6 (1.5–1.6) 1.57 (1.52–1.62) 1.4 (1.2–1.5) 1.54 (1.36–1.73)
USA 2.4 (2.3–2.4) 2.34 (2.32–2.35) 2.3 (2.3–2.3) 2.60 (2.54–2.65)
Denmark 1.2 (1.1–1.3) 1.17 (1.09–1.25) 1.0 (0.8–1.3) 1.12 (0.86–1.43)
Finland 1.0 (0.9–1.1) 1.00 0.9 (0.7–1.2) 1.00
Norway 1.1 (1.1–1.2) 1.14 (1.06–1.22) 0.7 (0.5–1.0) 0.79 (0.56–1.08)
Sweden 1.1 (1.0–1.2) 1.10 (1.04–1.17) 1.1 (0.9–1.3) 1.19 (0.98–1.44)
GAgestational age andBWbirth weight. Rates are expressed per 1,000 infants at risk. Only births with gestational age <22 weeks excluded from the rate calculation for births≥22 weeks i.e., births with unknown gestational age included in the calculations. Calculations of rates for births≥28 weeks and birth weight
≥500 g and≥1000 g were carried out in a similar manner. Finland was used as the reference category for calculation of rate ratios
in live birth frequency at 24–25, 26–27 and 28–31
weeks and at 750–999 g, 1000–1499 g and 1500–1999 g
suggests that the former differences may reflect
dissimi-larities in birth registration [18–20]. The observed
dif-ferences in stillbirth and neonatal mortality may be a consequence of artifactual differences in birth registra-tion. The unexpectedly low neonatal mortality rate among live births at 22–23 weeks gestation in Sweden may suggest the possibility of selective birth registration of survivors. The lower stillbirth:live birth ratios in the United States at
22–23 weeks and other preterm gestations may reflect a
tendency to label non-viable live births as stillbirths. Between-country differences in crude versus gestational age-specific stillbirth and neonatal mortality rates may also stem from differences in birth registration. This is exempli-fied by the stillbirth contrast between Norway and Finland. Norway (which registered stillbirths from 16 week gesta-tion) had substantially higher crude stillbirth rates com-pared with Finland (stillbirth registration criteria≥22 weeks or≥500 g), whereas no significant difference was observed after restriction to births≥500 g,≥1,000 g or≥28 weeks. Fi-nally, the lack of difference in crude versus gestational
age—and birth weight-specific comparisons of
post-neonatal mortality probably reflect the fact that near-viable births do not contribute substantially to post-neonatal deaths. The higher rates of post-neonatal mortality in Canada and the United States can be best explained by differences in factors such as the level of community-based social supports, preventative medical follow-up, strict surveillance for vaccination etc.
Our findings may indicate true differences in perinatal and postnatal health status between countries. We are not aware of any reports that non-viable live births are regis-tered as stillbirths or labeled as miscarriages in the Nordic countries. In fact, a tendency to register live births <500 g as stillbirths has been reported from a few U.S. states [21]. The high rate of preterm birth in the United States relative to the Nordic countries is congruent with true differences in determinants of preterm birth such as body mass index, smoking, teen pregnancy and socioeconomic status. These factors could also explain higher live birth rates at very early gestation in the United States [22, 23].
Other explanations for our findings include between-country differences in stillbirth definitions including the exclusion of fetal deaths following pregnancy termination from stillbirth counts [24, 25] (Table 1). Finally, methods of estimation of gestational age vary between countries and need to be considered when comparing mortality rates. While ultrasound is considered the optimal method, combinations of last menstrual period, clinical estimates and ultrasound are often used.. These between-country differences in gestational age ascertainment may underlie some observed differences in mortality [14, 26]. For in-stance, misclassification due to the primary use of
menstrual dating in the United States data may explain the slightly lower neonatal mortality rates at 22–23 weeks. The routine use of early ultrasound dating in Sweden, however, cannot explain the unexpectedly low neonatal
mortality at 22–23 weeks.Our study has several
limita-tions. We could not use data beyond 2005 since Canadian birth-death linked data were unavailable beyond 2005. Large datasets such as the ones we used are likely to con-tain errors. Systematic reporting differences can occur even within countries: for 2005, the CDC reported a neonatal mortality rate of 4.54 per 1000 live births based on all live births without any exclusion [27], while our estimated rate
of 4.2 for the same year was based on live births with≥20
completed weeks’gestation. Errors in gestational age esti-mation are more likely at extremely low gestation. Correc-tion of such errors differs by country. Some countries attempt to improve data quality by excluding very early ges-tation births with birth weight-for-gesges-tational-age (z-score) above a certain threshold; infant mortality rates may change depending on whether or not such data checks are carried out, whether the gestational age of such births is set to missing and whether or not such births are deleted from vital records.
Conclusions
Our study shows substantial international variation in the frequency and mortality of near-viable births. Rea-sons to suspect that the observed variations are artifacts of birth registration differences include similar live birth frequencies in other very preterm/low birth weight cat-egories, some implausibly low neonatal mortality rates at the borderline of viability, large between-country differ-ences in stillbirth ratios at very preterm gestation, and differences in between-country contrasts of crude versus
gestational age—and birth weight-specific stillbirths and
neonatal mortality. On the other hand, true between-country differences in maternal, fetal and infant health status could also explain the observed findings; particu-larly for post-neonatal mortality. The distribution of risk factors for preterm birth in different countries and the high rates of preterm birth in the United States relative to the Nordic countries are congruent with the observed higher rates of live births at the borderline of viability in the United States. Also, discrepancies in birth registration (la-beling nonviable live births as stillbirths) have been re-ported from the United States but not from the Nordic countries. Our study cannot provide a definitive explan-ation for the observed differences in the frequency and mortality of live births at the borderline of viability and at very early gestation. More detailed studies are required to assess the value of international comparisons of fetal and infant mortality and to make such comparisons more meaningful.
Appendix 1
Table 7Crude stillbirth rates and rate ratios, and stillbirth rates and rate ratios after excluding live births and stillbirths <22 weeks and <28 weeks, among selected high-income countries, 1995-2005 and 2005
Gestational age/Birth weight 1995–2005 2005
Rate (95 % CI) Rate Ratio (95 % CI) Rate (95 % CI) Rate Ratio (95 % CI)
GA (weeks) ≥22 Canada 4.8 (4.7–4.9) 1.27 (1.24–1.29) 5.0 (4.7–5.3) 1.55 (1.45–1.64)
USA 5.7 (5.7–5.8) 1.50 (1.49–1.51) 5.4 (5.4–5.5) 1.70 (1.68–1.72)
Denmarka 4.4 (4.2–4.5) 1.14 (1.10–1.18) 4.8 (4.3–5.4) 1.51 (1.35–1.69)
Finland 3.8 (3.7–4.0) 1.00 3.2 (2.8–3.7) 1.00
Iceland 4.3 (3.7–4.9) 1.12 (0.97–1.29) 4.9 (3.0–7.4) 1.52 (0.94–2.33)
Norway 5.0 (4.8–5.2) 1.31 (1.26–1.35) 3.7 (3.2–4.3) 1.17 (1.01–1.33)
Swedena 3.4 (3.3–3.6) 0.90 (0.87–0.93) 2.9 (2.6–3.3) 0.92 (0.81–1.03)
≥28 Canada 3.2 (3.1–3.2) 0.98 (0.96–1.00) 3.0 (2.7–3.2) 1.13 (1.05–1.23)
USA 3.8 (3.8–3.8) 1.17 (1.16–1.18) 3.5 (3.5–3.6) 1.34 (1.32–1.36)
Denmark 4.1 (4.0–4.3) 1.29 (1.24–1.33) 3.4 (3.0–3.9) 1.32 (1.15–1.50)
Finland 3.2 (3.1–3.4) 1.00 2.6 (2.2–3.1) 1.00
Iceland 2.8 (2.3–3.3) 0.85 (0.71–1.02) 1.4 (0.5–3.0) 0.53 (0.20–1.16)
Norway 3.5 (3.3–3.6) 1.07 (1.03–1.12) 2.5 (2.1–2.9) 0.95 (0.80–1.12)
Sweden 3.5 (3.3–3.6) 1.07 (1.04–1.11) 2.9 (2.6–3.3) 1.12 (1.00–1.26)
BW (grams) ≥500 Canada 4.6 (4.5–4.6) 1.37 (1.34–1.39) 4.4 (4.1–4.7) 1.60 (1.49–1.70)
USA 5.1 (5.1–5.1) 1.53 (1.52–1.53) 4.8 (4.7–4.9) 1.74 (1.71–1.76)
Denmark 4.3 (4.1–4.4) 1.28 (1.23–1.32) 4.4 (3.9–4.9) 1.58 (1.40–1.77)
Finland 3.3 (3.2–3.5) 1.00 2.8 (2.4–3.2) 1.00
Iceland 3.8 (3.2–4.4) 1.14 (0.98–1.32) 3.5 (1.9–5.7) 1.26 (0.70–2.07)
Norway 4.2 (4.0–4.3) 1.26 (1.21–1.30) 3.1 (2.6–3.6) 1.11 (0.96–1.29)
Sweden 3.5 (3.4–3.6) 1.04 (1.01–1.08) 2.9 (2.6–3.2) 1.04 (0.92–1.17)
≥1000 Canada 3.2 (3.1–3.3) 1.29 (1.26–1.32) 2.9 (2.7–3.1) 1.36 (1.25–1.47)
USA 3.8 (3.8–3.8) 1.54 (1.53–1.55) 3.6 (3.6–3.7) 1.71 (1.68–1.74)
Denmark 3.9 (3.7–4.0) 1.57 (1.51–1.62) 3.5 (3.0–4.0) 1.65 (1.44–1.88)
Finland 2.5 (2.4–2.6) 1.00 2.1 (1.8–2.5) 1.00
Iceland 2.5 (2.1–3.0) 1.01 (0.83–1.21) 1.4 (0.5–3.0) 0.66 (0.24–1.44)
Norway 3.1 (3.0–3.3) 1.25 (1.20–1.31) 2.4 (2.0–2.8) 1.12 (0.94–1.33)
Sweden 3.2 (3.1–3.4) 1.31 (1.26–1.35) 2.7 (2.4–3.1) 1.28 (1.14–1.44)
All births Canada 5.8 (5.7–5.9) 1.52 (1.49–1.55) 6.2 (5.9–6.6) 1.93 (1.83–2.04)
USA 7.0 (6.9–7.0) 1.81 (1.81–1.82) 6.7 (6.6–6.8) 2.08 (2.06–2.11)
Denmark 4.4 (4.2–4.5) 1.14 (1.10–1.18) 4.8 (4.3–5.4) 1.50 (1.34–1.68)
Finland 3.8 (3.7–4.0) 1.00 3.2 (2.8–3.7) 1.00
Iceland 4.3 (3.7–4.9) 1.11 (0.97–1.28) 4.9 (3.0–7.4) 1.51 (0.94–2.31)
Norway 8.9 (8.7–9.1) 2.32 (2.26–2.38) 7.9 (7.2–8.6) 2.45 (2.23–2.69)
Sweden 3.5 (3.4–3.6) 0.91 (0.88–0.94) 2.9 (2.6–3.3) 0.91 (0.81–1.02)
Rates are expressed per 1,000 total births
a
Denmark and Sweden did not report stillbirths less than 28 weeks until 2004 and 2008, respectively
Only births with gestational age <22 weeks excluded from the rate calculation for births≥22 weeks i.e., births with unknown gestational age included in the calculations. Calculations of rates for births≥28 weeks and birth weight≥500 g and≥1000 g were carried out in a similar manner. Finland was used as the reference category for calculation of rate ratios
Appendix 2
Table 8Perinatal mortality rates and rate ratios by gestational age (GA) and birth weight (BW) among selected high-income countries, 1995–2005 and 2005
Gestational age/Birth weight 1995–2005 2005
Rate ( 95 % CI) Rate Ratio ( 95 % CI) Rate ( 95 % CI) Rate Ratio ( 95 % CI)
GA (weeks) ≥22 Canada 8.0 (7.9–8.1) 1.26 (1.24–1.28) 8.1 (7.7–8.5) 1.52 (1.45–1.60)
USA 9.5 (9.4–9.5) 1.50 (1.50–1.50) 9.0 (8.9–9.1) 1.68 (1.67–1.70)
Denmarka 7.7 (7.5–7.9) 1.23 (1.19–1.26) 8.1 (7.4–8.8) 1.51 (1.38–1.64)
Finland 6.3 (6.1–6.5) 1.00 5.3 (4.8–6.0) 1.00
Iceland 6.3 (5.6–7.1) 1.01 (0.89–1.13) 6.3 (4.1–9.1) 1.17 (0.77–1.71)
Norway 7.4 (7.2–7.6) 1.17 (1.14–1.21) 5.6 (5.0–6.2) 1.05 (0.94–1.17)
Swedena 5.7 (5.5–5.8) 0.90 (0.88–0.92) 4.4 (4.0–4.8) 0.82 (0.75–0.90)
≥28 Canada 4.8 (4.7–4.9) 0.92 (0.90–0.94) 4.5 (4.2–4.8) 1.02 (0.95–1.08)
USA 5.6 (5.6–5.6) 1.07 (1.07–1.08) 5.2 (5.1–5.2) 1.16 (1.14–1.17)
Denmark 6.6 (6.5–6.8) 1.27 (1.23–1.30) 5.7 (5.1–6.3) 1.27 (1.15–1.41)
Finland 5.2 (5.1–5.4) 1.00 4.5 (3.9–5.0) 1.00
Iceland 3.8 (3.3–4.4) 0.73 (0.62–0.84) 1.9 (0.8–3.7) 0.42 (0.18–0.83)
Norway 5.0 (4.9–5.2) 0.96 (0.93–1.00) 3.7 (3.2–4.2) 0.83 (0.72–0.95)
Sweden 5.0 (4.9–5.1) 0.96 (0.93–0.98) 3.9 (3.5–4.3) 0.88 (0.79–0.97)
BW (grams) ≥500 Canada 7.4 (7.3–7.5) 1.31 (1.29–1.33) 7.2 (6.8–7.5) 1.51 (1.44–1.59)
USA 8.3 (8.3–8.4) 1.48 (1.48–1.49) 7.8 (7.7–7.9) 1.65 (1.63–1.67)
Denmark 7.5 (7.3–7.7) 1.33 (1.30–1.37) 7.4 (6.8–8.1) 1.57 (1.43–1.72)
Finland 5.6 (5.4–5.8) 1.00 4.7 (4.2–5.3) 1.00
Iceland 5.8 (5.1–6.5) 1.03 (0.91–1.16) 4.6 (2.8–7.2) 0.98 (0.60–1.52)
Norway 6.4 (6.2–6.6) 1.14 (1.10–1.17) 4.8 (4.3–5.4) 1.01 (0.90–1.14)
Sweden 5.6 (5.5–5.7) 0.99 (0.97–1.02) 4.3 (3.9–4.7) 0.90 (0.82–0.99)
≥1000 Canada 4.9 (4.8–4.9) 1.22 (1.19–1.24) 4.3 (4.0–4.6) 1.24 (1.16–1.33)
USA 5.6 (5.6–5.6) 1.40 (1.39–1.40) 5.2 (5.2–5.3) 1.51 (1.49–1.53)
Denmark 6.4 (6.2–6.5) 1.59 (1.55–1.64) 5.7 (5.2–6.4) 1.66 (1.49–1.83)
Finland 4.0 (3.8–4.1) 1.00 3.5 (3.0–4.0) 1.00
Iceland 3.4 (2.9–4.0) 0.86 (0.73–1.01) 1.9 (0.8–3.7) 0.54 (0.23–1.06)
Norway 4.6 (4.5–4.8) 1.16 (1.12–1.20) 3.6 (3.1–4.2) 1.04 (0.91–1.20)
Sweden 4.8 (4.7–5.0) 1.22 (1.18–1.25) 3.7 (3.4–4.1) 1.08 (0.97–1.20)
All births Canada 9.6 (9.4–9.7) 1.51 (1.49–1.53) 10.1 (9.7–10.6) 1.89 (1.81–1.97)
USA 11.3 (11.3–11.4) 1.79 (1.78–1.79) 10.9 (10.8–11.0) 2.03 (2.01–2.05)
Denmark 7.8 (7.6–8.0) 1.23 (1.20–1.26) 8.1 (7.5–8.9) 1.52 (1.39–1.65)
Finland 6.3 (6.1–6.5) 1.00 5.4 (4.8–6.0) 1.00
Iceland 6.4 (5.7–7.2) 1.01 (0.90–1.13) 6.3 (4.1–9.1) 1.17 (0.77–1.70)
Norway 11.5 (11.3–11.8) 1.82 (1.78–1.86) 9.9 (9.1–10.8) 1.85 (1.70–2.01)
Sweden 5.7 (5.6–5.9) 0.90 (0.88–0.93) 4.4 (4.0–4.8) 0.81 (0.74–0.89)
Rates are expressed per 1,000 total births. Numerator = Stillbirths + Neonatal deaths
a
Denmark and Sweden did not report on stillbirths less than 28 weeks until 2004 and 2008 respectively Finland was used as the reference category for calculation of rate ratios
Only births with gestational age <22 weeks excluded from the rate calculation for births≥22 weeks i.e., births with unknown gestational age included in the calculations. Calculations of rates for births≥28 weeks and birth weight≥500 g and≥1000 g were carried out in a similar manner
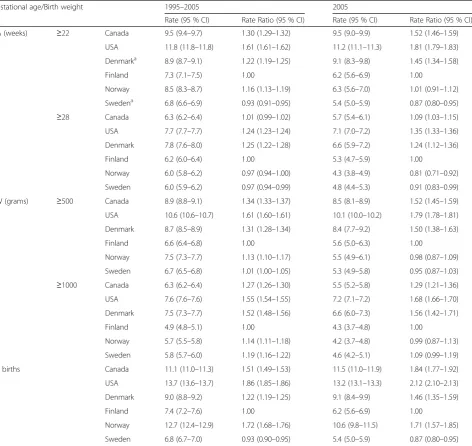
Appendix 3
Table 9Feto-infant mortality rates and rate ratios by gestational age (GA) and birth weight (BW) among selected high-income countries, 1995
–
2005 and 2005
Gestational age/Birth weight 1995–2005 2005
Rate (95 % CI) Rate Ratio (95 % CI) Rate (95 % CI) Rate Ratio (95 % CI)
GA (weeks) ≥22 Canada 9.5 (9.4–9.7) 1.30 (1.29–1.32) 9.5 (9.0–9.9) 1.52 (1.46–1.59)
USA 11.8 (11.8–11.8) 1.61 (1.61–1.62) 11.2 (11.1–11.3) 1.81 (1.79–1.83)
Denmarka 8.9 (8.7–9.1) 1.22 (1.19–1.25) 9.1 (8.3–9.8) 1.45 (1.34–1.58)
Finland 7.3 (7.1–7.5) 1.00 6.2 (5.6–6.9) 1.00
Norway 8.5 (8.3–8.7) 1.16 (1.13–1.19) 6.3 (5.6–7.0) 1.01 (0.91–1.12)
Swedena 6.8 (6.6–6.9) 0.93 (0.91–0.95) 5.4 (5.0–5.9) 0.87 (0.80–0.95)
≥28 Canada 6.3 (6.2–6.4) 1.01 (0.99–1.02) 5.7 (5.4–6.1) 1.09 (1.03–1.15)
USA 7.7 (7.7–7.7) 1.24 (1.23–1.24) 7.1 (7.0–7.2) 1.35 (1.33–1.36)
Denmark 7.8 (7.6–8.0) 1.25 (1.22–1.28) 6.6 (5.9–7.2) 1.24 (1.12–1.36)
Finland 6.2 (6.0–6.4) 1.00 5.3 (4.7–5.9) 1.00
Norway 6.0 (5.8–6.2) 0.97 (0.94–1.00) 4.3 (3.8–4.9) 0.81 (0.71–0.92)
Sweden 6.0 (5.9–6.2) 0.97 (0.94–0.99) 4.8 (4.4–5.3) 0.91 (0.83–0.99)
BW (grams) ≥500 Canada 8.9 (8.8–9.1) 1.34 (1.33–1.37) 8.5 (8.1–8.9) 1.52 (1.45–1.59)
USA 10.6 (10.6–10.7) 1.61 (1.60–1.61) 10.1 (10.0–10.2) 1.79 (1.78–1.81)
Denmark 8.7 (8.5–8.9) 1.31 (1.28–1.34) 8.4 (7.7–9.2) 1.50 (1.38–1.63)
Finland 6.6 (6.4–6.8) 1.00 5.6 (5.0–6.3) 1.00
Norway 7.5 (7.3–7.7) 1.13 (1.10–1.17) 5.5 (4.9–6.1) 0.98 (0.87–1.09)
Sweden 6.7 (6.5–6.8) 1.01 (1.00–1.05) 5.3 (4.9–5.8) 0.95 (0.87–1.03)
≥1000 Canada 6.3 (6.2–6.4) 1.27 (1.26–1.30) 5.5 (5.2–5.8) 1.29 (1.21–1.36)
USA 7.6 (7.6–7.6) 1.55 (1.54–1.55) 7.2 (7.1–7.2) 1.68 (1.66–1.70)
Denmark 7.5 (7.3–7.7) 1.52 (1.48–1.56) 6.6 (6.0–7.3) 1.56 (1.42–1.71)
Finland 4.9 (4.8–5.1) 1.00 4.3 (3.7–4.8) 1.00
Norway 5.7 (5.5–5.8) 1.14 (1.11–1.18) 4.2 (3.7–4.8) 0.99 (0.87–1.13)
Sweden 5.8 (5.7–6.0) 1.19 (1.16–1.22) 4.6 (4.2–5.1) 1.09 (0.99–1.19)
All births Canada 11.1 (11.0–11.3) 1.51 (1.49–1.53) 11.5 (11.0–11.9) 1.84 (1.77–1.92)
USA 13.7 (13.6–13.7) 1.86 (1.85–1.86) 13.2 (13.1–13.3) 2.12 (2.10–2.13)
Denmark 9.0 (8.8–9.2) 1.22 (1.19–1.25) 9.1 (8.4–9.9) 1.46 (1.35–1.59)
Finland 7.4 (7.2–7.6) 1.00 6.2 (5.6–6.9) 1.00
Norway 12.7 (12.4–12.9) 1.72 (1.68–1.76) 10.6 (9.8–11.5) 1.71 (1.57–1.85)
Sweden 6.8 (6.7–7.0) 0.93 (0.90–0.95) 5.4 (5.0–5.9) 0.87 (0.80–0.95)
Rates are expressed per 1,000 total births. Numerator = Stillbirths + Infant deaths
a
Denmark and Sweden did not report on stillbirths less than 28 weeks until 2004 and 2008, respectively
Only births with gestational age <22 weeks excluded from the rate calculation for births≥22 weeks i.e., births with unknown gestational age included in the calculations
Calculations of rates for births≥28 weeks and birth weight≥500 g and≥1000 g were carried out in a similar manner Finland was used as the reference category for calculation of rate ratios
Appendix 4
Additional file
Additional file 1:STROBE Statement—checklist of items that should be included in reports of observational studies.(DOC 84 kb)
Abbreviations
(GA):Gestational age; (BW): Birth weight. Competing interests
The authors declare that they have no competing interests. Authors’contributions
PDR: coordinated data collection, carried out the analyses, drafted the initial manuscript and revised the manuscript based on comments from other authors. KSJ: conceptualized, designed and guided the study and provided critical comments on revising the manuscript based on comments from other authors. JAL: proposed, conceptualized and designed the study and critically reviewed the manuscript. PSS, RSS and MSK: conceptualized and designed the study and critically reviewed the manuscript. NLG and JR: designed the data collection instruments and critically reviewed the manuscript. ANA, RIB, MG, LHM, RS, SEV and XZ: provided data and critically reviewed the manuscript. All authors contributed to the interpretation of the data, critically reviewed all drafts of the manuscript and approved the final version submitted for publication.
Acknowledgements
We are grateful to the Vital Statistics data stewards of each country for access to the birth and mortality data. PSS and KSJ are supported by Chair awards for Reproductive and Child Health Services and Policy research from the Canadian Institutes of Health Research. We would like to thank Dr. Sven Cnattingius for providing analyses of Swedish data and Dr. Marian MacDorman for providing analyses of data from the United States.
Author details
1
Maternal and Infant Health Section, Surveillance and Epidemiology Division, Centre for Chronic Disease Prevention, Public Health Agency of Canada, 785
Carling Avenue, AL 6804A, Ottawa, Ontario K1A 0K9, Canada.2Department of
Public Health, University of Copenhagen, Copenhagen, Denmark.
3
Department of Obstetrics and Gynecology, Landspitali, Rekjavik, Iceland.
4National Institute of Health and Welfare (THL), Helsinki, Finland.5Medical
Birth Registry of Norway, University of Bergen, Bergen, Norway.6Departments
of Pediatrics and of Epidemiology, Biostatistics and Occupational Health, McGill University, Montreal, Quebec, Canada.7Department of Paediatrics, University of Toronto, Mount Sinai Hospital, Toronto, Ontario, Canada.
8Departments of Pediatrics and Community Health Sciences, University of
Calgary, Calgary, Alberta, Canada.9Department of Obstetrics and
Gynaecology and the School of Population and Public Health, University of British Columbia, Vancouver, British Columbia, Canada.
Received: 2 February 2015 Accepted: 21 August 2015
References
1. Sachs BP, Fretts RC, Gardner R, Hellerstein S, Wampler NS, Wise PH. The impact of extreme prematurity and congenital anomalies on the interpretation of international comparisons of infant mortality. Obstet Gynecol. 1995;85(6):941–6.
2. Howell EM, Blondel B. International infant mortality rates: Bias from reporting differences. Am J Public Health. 1994;84(5):850–2.
3. United nations Children’s fund. The state of the world’s children. Maternal and newborn health. UNICEF. 2009. NewYork, USA.
4. Health at a Glance 2011: OECD Indicators, OECD 2011, OECD Publishing. http://dx.doi.org/10.1787/health_glance-2011-en
5. Kramer MS, Platt RW, Yang H, Haglund B, Cnattingius S, Bergsjo P. Registration artifacts in international comparisons of infant mortality. Paediatr Perinat Epidemiol. 2002;16(1):16–22.
6. Joseph KS, Liu S, Rouleau J, Lisonkova S, Hutcheon JA, Sauve R, et al. Influence of definition based versus pragmatic birth registration on international comparisons of perinatal and infant mortality: Population based retrospective study. BMJ (Online). 2012;344(7847).
7. Mohangoo AD, Blondel B, Gissler M, Velebil P, Macfarlane A, Zeitlin J. International comparisons of fetal and neonatal mortality rates in high-income countries: Should exclusion thresholds be based on birth weight or gestational age? PLoS ONE 2013, 8(5)p. e64869
Table 10Cause-specific infant mortality rates among selected high-income countries, 1995–2005
Gestational age (weeks)/ Birth weight (grams)
Canada USA Denmark Finland Norwaya Sweden
CA Imm-rel Other CA Imm-rel Other CA Imm-rel Other CA Imm-rel Other CA Imm-rel Other CA Imm-rel Other
GA ≥22 1.32 1.12 2.19 1.40 1.66 2.93 1.41 1.07 1.54 1.27 0.98 1.30 1.11 0.39 1.92 1.16 0.51 1.62
≥28 1.16 0.20 1.65 1.27 0.27 2.25 1.37 0.32 1.37 1.24 0.20 1.07 1.08 0.11 1.32 1.11 0.13 1.27
≥32 1.04 0.10 1.52 1.14 0.14 2.04 1.29 0.16 1.30 1.14 0.09 0.98 0.99 0.05 1.15 1.00 0.06 1.12
≥37 0.72 0.06 1.30 0.80 0.08 1.73 1.05 0.10 1.13 0.81 0.04 0.82 0.69 0.04 1.00 0.67 0.03 0.93
BW ≥500 1.30 0.94 2.07 1.39 1.32 2.82 1.42 0.96 1.48 1.26 0.82 1.24 1.09 0.33 1.81 1.04 0.42 1.48
≥1,000 1.15 0.19 1.67 1.26 0.25 2.24 1.37 0.30 1.34 1.21 0.18 1.06 1.04 0.11 1.32 0.98 0.12 1.21
≥1,500 1.03 0.11 1.54 1.11 0.15 2.09 1.24 0.13 1.26 1.09 0.10 1.00 0.93 0.06 1.18 0.87 0.07 1.08
All live births
1.42 1.41 2.40 1.45 2.14 3.11 1.42 1.11 1.53 1.26 0.98 1.28 1.10 0.41 1.99 1.04 0.49 1.53
Rates are expressed per 1,000 live births
CA denotes congenital anomalies and Imm-rel denotes immaturity-related causes of infant death
a
Norway data for all BW and GA categories is from 1996–2005
All calculations exclude live births with unknown birth weight and unknown gestational age ICD-10 codes used for CA: Q00-Q99
ICD-10 codes used for Immaturity-related conditions: D58.9, P01.3–P01.5, P01.8–P01.9, P02.7, P05.0–P05.9, P07.0–P07.3, P10.2, P22.0–P22.9, P25.0–P25.8, P26.0– P26.9, P27.0–P27.9, P28.0–P28.9, P29.0-29.2, P29.4–P29.9, P52.0–P52.3, P57.8–P57.9, P58.0-P58.9, P59.0–P59.9, P77, P78.0, P80.0, P91.1–P91.2, P91.8, P94.1–P94.9, P96.0, P96.3–P96.5
ICD-10 codes used for other conditions: rest of A000 - Y899
8. MacDorman M, Mathews T. Behind international rankings of infant mortality: How the United States compares with Europe. Int J Health Services. 2010;40(4):577–88.
9. Arntzen A, Andersen AMN. Social determinants for infant mortality in the Nordic countries, 1980-2001. Scand J Public Health. 2004;32(5):381–9. 10. Jørgensen T, Mortensen LH, Andersen AMN. Social inequality in fetal and
perinatal mortality in the Nordic countries. Scand J Public Health. 2008;36(6):635–49.
11. Hagberg B, Hagberg G, Zetterstrom R. Decreasing perinatal mortality–increase in cerebral palsy morbidity. Acta Paediatr Scand. 1989;78(5):664–70.
12. Public Health Agency of Canada. Canadian perinatal health report. 2008th ed. Canada: Minister of Public Works and Government Services; 2008. 13. Martin JA. United States vital statistics and the measurement of gestational
age. Paediatr Perinat Epidemiol. 2007;21 Suppl 2:13–21.
14. Joseph KS, Huang L, Liu S, Ananth CV, Allen AC, Sauve R, Kramer MS. Reconciling the high rates of preterm and postterm birth in the United States. Obstet Gynecol. 2007;109(4):813–22.
15. Qin C, Dietz PM, England LJ, Martin JA, Callaghan WM. Effects of different data-editing methods on trends in race-specific preterm delivery rates, United States, 1990-2002. Paediatr Perinat Epidemiol. 2007;21 Suppl 2:41–9. 16. Høgberg U, Larsson N. Early dating by ultrasound and perinatal outcome
-A cohort study. -Acta Obstet Gynecol Scand. 1997;76(10):907–12. 17. Breslow NE, Day NE. Statistical methods in cancer research. volume I - the
analysis of case-control studies. IARC Sci Publ. 1980;32:5–338. 18. Kirby RS. International comparisons of perinatal indicators. Br Med J.
2012;344:e477.
19. Sepkowitz S. International rankings of infant mortality and the United States’ vital statistics natality data collecting system: Failure and success. Int J Epidemiol. 1995;24(3):583–8.
20. Fenton AC, Field DJ, Mason E, Clarke M. Attitudes to viability of preterm infants and their effect on figures for perinatal mortality. Br Med J. 1990;300(6722):434–6.
21. Ehrenthal DB, Wingate MS, Kirby RS. Variation by state in outcomes classification for deliveries less than 500 g in the United States. Matern Child Health J. 2011;15(1):42–8.
22. Cnattingius S, Villamor E, Johansson S, Edstedt Bonamy AK, Persson M, Wikström AK, et al. Maternal obesity and risk of preterm delivery. J Am Med Assoc. 2013;309(22):2362–70.
23. Wilcox A, Skjaerven R, Buekens P, Kiely, J. Birth weight and perinatal mortality: A comparison of the United States and Norway. J Am Med Assoc. 1995;273(9):709–11.
24. Papiernik E, Zeitlin J, Delmas D, Draper ES, Gadzinowski J, Künzel W, et al. Termination of pregnancy among very preterm births and its impact on very preterm mortality: Results from ten European population-based cohorts in the MOSAIC study. BJOG. 2008;115(3):361–8.
25. Joseph KS, Kinniburgh B, Hutcheon JA, Mehrabadi A, Basso M, Davies C, et al. Determinants of increases in stillbirth rates from 2000 to 2010. CMAJ. 2013;185(8):E345–51.
26. Ananth CV. Menstrual versus clinical estimate of gestational age dating in the United States: Temporal trends and variability in indices of perinatal outcomes. Paediatr Perinat Epidemiol. 2007;21 Suppl 2:22–30. 27. Mathews TM, MacDorman MF. Infant mortality statistics from the 2005
period linked Birth/Infant death data set. National vital statistics reports; 2008 vol 57 (2): 1-28. Hyattsville, MD: National Center for Health Statistics
Submit your next manuscript to BioMed Central and take full advantage of:
• Convenient online submission
• Thorough peer review
• No space constraints or color figure charges
• Immediate publication on acceptance
• Inclusion in PubMed, CAS, Scopus and Google Scholar
• Research which is freely available for redistribution
Submit your manuscript at www.biomedcentral.com/submit