Linear Optimization Approach to Estimation of
Food Needs in
South Halmahera Islands
Syamsul Bahri, Bambang Pramudya, Sutrisno, Emmy DarmawatiAbstract: This study aims to estimate food needs to support supply chain management in South Halmahera Regency. The survey method was used to collect population data and level data and consumption patterns. Estimates of population development were analyzed using logistic models with limiting constants, while food requirements were analyzed using a linear optimization approach with a consumption level objective function greater than or equal to 2200 kcal. The nutritional adequacy rate (RDA) and the proportion of types of food are functional. Optimization for the estimation of food needs based on population growth and consumption patterns can be done with a linear approach with a relatively deviation rate of 0.1%. The need for carbohydrate sources, especially rice, based on existing conditions shows a fairly high number, balance of needs and rice production in 2015 amounted to 3.39, which means a very large deviation, this balance sheet decreases when using scenario 1 estimation of local food diversification policies with a balance sheet 2.45. The rice production deficit will increase every year if the increase in production is not carried out. Food supply from outside the area becomes a necessity and the management of the food supply chain will be helped by estimates that have been made.
Index Items: Patterns of consumption, distribution, food security, optimization
1. INTRODUCTION
Food security is an integrated food economic system consisting of various subsystems. Food security contains at least two main elements, namely adequate food availability and people's accessibility to adequate food, where both elements are absolutely fulfilled to achieve the health and welfare of the community. Food security is an integral part of the dimensions of availability, accessibility and stability in food prices [1]. The Food Security Council (DKP) together with the World Food Program (WFP) has formulated food security indicators which are grouped into three factors, namely factors of availability, access, and utilization of food [8]. Thus, it can be said that the food security system consists of three main subsystems, namely the availability, access and absorption of food. Food availability must be able to provide enough food which is defined as the number of calories needed for an active and healthy life.
The ineffectiveness of the distribution of food in the archipelago to reach all regions of consumers, especially in areas that have problems in terms of food supply at certain times. The lack of food storage in each village has led to low food availability, food access and consumption at the household and individual level. Most of the islands still have problems with the means of transportation infrastructure, information and procurement of food stocks, development of marketing and security of food distribution channels.
The movement of information as one of the basic elements in supply chain management must be a priority and is needed for planning and implementing supply chain
management. One of the important information in the logistics distribution of strategic commodities (food) is an estimate of the needs of each region.
With a linear optimization approach supported by estimation of population development using time series techniques using a logistic model, the food deficit in each region in South Halmahera Regency in a given year period then becomes a reference for supply chain management strategic planning
This study aims to estimate food requirements for each region in South Halmahera Regency as dynamic information to support the management of food supply chains.
2. LITERATURE REVIEW 2.1 Food Consumption
Food consumption expressed in kilocalories (kcal) per capita per day is a key variable used to measure and evaluate the evolution of global and regional food situations [16]. Food absorption is the use of food for healthy living needs which includes energy and nutrition needs, water, and environmental health. The effectiveness of food absorption depends on household / individual knowledge, sanitation and availability of water, health facilities and services, as well as nutrition counseling and maintenance of children under five). Food absorption refers to household food use and the ability of individuals to absorb and metabolize nutrients [8].
An assessment of ideal food consumption is indicated based on the number of nutritional adequacy (RDA) which includes calorie adequacy (more than 2,200 kcal / capita days) and adequate protein which according to WHO since
1985 recommends the ideal protein requirement for adults of 0.6 g / kg body weight. But along with the development of healthy lifestyles, the participation rate of protein for energy supply is increasing along with the increase in
221
protein consumption. The study conducted by the New Zaeland health ministry noted an increase in the proportion of protein participation as a source of energy from 14% to 16% in a period of 20 years [10].
Food consumption and diet are very dependent on what types of food are available and can be accessed sustainably, therefore each region has a varied diet. Important factors that influence the food supply system are production systems which include the availability of land for production [7]. The land for rice production consists of paddy fields with technical irrigation systems, non-technical irrigation, simple irrigation, rainfed, tides and other paddy fields. As a result of infrastructure development that requires extensive land, in some areas land conversion from agriculture to non-agricultural areas such as industrial activities, housing, roads and so on occurs.
Other factors that determine the food production system are climate stress, productivity (varieties), application of technology, cropping indexes, pest disturbances and natural disasters such as floods or droughts [15]. This component is very likely to interact within its own sub-system or may also interact with other components outside the sub-system. The food demand sub-system consists of the need for consumption, the food industry and seeds / seeds. Food needs for consumption are the biggest part in determining the number of requests, and this component is influenced by the rate of population growth, the level of consumption and the occurrence of consumption diversification in the community.
In the archipelago, with small islands spreading, with limited land carrying capacity where water resources and the structure of thin soil layers and layers of rock formations are a challenge for the development of rice-based food commodities. In environmental conditions like this, to meet the need for carbohydrate-sourced food, farmers choose to plant crops that are relatively resistant to water stress and develop well in thin solum such as cassava.
Pressure due to the environment that lasted for a long time, established policies on lifestyle and patterns of consumption from generation to generation into local wisdom in the food sector. The wisdom in question is the diversification of non-rice-based carbohydrate foods that can be found both in daily life, as well as in traditional
ceremonies, such as those found in the islands of South Halmahera.
On the other hand, the archipelago is rich in marine and coastal resources in the form of marine products (fish, shrimp and shellfish). So it is natural to refer to the data on the food consumption pattern of the people of South Halmahera, indicating that rice consumption is smaller than the national average, but the fish consumption rate is actually much higher than the national average fish consumption.
2.2 Estimating of Food Needs
The need for food is calculated based on individual consumption of people living in one area, various methods are often used to analyze individual consumption patterns including the method of the NCI (National Cancer Institute Method) developed by Janet at al in 2008 which calculates the level of daily consumption through individual intake in a 24-hour cycle [9], besides that there is the LNN Method (Normal-Normal Logistic) developed by Tooze et al in 2006, but for multi food consumption / intake then according to Paul et al, the method uses the Model-Then- approach Add is better because of the correlation between the types of food consumed with various consumption patterns [12].
2.1. Linear Program for Optimizing Food Needs
Optimization aims to improve efficiency, using limited resources to achieve goals. Arsham stated that the optimization model has at least 2 elements, namely the objective function and the limiting function (constraints) which are expressed in mathematical forms, which contain values for decision making [2].
3. RESEARCH METHODS
This study used a survey method in the form of limited observation and interviews and was conducted from April to July 2015, in South Halmahera Regency, North Maluku Province. Updating secondary data for years 2016 and 2017. Data needed for estimating food needs are minimum population development data for the past five years and data on per capita expenditure and food consumption in the last year. The data obtained is then processed according to the estimation flow chart of the research food requirements in Fig. 1.
Fig 1. Flow Chart for Estimating of Food Needs
The results of estimating food needs are then a reference for strategic chain management planning which includes the
location and capacity of warehousing facilities,
transportation modes and information systems.
4. RESULTS AND DISCUSSION
The amount of consumption or expenditure made by a household illustrates the level of welfare of the household concerned. The higher expenditure made by a household for non-food needs, indicates an increase in the welfare of the household concerned. As a measure, if the proportion
of food expenditure is more than 60 percent of total expenditure, then the level of welfare can be said to be still low.
Broadly speaking, the higher the proportion of expenditures used for food consumption, the expenditure on health, education and others also decreases. The per capita expenditure of residents of South Halmahera based on the ratio of expenditure to food groups and non-food groups is 53:47. This shows that the priority of expenditure is aimed at fulfilling the most basic needs, namely food.
Table 1. The composition of carbohydrates, fat, protein and consumption in South Halmahera [4], [6], [13], is processed
Foods Energy Content (kcal/g) Consumption
C.hydrate Fat Protein gram/cap day
Rice 3.40 0.10 0.24 165.62
Corn 3.08 0.17 0.25 25.33
Wheat 2.92 0.08 0.32 35.00
Tubers 0.54 0.02 1.72 215.02
Nuts 1.01 1.40 1.40 8.06
Meat 1.43 2.44 0.48 0.85
Egg 0.03 1.38 0.57 8.24
Fish 2.26 1.98 1.56 56.79
Milk 2.35 2.13 0.50 8.24
Vegetables 0.10 0.03 0.03 68.04
Fruits 0.86 0.03 0.00 27.67
Fat/oil 0.00 8.75 0.00 31.14
The most proportion of food consumption is in the group of grains, tubers and fish. The food groups included in the
largest proportion of calories consumption are grains, fish tubers and oils and fats. Food energy values based on net
metabolisable energy (NME) calculations, NME content of food is calculated as the amount of fat (37 kJ/g), protein (13 kJ/g), available carbohydrates (16 kJ/g), fully fermented carbohydrates (8 kJ/g), alcohol (26 kJ/g) and other components [11]. The composition of carbohydrates, protein, fat and consumption per capita per day are presented in Table 1
4.1 Estimation of Population Development
To maintain an adequate level of food availability, inventory management must be done with good planning. This can be done if information about food needs for each region and period of time can be estimated properly. Various common methods are used to forecast food needs (generally using population change trends and community consumption patterns).
The development of the population of South Halmahera Regency from 2005 to 2012 was used to estimate population development for 2013 to 2020. The estimation was carried out using the time series method with a logistic curve or
s-curve growth model better known as the Pearl-Reed s-curve. The rational concept of building a logistical model is very simple. We assume that given the population "N" has a natural limit "K" based on geographical boundaries, food or scarcity of water resources, or other restrictions [6], this curve is a modification of the exponential curve and more commonly used the form of equations:
𝑃𝑡= 𝑃𝑧
1+(𝑃𝑧
𝑃0−1)𝑒−𝐺(𝑡𝑖−𝑡0)
(1)
Where,
Pz = Maximum Population (assuming 1,000,000 people are set)
Po = Initial population (2005) G = growth constant (= 1,455) t = Time (year)
In this form the logistic curve always has a limit on Pz, and G as a negative constant. This equation is used to estimate the population for the coming year assuming a constant growth constant.
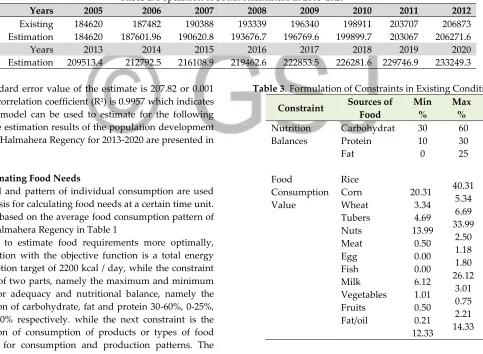
Table 2. Population of South Halmahera in 2005-2020
Years 2005 2006 2007 2008 2009 2010 2011 2012
Existing 184620 187482 190388 193339 196340 198911 203707 206873
Estimation 184620 187601.96 190620.8 193676.7 196769.6 199899.7 203067 206271.6
Years 2013 2014 2015 2016 2017 2018 2019 2020
Estimation 209513.4 212792.5 216108.9 219462.6 222853.5 226281.6 229746.9 233249.3
The standard error value of the estimate is 207.82 or 0.001
and the correlation coefficient (R2) is 0.9957 which indicates
that the model can be used to estimate for the following year. The estimation results of the population development of South Halmahera Regency for 2013-2020 are presented in Table 2.
4.2 Estimating Food Needs
The level and pattern of individual consumption are used as the basis for calculating food needs at a certain time unit. Data set based on the average food consumption pattern of South Halmahera Regency in Table 1
In order to estimate food requirements more optimally, optimization with the objective function is a total energy consumption target of 2200 kcal / day, while the constraint consists of two parts, namely the maximum and minimum values for adequacy and nutritional balance, namely the proportion of carbohydrate, fat and protein 30-60%, 0-25%, and 10-30% respectively. while the next constraint is the proportion of consumption of products or types of food adjusted for consumption and production patterns. The problem formulation is presented in Table 3.
Table 3. Formulation of Constraints in Existing Conditions
Constraint Sources of Food
Min %
Max %
Nutrition Balances
Carbohydrat Protein Fat
30 10 0
60 30 25
Food
Consumption Value
Rice Corn Wheat Tubers Nuts Meat Egg Fish Milk Vegetables Fruits Fat/oil
20.31
3.34 4.69 13.99
0.50 0.00 0.00 6.12 1.01 0.50 0.21 12.33
40.31 5.34 6.69 33.99
2.50 1.18 1.80 26.12
3.01 0.75 2.21 14.33
To get an idea of the level of balance in nutritional adequacy if there is a change in the pattern and level of food consumption, optimization is carried out by using a scenario, namely by changing the proportion of the consumption of rice, tubers and fish. Scenario 1 is the
proportion of rice consumption (20.31-30.31%), tubers (23.99-33.99%) and Fish (16.12-26.12%). While scenario 2 is the proportion of rice consumption (30.31-40.31%), tubers (13.99-23.99%) and fish (6.12-16.12%).
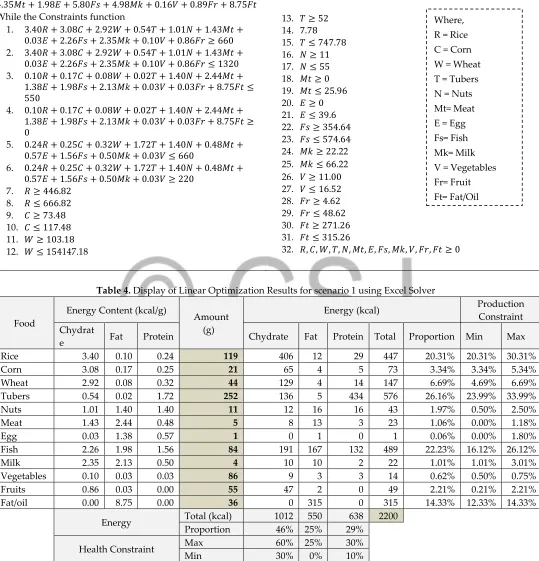
Then the linear model for optimizing the food needs of South Halmahera Regency using the first scenario is as
follows:
Purpose function
Maximize 𝑍: 3.74𝑅 + 3.50𝐶 + 3.32𝑊 + 2.28𝑇 + 3.81𝑁 +
4.35𝑀𝑡 + 1.98𝐸 + 5.80𝐹𝑠 + 4.98𝑀𝑘 + 0.16𝑉 + 0.89𝐹𝑟 + 8.75𝐹𝑡 While the Constraints function
1. 3.40𝑅 + 3.08𝐶 + 2.92𝑊 + 0.54𝑇 + 1.01𝑁 + 1.43𝑀𝑡 + 0.03𝐸 + 2.26𝐹𝑠 + 2.35𝑀𝑘 + 0.10𝑉 + 0.86𝐹𝑟 ≥ 660
2. 3.40𝑅 + 3.08𝐶 + 2.92𝑊 + 0.54𝑇 + 1.01𝑁 + 1.43𝑀𝑡 + 0.03𝐸 + 2.26𝐹𝑠 + 2.35𝑀𝑘 + 0.10𝑉 + 0.86𝐹𝑟 ≤ 1320
3. 0.10𝑅 + 0.17𝐶 + 0.08𝑊 + 0.02𝑇 + 1.40𝑁 + 2.44𝑀𝑡 + 1.38𝐸 + 1.98𝐹𝑠 + 2.13𝑀𝑘 + 0.03𝑉 + 0.03𝐹𝑟 + 8.75𝐹𝑡 ≤ 550
4. 0.10𝑅 + 0.17𝐶 + 0.08𝑊 + 0.02𝑇 + 1.40𝑁 + 2.44𝑀𝑡 + 1.38𝐸 + 1.98𝐹𝑠 + 2.13𝑀𝑘 + 0.03𝑉 + 0.03𝐹𝑟 + 8.75𝐹𝑡 ≥ 0
5. 0.24𝑅 + 0.25𝐶 + 0.32𝑊 + 1.72𝑇 + 1.40𝑁 + 0.48𝑀𝑡 + 0.57𝐸 + 1.56𝐹𝑠 + 0.50𝑀𝑘 + 0.03𝑉 ≤ 660
6. 0.24𝑅 + 0.25𝐶 + 0.32𝑊 + 1.72𝑇 + 1.40𝑁 + 0.48𝑀𝑡 + 0.57𝐸 + 1.56𝐹𝑠 + 0.50𝑀𝑘 + 0.03𝑉 ≥ 220
7. 𝑅 ≥ 446.82
8. 𝑅 ≤ 666.82
9. 𝐶 ≥ 73.48
10. 𝐶 ≤ 117.48
11. 𝑊 ≥ 103.18
12. 𝑊 ≤ 154147.18
13. 𝑇 ≥ 52
14. 7.78
15. 𝑇 ≤ 747.78
16. 𝑁 ≥ 11
17. 𝑁 ≤ 55
18. 𝑀𝑡 ≥ 0
19. 𝑀𝑡 ≤ 25.96
20. 𝐸 ≥ 0
21. 𝐸 ≤ 39.6
22. 𝐹𝑠 ≥ 354.64
23. 𝐹𝑠 ≤ 574.64
24. 𝑀𝑘 ≥ 22.22 25. 𝑀𝑘 ≤ 66.22 26. 𝑉 ≥ 11.00
27. 𝑉 ≤ 16.52
28. 𝐹𝑟 ≥ 4.62
29. 𝐹𝑟 ≤ 48.62
30. 𝐹𝑡 ≥ 271.26
31. 𝐹𝑡 ≤ 315.26
32. 𝑅, 𝐶, 𝑊, 𝑇, 𝑁, 𝑀𝑡, 𝐸, 𝐹𝑠, 𝑀𝑘, 𝑉, 𝐹𝑟, 𝐹𝑡 ≥ 0
Table 4. Display of Linear Optimization Results for scenario 1 using Excel Solver
Food
Energy Content (kcal/g)
Amount (g)
Energy (kcal) Production
Constraint Chydrat
e Fat Protein Chydrate Fat Protein Total Proportion Min Max
Rice 3.40 0.10 0.24 119 406 12 29 447 20.31% 20.31% 30.31%
Corn 3.08 0.17 0.25 21 65 4 5 73 3.34% 3.34% 5.34%
Wheat 2.92 0.08 0.32 44 129 4 14 147 6.69% 4.69% 6.69%
Tubers 0.54 0.02 1.72 252 136 5 434 576 26.16% 23.99% 33.99%
Nuts 1.01 1.40 1.40 11 12 16 16 43 1.97% 0.50% 2.50%
Meat 1.43 2.44 0.48 5 8 13 3 23 1.06% 0.00% 1.18%
Egg 0.03 1.38 0.57 1 0 1 0 1 0.06% 0.00% 1.80%
Fish 2.26 1.98 1.56 84 191 167 132 489 22.23% 16.12% 26.12%
Milk 2.35 2.13 0.50 4 10 10 2 22 1.01% 1.01% 3.01%
Vegetables 0.10 0.03 0.03 86 9 3 3 14 0.62% 0.50% 0.75%
Fruits 0.86 0.03 0.00 55 47 2 0 49 2.21% 0.21% 2.21%
Fat/oil 0.00 8.75 0.00 36 0 315 0 315 14.33% 12.33% 14.33%
Energy Total (kcal) 1012 550 638 2200
Proportion 46% 25% 29%
Health Constraint Max 60% 25% 30%
Min 30% 0% 10%
Overall the results of optimization for food consumption in South Halmahera Regency are presented in Fig. 2. Food consumption as presented in Fig. 2 shows that if the pattern of food consumption changes as a result of a policy of diversifying culture-based food consumption and the
potential of the South Halmahera Regency, there will be a decrease in rice consumption per day from 165.62 g/cap to
119.47 g/cap. Conversely, if there is a consumption pattern that follows the trend of rice consumption in general which is increasing along with the increase in the standard of
Where, R = Rice C = Corn W = Wheat T = Tubers N = Nuts Mt= Meat E = Egg Fs= Fish Mk= Milk V = Vegetables Fr= Fruit Ft= Fat/Oil
living of the community, there will be an increase in rice consumption per day which is very high reaching 206.93
g/cap.
Figure 2. Food Consumption in South Halmahera
The results of the optimization in Table 4 column Amount (g) and estimated population development data for 2015-2020 in Table 3 are then used to estimate food requirements
each year. Furthermore, the results of the calculation of food needs based on the results of scenario 1 optimization are presented in Table 5
Table 5. Results of Estimating South Halmahera food requirements in tons (2015-2020)
Food Jumlah (g/cap.day)
2015
Poduction Needs 2016 2017 2018 2019 2020 Rice 119.47 3,840.85 9,424 9,570 9,718 9,867 10,019 10,171
Corn 20.99 1,656 1,682 1,708 1,734 1,761 1,787
Wheat 44.33 3,497 3,551 3,606 3,662 3,718 3,774
Tubers 252.46 61,053 19,914 20,223 20,536 20,852 21,171 21,494
Nuts 11.40 899 913 927 941 956 970
Meat 5.38 424 431 438 444 451 458
Egg 0.65 52 52 53 54 55 56
Fish 84.31 45,240.70 6,650 6,753 6,858 6,963 7,070 7,178
Milk 4.46 352 357 363 369 374 380
Vegetables 85.55 6,748 6,853 6,959 7,066 7,174 7,283
Fruits 54.63 4,309 4,376 4,444 4,512 4,581 4,651
Fat/oil 36.03 2,842 2,886 2,931 2,976 3,021 3,067
The need for carbohydrate sources, especially rice, based on existing conditions shows a fairly high number, the balance ratio of needs and rice production in 2015 that was to 3.39, which means a very large deficiency, this balance ratio will decreases when using optimization of scenario 1, that local food diversification policy with a balance ratio is 2.45 . Although devisit rice is still quite large, other carbohydrate sources such as tubers and fish are abundant. The estimation results can be used to plan logistics activities. Some types of food show a large number of needs while the production capacity of regions is very low (rice, oil, vegetables, beans) and even some types of food are not produced (flour, eggs, and milk). The availability of these types of commodities is very dependent on supply from outside the region. So far, food supplies have been imported from the islands of Java (Surabaya) and Sulawesi (Makassar and Manado) through several doors (multygate)
The flow of logistics to the district center of South Halmahera (Bacan Island) is relatively smooth, especially through Ternate gates with the frequency of loading and unloading people 2-3 times a day with sufficient capacity, but different from the condition of inter-island logistical flows in South Halmahera Regency with the number of islands inhabited by 40 islands which spread almost evenly within the region. In normal sea conditions, the frequency of loading and unloading is 1 to 2 times a week by means of transportation using an ant fleet (small capacity), this condition causes supply to be hampered and distribution costs to be very large.
The estimation of food requirements for South Halmahera Regency is used to estimate sub-district food needs in the area of South Halmahera Regency based on the distribution of population.
Of the 30 sub-districts in South Halmahera regency, only Gane Timur sub-district and Gane Middle East sub-district
1 6 5 .6 2 2 5 .3 3 35 2 1 5 .0 2 8 .0 6 0 .8 5 8 .2 4 5 6 .7 9 8 .2 4 6 8 .0 4 2 7 .6 7 3 1 .1 4 1 1 9 .4 7 2 0 .9
9 44.3
3 2 5 2 .4 6 1 1 .4 0 5 .3 8 0 .6 5 8 4 .3 1 4 .4 6 8 5 .5 5 5 4 .6 3 3 6 .0 3 2 1 0 .1 7 2 0 .9
9 35.0
0 1 5 3 .7 1 1 0 .6 5 5 .9
7 15.7
7 6 1 .1 4 1 3 .3 0 9 3 .6 9 2 8 .0 2 3 6 .0 3 0 50 100 150 200 250 300 con su m p tio n (g/cap d ay
) existing data
scenario 1
scenario 2
experienced a surplus of rice production, the rest (28 sub-districts) experienced a deficit. The total deficit for rice commodities for 2015 reached 9,223.21 tons which must be imported from outside the Regency area even from outside the province because rice production at the provincial level also experienced a deficit. If the calculation is based on the needs of rice according to the first scenario, the deficit in demand for rice consumption in 2015 will decrease to 5.582.96 tons or consumption of rice can be reduced by 3,640.25 tons
The results of estimating food needs based on consumption figures are then used as basic information to manage food distribution to remote islands and inland areas using supply chain management.
CONCLUSION
Optimization for the estimation of food needs based on population growth and consumption patterns can be done using a linear approach. Need estimation results are used to determine the amount of deficit that occurs in the future if the constant production rate is considered constant, food availability and needs especially rice deficit up to 9,223.21 tons in 2015, but if the food consumption pattern changes as a result of diversifying cultural consumption the potential of the South Halmahera Regency, there will be a decrease in rice consumption per day from 165.62 g / cap to 119.47 g / cap or equal to 5,582.96 tons. This need will increase every year if production increases are not carried out. Food supply from outside the area becomes a necessity and the management of the food supply chain will be helped by estimates that have been made.
References
[1] Arifin, B., Food Institutional Economy. LP3ES Library. Jakarta. 2005.
[2] Arsham, H., Deterministic Modeling: Linear
Optimization with Applications. Johns Hopkins Carey Business School. http://home.ubalt.edu/ ntsbarsh / index.html. 2002.
[3] Bozarth, C.C., and Handfield, R.B., Introduction to Operations and Supply Chain Management. Student Value Edition. New Jersey: Pearson / Prentice Hall Inc. 3th edition. 2006.
[4] South Halmahera Regional Planning Agency. DDA, Inkesra, RAD and Regional Economic Indicators. 2016 [5] Boretos, G.P., Regional Strategic Documents of South
Halmahera Regency for 2014-2016:S-curves and their
Applications in Marketing, Business, and the Economy. MRA's Alert! Magazine. February 2012
https://www.forecastingnet.com/Alert_
0212_34-39.pdf. 2012
[6] Budiyanto, M.A.K., Basics of Nutrition.
Muhammadiyah University of Malang. Malang. 2002.
[7] Djojomartono, M., B. Pramudya, S. Pertiwi., I.W. Astika, E. Darmawati, and M. Solahudin. Analysis of
Planning for National National Rice Supply Systems.
Collaboration on Project Section for Development
Planning and Evaluation of Agricultural
Development, Planning and Finance Bureau, Ministry
of Agriculture with Faculty of Agricultural
Technology, IPB. 2002
[8] Food Security Council of the Republic of Indonesia.
Indonesian Food Insecurity Map (FIA). Food Security
Council Secretariat. Jakarta. 2005.
[9] Janet AT, Douglas M., Kevin WD, Laurence SF, Susan M., Krebs-Smith, Amy FS, Patricia MG, Raymond J., and Victor K., 2008. A new method for estimating the
usual intake of episodically-consumed foods with application to their distribution. National Institute for
Health. 2008. Availlable at
http://www.ncbi.nlm.nih.gov/pmc.
[10] New Zealand Ministry of Health, Food and Nutrition
Guidelines for Healthy Adults. A background paper.
Wellington. 2003. Availlable at
https://www.health.govt.nz
[11] Livesey, G., A Perspective on the Food Energy Standards
for Nutrition Labeling, Review Article. British Journal of
Nutrition (2001), 85, 271-287. Available at
https://www.cambridge.org/
core/services/aop-cambridgecore/content/view/5B49F45E2CC07AA3964 30A0D2555C9AA/ S0007114501000381a.pdf
[12] Paul W. G., Hilko V.D.V., Sven K., Arnold L.M.D., Kevin W.D., Heiner B., and Jacob V.K., A Comparison
of Simulation Methods for Estimating Usual Intake Distribution for Episodically Consumed Foods. External
Scientific Report. Wageningen. 2012. Available at http://www.efsa.europa.eu/de ..
[13] Soedioetama, A.D., Nutrition Science. Dian Rakyat. Jakarta, 1976.
[14] Suthamphong, A., Identifying an Optimal Facility
Location For a Factory. Project report for the degree of
MSc in supply chain management. Department of Industrial Management, Assumption University. 2007 https://jscm.au.edu/index.php/sep2007/article/view/85 /53
[15] Ridwan, T., Supriatna S. and Purwani, E.Y., Simulation
of Dynamic Models Availability of Sago Supporting Food Security: The Case of Papua. Proceedings of the
National Seminar on Postharvest Innovative
Technology for Agriculture-Based Industrial
Development Center for Agricultural Postharvest Research and Development. 2008
[16] Word Healh Organization, Global and regional food
consumption patterns and trends, 2006. Available at
http://www.who.int/nutrition/topics/3foodconsumpti on/en/html index
Authors
Syamsul Bahri
Department of Agricultural Technology Khairun University, Ternate
Phone +6285240222099
Email: [email protected]
Bambang Pramudya
Department of Mechanical and Biosystem Engineering Bogor Agricultural Uniiversity, Bogor
Phone +628121105456
Sutrisno
Department of Mechanical and Biosystem Engineering Bogor Agricultural Uniiversity, Bogor
Phone +62811113143
Email: [email protected]
Emy Darmawati
Department of Mechanical and Biosystem Engineering Bogor Agricultural Uniiversity, Bogor
Phone +6281585780751
![Table 1. The composition of carbohydrates, fat, protein and consumption in South Halmahera [4], [6], [13], is processed](https://thumb-us.123doks.com/thumbv2/123dok_us/8397349.1685111/3.612.132.472.47.305/table-composition-carbohydrates-protein-consumption-south-halmahera-processed.webp)