_____________________________________________________________________________________________________
14(1): 1-10, 2018; Article no.ACRI.41208
ISSN: 2454-7077
Assessment of the Effects of Sleep Hours and
Academic Performance on Psychological Distress in
University Students
Victor Moses
1*and Godwin Augustina
21
Department of Educational Psychology and Counselling, Ahmadu Bello University, Zaria, Nigeria. 2
Department of Social Sciences, Taraba State University, Jalingo, Nigeria.
Authors’ contributions
This work was carried out in collaboration between both authors. Author VM designed the study, wrote the manuscript, collect and performed the statistical analysis of the data. Author GA managed the analyses of the study, literature searches and reviewed the manuscript. Both authors read and approved the final manuscript.
Article Information
DOI: 10.9734/ACRI/2018/41208 Editor(s): (1)Muge K. Davran, Associate Professor, Department of Agricultural Economics, Faculty of Agriculture, University of Cukurova, Adana, Turkey. (2) Sung-Kun Kim, Department of Natural Sciences, Northeastern State University, USA. Reviewers: (1) Hakan Usakli, Turkey . (2)Lawrence Jekwu Okoye, University of Maiduguri, Nigeria. Complete Peer review History: http://www.sciencedomain.org/review-history/24437
Received 26th February 2018 Accepted 30th April 2018 Published 4th May 2018
ABSTRACT
Like in other parts of the world, the extent of psychological distress among young adults in the Nigerian universities is worrisome with over 31.9% likely to have a severe mental disorder. It is a fact that a number of factors contribute to the problem. This article presents the results of a study designed to investigate the effects of sleep hours and academic performance on psychological distress among University students. The correlational research design was used and three hundred and eighty-five students (385 [male=200 and female= 185]) participated in the study. The data collected through questionnaire was analyzed using one-way analyses of variance at p<.05. The analysis was done using JMP version. 13.2. The results revealed significant effects of sleep hours on the psychological distress F (3,381) = 17.750, p<.001, with students sleeping an average of ≤ 4 hrs reporting significant distress level, t = 6.16, p<.001. Academic performance was found to predict psychological distress F (3,381) 381 = 6.864, p<.001, with performance below average predicting psychological distress positively, t = 4.09, p<.001. The study concludes that poor sleep quantity and academic performance below average may significantly predict psychological distress among the study sample. The outcome of this study, therefore, provides psychologists,
counsellors and educationist with the necessary information required to enable the development of an intervention that can help to encourage good sleep habit and improved academic performance to reduce psychological distress.
Keywords: Academic performance; psychological distress; sleep hours; undergraduate students.
1. INTRODUCTION
Entrance into a university or other tertiary education institutions is a joyous time; it can as well be a stressful life event for some students [1]. First-year students are particularly at-risk as they face a number of new stressors during the transitional period of starting a new life in university or college [2]. Just as all young adults, undergraduate students need to cope not only with psychological and psychosocial changes that are connected with the development of an autonomous personal life but also with the academic and social demands that they encounter in university studies in their preparation for professional careers. Therefore, the period of undergraduate education is a sensitive period in an individual’s life span. This period is regarded by many as important for developing systems and intervention methods that may prevent or reduce mental problems [3]. Evidence that suggests that university students are vulnerable to mental-health problems has generated increased public concern in many societies [4]. Previous studies suggest high rates of psychological morbidity, especially depression and anxiety among university students all over the world [2,5,6,7]. Edwards and Holden [8] found that among college students, seeking counselling services, psychological distress of anxiety and depression was ranked first and third as presenting problems, respectively.
Psychological distress is a state of emotional suffering characterized by symptoms of depression (e.g., lost interest; sadness; hopelessness) and anxiety (e.g., restlessness; feeling tense) [9]. It is an emotional disturbance that may affect the social functioning and day-to-day living of individuals [10]. Proponents of the stress-distress models posit that the defining features of psychological distress are the exposure to a stressful event that threatens the physical or mental health, the inability to cope effectively with this stressor and the emotional turmoil that results from this ineffective coping [11,12]. They argue that psychological distress vanishes when the stressor disappears or when an individual comes to cope effectively with this stressor [12].
Among university students, inadequate sleep is a pervasive problem for many and may have serious consequences on health and affect overall well-being. In one study, Victor and Abdulwahid [13] found that over 87% of undergraduate students in a Nigerian university reported not having adequate sleep at night and of this number, 29% majorly students within age range 23-38 reported below average academic performance. Aside academic performance, lack of sleep may additionally exacerbate psychiatric concerns, such as symptoms of psychological distress [14,15]. In fact, a change in sleep pattern is a key identifier of many mood disorders. Research has shown that around 90% of adults with symptoms of psychological distress complain of impaired sleep, and it is the second most frequently reported consequence. Research has also revealed that individuals who report severe psychological distress is more likely to have sleep problems than an individual are with mild distress [16]. Of note, the relationship between sleep quantity and psychological distress appears to be bidirectional, as psychological distress results in disturbed sleep and sleep loss escalate the severity of psychological distress.
A previous study by Trockel, Barnes, and Egget [17] to evaluate health-related variables on academic performance found that sleep had the largest effect on semester GPA compared to the other health-related variables such as exercise, nutrition intake, mental health, and stress and time management. There was a significant relationship between sleep habits and higher
GPA. Long sleepers (sleep 9 or more hours a day) were found to achieve higher GPAs than
short sleepers (sleep 6 or fewer hours a day) [18].
Research on the relationship between emotional dispositions and academic performance among middle school students provides support for the conclusion that emotional regulation significantly contributes to grade-point averages of students, over and above the contribution made by cognition-related abilities [20].
Adolescents with depression are at increased risk of impairment in school and educational attainment [21]. Longitudinal research employing the California Healthy Kids Survey indicated that increasing sadness or hopelessness among students was related to subsequent declines in gains in test scores in reading, language, and mathematics [22].
Therefore, since students are at the core of learning process, a study tailored to their sleep
pattern, mental health and academic
performance is imperative as students themselves play central roles in advancing their own learning and acquiring enhanced academic achievement. It is on this basis that the study was undertaken to assess students’ sleep hours, and academic performance and to determine the extent they influence psychological distress. Another focus was to establish ideal sleep hours among the students to help improve their studies and distress.
2. METHODOLOGY
2.1 Design
The study used a correlation research design. The correlation research design was used to determine the relationship between two or more variables and to explore their implications for cause and effect.
2.2 Participants
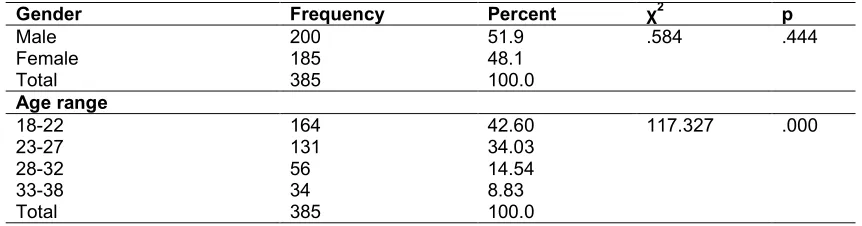
The study participants were three hundred and eighty-five undergraduate students of Ahmadu Bello University, Zaria, Nigeria, who voluntarily participated by filling questionnaires given to them. Of this number, 51.9% were males, while 48.1% were females. No significant difference in the number of male and female participants, χ2
(1) = .584, p = 0.444. There is a significant difference in the number of respondents based on age range, χ2 (3) = 117.327, p<.001 as the majority of the study participants (77%) were those from the age range 18–27. Participants from age range 28–38 constituted 23% of the
respondents. Table 1, shows the gender and age characteristics of the respondents.
2.3 Outcome Measure
The study used the Kessler Psychological Distress Scale (K10) [23,24] to measure psychological distress. The K10 scale involves 10 questions about emotional states, each with a five-level response scale. The measure can be used as a brief screen to identify levels of distress. The tool can be given to patients to complete. Each item is scored from one ‘none of the time’ to five ‘all of the time.’ Scores of the 10 items are then summed, yielding a minimum score of 10 and a maximum score of 50. Low scores indicate low levels of psychological distress, and high scores indicate high levels of psychological distress [25]. Reliability tests done on the K10 by Grande, Taylor and Wilson [26] showed the values of the kappa and weighted kappa scores ranged from 0.42 to 0.74, which indicates that K10 is a moderately reliable instrument. In the present study, reliability analysis conducted on the k10, which was administered to fifty Nigerian university students yielded a Cronbach α value of 0.753.
Item 4 on the Pittsburgh Sleep Quality Index (PSQI) was used to assess student’s sleep hours. It reads; how many hours of actual sleep do you get at night? (This may be different from the number of hours you spend in bed)? PSQI has an overall reported Cronbach α = 0.83 [27].
To determine student’s Academic Performance, the researcher used the student's current GPA. In the Nigerian higher-education system, student's GPA grades are categorized into four.
4.50 – 5.00 3.50 – 4.49 2.50 – 3.49 1.50 – 2.49
The respondents were required to honestly, tick a single option that represents their present GPA status. Responses were interpreted as thus; 4.50–5.00 = excellent, I am probably one of the very best, 3.50–4.49 = above average, 2.50–3.49 = average, 1.50–2.49 = below average.
2.4 Data Collection
Table 1. Descriptive analysis of respondent's demography
Gender Frequency Percent χ2 p
Male 200 51.9 .584 .444
Female 185 48.1
Total 385 100.0
Age range
18-22 164 42.60 117.327 .000
23-27 131 34.03
28-32 56 14.54
33-38 34 8.83
Total 385 100.0
of the respondents residing in the hostels. Two research assistants assisted the investigator in the administration and collection of the instruments. Overall, data collection lasted for three days. All the three hundred and eighty-five questionnaires distributed were properly filled in, returned and considered useful for research purpose.
2.5 Data Analysis
The data were analyzed using descriptive statistics and one-way analysis of variance on JMP ver. 13.2. A standard P value < 0.05 was considered statistically significant. Firstly, a bivariate correlation analysis for the study variables was done to examine how the dependent and independent variables interact. The result showed a significant negative relationship between academic performance and psychological distress, r = -.194, p<.001; and between sleep hours and psychological distress,
r = -.284, p<.001. The relationship between sleep hours and academic performance was positive, but not significant in the study sample (see Table 2).
3. RESULTS
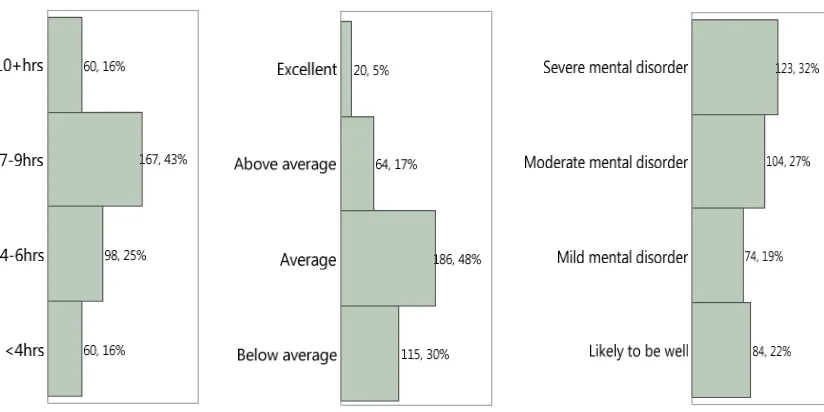
Fig. 1 showed the frequency and percentage response to sleep hours, academic performance and psychological distress. It showed that 60 students representing 16% of the respondents reported an average sleep < 4 hrs. About 25% reported average sleep between 4-6 hrs, 43% reported sleep between 7-9 hrs while 16% of the respondents reported sleep average above 10 hrs. Concerning academic performance, 30% reported performance below average, 48% reported average performance, 17%, above average, while only 5% reported excellent
performance. Analysis of participants’
psychological distress showed that 32% reported the likelihood of having the severe mental
disorder, 27% reported moderate mental
disorder, and 19% reported mild mental disorder, while 22% were likely to be well.
Result in Table 4 showed there is a significant effect of sleep hours on psychological distress in
university students, F (3,381) = 17.7501, p
<.001, R2 = 0.123, RMSE = 6.889. Respondents sleeping <4 hrs (32.400±0.889, 95% CI = 30.651-34.149) reported significant psychological distress, t = 6.16, p <.001. Expanded parameter estimate (see Table 5), showed that as sleep < 4hrs increases by a standard deviation, psychological distress will increase by 4.537 (95%CI = 3.089-5.985).
Conversely, sleeping an average of 7-9 hrs (24.934±0.533; 95% CI = 23.886-25.982) significantly reduces the distress level, t = -5.45, p < .001. Parameter estimate showed that as sleep 7-9 hrs increases by a standard deviation, psychological distress reduces by -2.929 (95% CI = -3.986- -1.872). Comparative
analysis using Tukey-Kramer HSD ordered
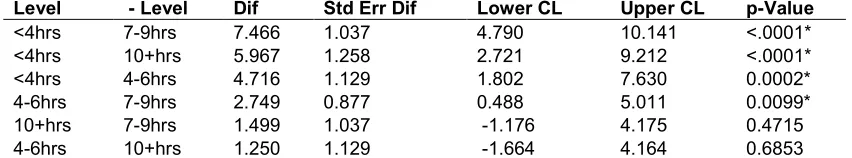
differences report of psychological distress by sleep hours (see Table 7), showed that a significant difference in psychological distress exists between sleeping <4 hrs and 7-9 hrs (7.466±1.037; 95% CI =4.790-10.141), p<.001. Also, between <4 hrs and 10+ hrs (5.967±1.258; 95% CI = 2.721-9.212,), p<.001, < 4hrs and 4-6 hrs (4.716±1.129; 95% CI = 1.802-7.630), p< .001, and 4-6 hrs and 7-9 hrs (2.749±0.877; 95% CI = 0.488-5.011, p = .009). Generally, therefore, sleeping < 4 hrs or 4-6 hrs may not favour student’s psychological wellbeing as sleeping 7-9hrs does.
There is a significant effect of academic
performance on psychological distress in
university students, F (3,381) = 6.8639, p< .001,
R2 = 0.051, RMSE = 7.163 (see Table 9).
Fig. 1. Frequency and percentage response to sleep hours, academic performance and psychological distress
reported significant psychological distress, t = 4.09, p<.001. Expanded parameter estimate as showed in Table 10, indicated that as academic performance below average increases by 1
standard deviation, psychological distress
increases by 2.829 (95% CI = 1.469-4.189). Average academic performance (26.220±0.525; 95% CI = 25.188-27.253), above average (25.328±0.895, 95% CI = 23.568-27.089), and excellent performance (25.700±1.602; 95% CI = 22.551-28.849) do not significantly predict
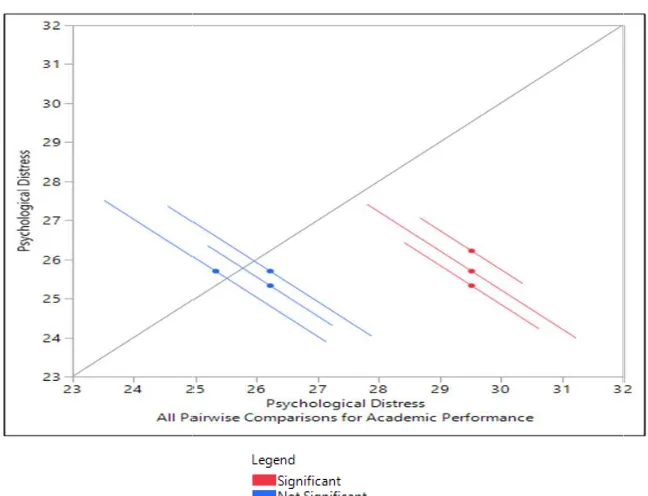
psychological distress. Tukey-Kramer HSD
ordered differences report of psychological distress by academic performance showed that there is a significant difference in psychological distress between below average performance and above average (4.194±1.117; 95% CI =
1.997-6.390), p<.001, below average and
excellent (3.823±1.735; 95% CI = 0.409-7.234),
p = 0.028, and below average and average
(3.301±0.850; 95% CI = 1.630-4.972), p < .001 (see Table 12). Generally, therefore, academic performance below average may strongly predict distress in students.
Table 2. Correlation among study variables of sleep hours, academic performance, and psychological distress
Variable Academic performance Psychological Distress Sleep hours
Academic performance 1
Psychological Distress -.194** 1
.000
Sleep hours .012 -.284** 1
.816 .000
**. Correlation is significant at the 0.01 level (2-tailed)
Table 3. Means for one-way analysis of variance (ANOVA) of sleep hours and psychological distress
Level Number Mean Std error Lower 95% Upper 95%
<4hrs 60 32.400 0.889 30.651 34.149
4-6hrs 98 27.684 0.696 26.315 29.052
7-9hrs 167 24.934 0.533 23.886 25.982
Table 4. One-way analysis of variance of psychological distress by sleep hours
Source DF Sum of squares Mean square F ratio Prob > F
Sleep hours 3 2527.023 842.341 17.7501 <.0001*
Error 381 18080.603 47.456
C. Total 384 20607.626
Summary of Fit; Rsquare = 0.123, Adj Rsquare = 0.116, Root Mean Square Error = 6.889, Mean of Response = 27.031, Observations (or Sum Wgts) = 385
Table 5. Expanded parameter estimates of psychological distress by sleep hours
Term Estimate Std error t Ratio Prob>|t| Lower 95% Upper 95%
Intercept 27.863 0.383 72.70 <.0001* 27.109 28.616
Sleep hours[<4hrs] 4.537 0.736 6.16 <.0001* 3.089 5.985
Sleep hours[4-6hrs] -0.179 0.624 -0.29 0.7741 -1.405 1.047
Sleep hours[7-9hrs] -2.929 0.538 -5.45 <.0001* -3.986 -1.872
Sleep hours[10+hrs] -1.429 0.736 -1.94 0.0530 -2.877 0.0186
Table 6. Tukey-kramer HSD difference matrix of psychological distress by sleep hours Dif=Mean[i]-Mean[j]
Sleep quantity <4hrs 4-6hrs 10+hrs 7-9hrs
<4hrs 0.000
4-6hrs -4.716 0.000
10+hrs -5.967 -1.250 0.000
-9hrs -7.466 -2.749 -1.499 0.000
Table 7. Tukey-Kramer HSD ordered differences report of psychological distress by sleep hours
Level - Level Dif Std Err Dif Lower CL Upper CL p-Value
<4hrs 7-9hrs 7.466 1.037 4.790 10.141 <.0001*
<4hrs 10+hrs 5.967 1.258 2.721 9.212 <.0001*
<4hrs 4-6hrs 4.716 1.129 1.802 7.630 0.0002*
4-6hrs 7-9hrs 2.749 0.877 0.488 5.011 0.0099*
10+hrs 7-9hrs 1.499 1.037 -1.176 4.175 0.4715
4-6hrs 10+hrs 1.250 1.129 -1.664 4.164 0.6853
Table 8. Means for one-way analysis of variance (ANOVA) of psychological distress by academic performance
Level Number Mean Std error Lower 95% Upper 95%
Below average 115 29.522 0.668 28.208 30.835
Average 186 26.220 0.525 25.188 27.253
Above average 64 25.328 0.895 23.568 27.089
Excellent 20 25.700 1.602 22.551 28.849
Table 9. One-way analysis of variance of psychological distress by academic performance
Source DF Sum of squares Mean square F ratio Prob > F
Academic performance 3 1056.659 352.220 6.8639 0.0002*
Error 381 19550.967 51.315
C. Total 384 20607.626
Fig. 2. Tukey-Kramer HSD all pairwise comparison scatter plot of psychological distress
Table 10. Expanded parameter estimates of psychological distress by sleep hours
Term Estimate
Intercept 26.693
Below average 2.829
Average -0.472
Above average -1.364
Excellent -0.993
Table 11. Tukey-Kramer HSD difference matrix of psychological distress by academic performance Dif=Mean[i]
Performance Below average
1 0.000
2 -3.301
3 -3.822
4 -4.194
Note: 1 = below average, 2 = average, 3 = excellent, I am probably one of the very best, 4 = above average
Table 12. Tukey-kramer HSD ordered differences report of psychological distress by academic
Level - Level Difference
1 4 4.194
1 3 3.823
1 2 3.301
2 4 0.892
2 3 0.520
3 4 0.372
Note: 1 = below average, 2 = average, 3 = excellent, I am probably one of the very best, 4 = above average Kramer HSD all pairwise comparison scatter plot of psychological distress
during sleep hours
Table 10. Expanded parameter estimates of psychological distress by sleep hours
Estimate Std Error t Ratio Prob>|t| Lower 95%
0.506 52.80 <.0001* 25.698
0.692 4.09 <.0001* 1.469
0.627 -0.75 0.4521 -1.706
0.810 -1.68 0.0930 -2.958
1.240 -0.80 0.4241 -3.431
Kramer HSD difference matrix of psychological distress by academic performance Dif=Mean[i]-Mean[j]
Average Excellent, I am probably one of the very best
Above average
0.000
-0.520 0.000
-0.892 -0.372 0.000
Note: 1 = below average, 2 = average, 3 = excellent, I am probably one of the very best, 4 = above average
kramer HSD ordered differences report of psychological distress by academic performance
Difference Std Err Dif Lower CL Upper CL
1.117 1.997 6.390
1.735 0.409 7.234
0.850 1.630 4.972
1.038 -1.149 2.933
1.686 -2.794 3.835
1.835 -3.236 3.980
Note: 1 = below average, 2 = average, 3 = excellent, I am probably one of the very best, 4 = above average Kramer HSD all pairwise comparison scatter plot of psychological distress
Table 10. Expanded parameter estimates of psychological distress by sleep hours
Upper 95%
27.687 4.189 0.761 0.229 1.446
Kramer HSD difference matrix of psychological distress by academic
Above average
0.000
Note: 1 = below average, 2 = average, 3 = excellent, I am probably one of the very best, 4 = above average
kramer HSD ordered differences report of psychological distress by academic
p-Value
0.0002* 0.0283* 0.0001* 0.3906 0.7577 0.8395
Fig. 3. Tukey-Kramer HSD all pairwise comparison scatter plot of psychological distress for
4. DISCUSSION
The major essence of the study was to investigate the impact of sleep hours and academic performance on psychological distress among undergraduate students. Findings have shown that sleep hours significantly predict psychological distress among students with sleep duration less ≤4 hrs contributing positively to student’s distress. Conversely, sleep duration between 7-9 hrs contributes negatively to distress level among students. This outcome corroborates the previous study by Troc
[17], who evaluates health-related variables on academic performance and found that sleep had the largest effect on semester GPA compared to the other health-related variables such as exercise, nutrition intake, mental health, and stress and time management. There was a significant relationship (p<0.001) between sleep habits and higher GPA. Long sleepers (sleep 9 or more hours a day) were found to achieve higher GPAs than short sleepers (s
fewer hours a day) [18]. Kazim and Abrar [28 reported mean sleep of students in routine was 7.30 +1.66 hours and before the exam was 4.74 + 2.57 hours. Students felt refreshed after a mean sleep of 8.99+3.31 hours. About 84.3% (86/102) of the passed students and 81.6% (71/89) failed students slept for < 7 hours. The
Kramer HSD all pairwise comparison scatter plot of psychological distress for academic performance
The major essence of the study was to investigate the impact of sleep hours and academic performance on psychological distress among undergraduate students. Findings have shown that sleep hours significantly predict distress among students with sleep ≤4 hrs contributing positively to student’s distress. Conversely, sleep duration 9 hrs contributes negatively to distress level among students. This outcome es the previous study by Trockel et al. related variables on academic performance and found that sleep had the largest effect on semester GPA compared to related variables such as exercise, nutrition intake, mental health, and e management. There was a significant relationship (p<0.001) between sleep habits and higher GPA. Long sleepers (sleep 9 or more hours a day) were found to achieve higher GPAs than short sleepers (sleep 6 or fewer hours a day) [18]. Kazim and Abrar [28] ported mean sleep of students in routine was 7.30 +1.66 hours and before the exam was 4.74 + 2.57 hours. Students felt refreshed after a mean sleep of 8.99+3.31 hours. About 84.3% (86/102) of the passed students and 81.6% < 7 hours. The
lower GPAs of the short sleepers may have been the result of a decreased ability to focus on education-related activities, so it is possible other psychological variables will help to explain the results better.
Findings have also shown that poor academic performance significantly predicts psychological distress among students with performance below average contributing positively to student’s distress. Conversely, academic performance between average and excellence contributes negatively to distress level among students. This outcome corroborates the previous finding by Rothon, Head, Clark, Klineberg, Cattell and Stansfeld [29], who reported that overall score for psychological distress was negatively associated with achievement at GCSE for both boys and girls. There was evidence for an association
between achievement and depressive
symptoms. Since poor academic performance at school can have a substantial effect on opportunities in adult life, students with poor performance have a higher tendency of suffering from psychological distress. WestEd [30
a strong tie between students’ overall health and resilience and their academic achievement. The relationship between academic achievement and overall mental health of students was found to bidirectional.
Kramer HSD all pairwise comparison scatter plot of psychological distress for
lower GPAs of the short sleepers may have been the result of a decreased ability to focus on related activities, so it is possible other psychological variables will help to explain the
t poor academic performance significantly predicts psychological distress among students with performance below average contributing positively to student’s distress. Conversely, academic performance between average and excellence contributes distress level among students. This outcome corroborates the previous finding by eberg, Cattell and ], who reported that overall score for psychological distress was negatively associated both boys and girls. There was evidence for an association
between achievement and depressive
5. CONCLUSION
Psychological distress affects almost four out of every ten of the study participants, and over 40% are having average sleep a night < 6hrs, which is
below the recommended 7.5 – 8hrs to feel refreshed the next morning. This has led to the poor academic performance of over 30%
of the study sample. It should be noted, however, that the outcome of this study is not absolute as the lower performance of the short sleepers (< 4hrs) may be because of reduced efforts to concentrate on learning-related
undertakings or other factors not accounted for by this study. Other psychological variables
may help explain the extent of distress among the study sample with academic
performance below average. Further
investigation using objective means of measuring academic performance and exclude weekends compensatory sleep hour is, therefore, recommended. Generally, the study outcome shows average sleep between 7-9hrs favours good performance in school. This provides psychologists, counsellors and educationist with essential information required to enable the development of an intervention that can help to encourage good sleep habit and improved academic performance to reduce psychological distress. A multi-throng and concerted approach by stakeholders may help.
CONSENT
As per international standard or university standard, patient’s written consent has been collected and preserved by the author.
ETHICAL APPROVAL
As per international standard or university standard written ethical approval has been collected and preserved by the author.
COMPETING INTERESTS
Authors have declared that no competing interests exist.
REFERENCES
1. Wong JG, Cheung EP, Chan KK, Ma KK, Tang SW. A web-based survey of depression, anxiety and stress in first-year tertiary education students in Hong Kong. J. Psychiatr. 2006;40(9):777–782.
2. Voelker R. Mounting student depression taxing campus mental health services. JAMA. 2003;289:2055–2056.
3. Gjerde PF. Depressive symptoms in young adults: A developmental perspective on gender differences. In: Funder DC, Parke DR, Tomilinson- Keasey CA, & Widaman, K. (eds). Studying lives through time. American Psychological Association, Washington DC. 1993;255–288.
4. Stanley N, Manthorpe J. Responding to
students’ mental health needs:
Impermeable systems and diverse users. J. Mental Health. 2001;10(1):41–52. 5. Adewuya A, Ola B, Olutayo O, Mapayi B,
Oginni O. Depression amongst Nigerian university students. Prevalence and sociodemographic correlates. Psychiatr. Epidemiol; 2006;41:674–678.
6. Nerdrum P, Rustøen T, Rønnestad MH. Student psychological distress: A psychometric study of 1750 Norwegian, 1st-year undergraduate students. Scand. J. Educ. Res. 2006;50(1):95–109.
7. Ovuga E, Boardman J, Wasserman D. Undergraduate student mental health at Makerere University, Uganda. World Psychiatr. 2006;5(1):51–52.
8. Edwards MJ, Holden RR. Coping, meaning in life, and suicidal manifestations: Examining gender differences. J. Clin. Psychol. 2001;59:1133-1150.
9. Mirowsky J, Ross CE. Selecting outcomes for the sociology of mental health: Issues of measurement and dimensionality. Journal of Health and Social Behavior. 2002;43:152-170.
10. Wheaton B. The twain meets: Distress, disorder and the continuing conundrum of categories (comment on Horwitz). Health, 2007;11:303-319.
11. Horwitz AV. Distinguishing distress from disorder as psychological outcomes of stressful social arrangements, Health. 2007;11:273-289.
12. Ridner SH. Psychological distress: A concept analysis. Journal of Advanced Nursing. 2004;45:536-545.
13. Victor M, Abdulwahid U. Comparative analysis of academic performances of sleep deprived versus non-sleep deprived undergraduate students. Journal of Education and Practice. 2017;9(6);8-13. 14. Kelly DA. The effects of insomnia and
psychological distress on cognitive
performance among veterans. The
15. Shaheen F, Alam MS. Psychological distress and its relation to attributional styles and coping strategies among adolescents. Journal of the Indian Academy of Applied Psychology. 2010; 36(2):231-238.
16. Urrila AS, Karlsson L, Kiviruusu O, Pelkonen M, Strandholm T, Marttunen M. Sleep complaints among adolescent outpatients with major depressive disorder. Sleep Medicine. 2012;13(7):816-823. 17. Trockel MT, Barnes MD, Egget DL.
Health-Related variables and academic
performance among first-year college students: Implications for sleep and other behaviors. Journal of American College Health. 2000;49(3):125-131.
18. Kelly WE, Kelly KE, Clanton RC. The relationship between sleep length and grade-point average among college. College Student Journal. 2001;35:84 -87. 19. Roeser RW, Eccles JS, Strobel KR.
Linking the study of schooling and mental health: Selected issues and empirical illustrations at the level of the individual. Educational Psychologist. 1998;33:153-176.
20. Gumora G, Arsenio WF. Emotionality,
emotion regulation, and school
performance in middle school children. Journal of School Psychology. 2002;40: 395–413.
21. Asarnow JR, Jaycox LH, Duan N, LaBorde, AP, Rea, MM, Wells KB. Depression and role impairment among adolescents in primary care clinics. Journal of Adolescent Health. 2005;37,477-483. 22. Hanson TL, Austin G, Lee-Bayha J.
Ensuring that no child is left behind: How are student health risks and resilience
related to the academic progress of schools? San Francisco: West Ed; 2004. 23. Kessler RC, Andrews G, Colpe .et al.
Short screening scales to monitor population prevalence and trends in
non-specific psychological distress.
Psychological Medicine. 2002:32, 959-956. 24. Kessler RC, Barker PR, Colpe LJ, Epstein JF, Gfroerer JC, Hiripi E, et al. Screening for serious mental illness in the general population. Arch Gen Psychiatry; 2003; 60(2):184-189.
25. Andrews G, Slade T. Interpreting scores on the kessler psychological distress scale (k10). Australian and New Zealand Journal of Public Health. 2001;25:494-497.
26. Grande ED, Taylor A, Wilson D. South Australian health and wellbeing survey, December 2000. Population Research and Outcome Studies Unit, Department of Health, South Australia; 2002.
27. Buysse DJ, Reynolds CI, Monk T, Berman S, Kupfer D. The pittsburgh sleep quality index: A new instrument for psychiatric practice and research. Psychiatry Research. 1998;28:193–213.
28. Kazim M, Abrar A. Sleep patterns and academic performance in students of a medical college in Pakistan. KUST Med Journal. 2011; 3(2):57-60.
29. Rothon C, Head J, Clark C, Klineberg E, Cattell V, Stansfeld S. The impact of psychological distress on the educational achievement of adolescents at the end of compulsory education. Soc Psychiatry Psychiatr Epidemiol. 2010;44(5):421–427. 30. WestEd. Student well-being: Essential to
academic success. R&D Alert. 2003; 5(1):8-9.
© 2018 Victor and Godwin; This is an Open Access article distributed under the terms of the Creative Commons Attribution License (http://creativecommons.org/licenses/by/4.0), which permits unrestricted use, distribution, and reproduction in any medium, provided the original work is properly cited.
Peer-review history: