Marine Sediment’s Profile for Mercury as Pollution Indicator at
Karachi Coast
Shaikh Mohiuddin* and Iftikhar Imam Naqvi
Department of Chemistry, University of Karachi, Karachi, Pakistan.
*Email:
shmohiuddin@uok.edu.pk
Abstract. Total mercury (regardless of its form) is investigated as a pollutant in the marine system of coastal regions of Karachi for the period between 2006-2008. Seawater, sediment, and filter feeders have been focused for total mercury content (THg). Seven sites were selected for analyses. Sites have been categorized into polluted and safe areas. Polluted area happens to be near the city and safe area is beyond the civil activities. Manora is identified as most polluted station. Industrial and domestic effluents have been identified to be a major source of pollution. Bioaccumulation and bio-amplification in ecosystem has also been monitored through analyses on sediment and filter feeder (barnacles, oyster, and mussels). For a period of three years seasonal variations have also been marked. Monsoon and non-monsoon metal load was specifically recorded and compared. Future THg levels are also being predicted as an outcome pertaining to three years data. Cold vapor AAS is employed as a major analytical tool. As another independent analytical technique the anodic stripping voltammetry (ASV) was employed to ascertain these results. Physicochemical parameters also support the THg analyses outcomes. Several statistical tests like ANOVA and PCA have been employed for comparison and data reduction.
Key words: Marine sediments, mercury, pollution, Karachi coast.
Introduction
Out of heavy metals mercury is one of the most toxic. In natural environments mercury is occurring in elemental, bivalent inorganic and organic forms. Its persistence in the natural environment is due to affinity towards particulates and organic matter. Mercury is harmful for health and historically it was used by human beings in several daily routines. It was identified as a toxic substance after few disasters, especially in 1953 there was a great disaster namely Minimata Bay disaster that happened in Minimata bay, Kyushi Island, Japan.
Generally the mercury can be classified as total mercury (THg), inorganic mercury (IHg) and Methylmercury (MeHg) in the environment. THg covers all chemical and physical forms of mercury in system, IHg includes elemental (Hg0), mercurous (Hg22+) and mercuric (Hg2+) ions. No methylation is
happened by both elemental mercury and mercurous forms. Both forms are able to oxidize to Hg2+.
Reactivity of Hg2+ is higher than all inorganic forms, it can form complexes with several inorganic and organic ligands. This form is also a major contributor in methylation of mercury. In higher pH and Cl- concentrations it forms HgCl42- dominantly.
Organic mercury (OHg) compounds are derivatives of Hg2+with organic compounds. A stable C-Hg bond
exists in most of OHg compounds. IHg is convertible to OHg by methylation and vice versa.
Mercury and its different forms are distributed in the environment (E.A. Mann et. al. 2015) in sediments, dissolved or suspended in waters and in atmosphere in gaseous or in aerosols. This distribution is influenced by different physicochemical factors in ecosystem. Regarding speciation of mercury in sediments, inorganic mercury (IHg) is most likely to be settled and in estuaries it associates with particulate matter (Cosa and Rondeau, 1985; Gill and Bruland 1990). When the extent of settlement and transportation of particulate matter is higher the THg in surface water becomes low (Bonzongo, et al. 1996). Mercury in sediments is also affected by rainfall, pattern of water circulation and sediment characteristics. Mercury in sediments from freshwater enters estuaries (due to rainfall or other urban runoff) and gets desorbed in consequence of interaction with saline waters (seawater). This dissolved THg is one of the factors for temporary increment of THg in filter feeders.
introduced, methylation of IHg is favored. Higher IHg in sediment is also reported in low salinity areas (Weis, Weis and Bogden., Effects of environmental factors on release of mercury from Berry’s Creek (New Jersey) sediments and its uptake by Killifish Fundulus heteroclitus 1986). In seawater, bioavailability of metals and metal complexes is a field of interest for environmental chemists. Models for speciation and distribution or uptake have been suggested in general or specific to particular metal (Slaveykova and Wilkinson 2005). Mostly OHg is present in dissolved form in water. Some of IHg is also present suspended with low density particulate matter.
Solubility of dimethylmercury (DMeHg) is very low. However a trace of (DMeHg) is present in soluble form. It was evidenced that the particulate matter can cause decrease in THg of seawater if settled by any physical, chemical or biological change (Bonzongo, et al. 1996). THg is enhanced in water at low salinity areas (Cossa and Rondeau 1985). A decrease in THg of seawater is noticed after stopped rainfall runoff (Jackson, 1988). Changes in the mercury load are mostly due to chemistry of the surrounding. Chemical reactions are occurring at different extent and speed and these reactions are quite complicated. Most of the environmental reactions depend upon other reactions. It is quite difficult to fix the chemistry accurately.
Dissolved mercury compounds are continuously depositing and again dissolving. This dissolution process has certain equilibrium. The sediment-water interaction regarding transport of mercury is well studied (Kuwabara, et al. 2002), (John, et al. 1999). Many factors influence chemistry of distribution of Hg in sediment-water phases like pH, DO2, dissolved
organic carbon (Chaser, et al. 2009), salinity etc. A major deposition is due to methylation or biomethylation, EHg is also distributed in between liquid solid phase. This EHg is usually product of reduction reaction of IHg salts like HgCl2 etc. It is
termed as HgX in following reaction.
These salts are also in equilibrium with dissociation in to soluble form like ionic Hg2+.
Hg2+ suspended to sediment undergoes bacterial methylation and simultaneously its sulfide is also formed Gilmour et al., 1992; Gilmour and Capone, 1987).
Dissolution of MeHg has equilibrium within solid-liquid phase, also DMeHg is volatile so it directly goes to water and finally to atmosphere (Beijer and Jernelov 1979).
Another sedimentation process is bioaccumulation. Aquatic plants, invertebrates, fishes, mammals, seaweeds etc. bioaccumulate mercury. It results into bio-magnification (increasing concentration of Hg) in organisms. EHg does not bioaccumulate directly, while high reactivity of IHg and MeHg with intracellular ligands results into greater degree of bioaccumulation.
The degree of accumulation or uptake is different for different types of mercury present. It is reported that neutral mercury species accumulates more effectively than charged species (Mason et al., 1996). Out of these two types of accumulated IHg and MeHg, IHg species are not biomagnified Riisgård and Hansen. 1990; Hill et al. 1996). Although, both neutral and organic complexes have similar lipid solubility, MeHg is selectively accumulated due to more ability of transfer and low rate of elimination. It results in bio-magnification in higher tropic levels (Mason et al. 1995). Sources of IHg and MeHg in bioaccumulation are water, sediment and food. Accumulation also depends upon the life style of living species and its age, size, habitat etc.
Canadian Water Quality Guideline for Protection of Aquatic Life is 0.1μg/l (Gaude, et al. 1995). ASEAN Marine Water Quality Criteria for protection of aquatic life is 0.16μg/l Hg, for protection of human health from seafood consumption guideline is 0.04μg/l Hg and for protection of human health from recreational activities is 21μg/l Hg in waters. Coastal water quality standard in Thailand is 0.1μg/l (Waewtaa and Parkpian 2002). Sediment guideline is not exactly established yet. ERL (Effected Range-Low) 0.15 mg/kg and ERM (Effected Range-Median) 0.71mg/kg values for sediments were suggested based on database established as a result of environmental monitoring (Long and MacDonald, 1992; Long, et al. 1995). World average value for marine sediment is 0.3μg/g dry wt. Sediment Quality Standard for the State of Washington 0.4μg/g dry wt.(Waewtaa and Parkpian 2002). Draft Interim Canadian marine sediment quality guideline 0.13μg/g dry wt. Sediment Quality Guidelines for Florida is 0.13-0.7μg/g dry wt. and in Australia and New Zealand it is 0.15-1.0μg/g dry wt. In Hong Kong guideline value is 0.5-1.0 μg/g dry wt. (Waewtaa and Parkpian 2002).
Experimental
homogenized and then stored in a plastic (polyethylene bags). On the spot decontamination of sediment sampling equipment and associated utensils was conducted at the sampling stations. In order to remove excess sample material, scrubbing with a brush and washing with phosphate-free detergent solution was practiced. All equipment was then thoroughly rinsed with clean water. Mostly seawater samples were collected from surface at the shores. Samples were collected in PTFE Teflon samplers of 1.5 liter capacity. These samplers are soaked overnight in diluted (~0.1N) nitric acid (USEPA 1997), and then washed with DD water. All reagents of high purity grade were used having Hg content reported in their certificates of analysis.
Deionized-distilled water (DD water) was used throughout the analysis. Commercially available stock solution of 1000
5ppm Hg was obtained from Fisher Scientific (Code: J8047/08; Batch: 0416723). The certificate of analysis for such standard Hg stock specified the results as 999
5ppm Hg(II). Stock solution was diluted to obtain 1mg Hg/L in 1.5% HNO3, stabilized by the addition of few drops of 5%KMnO4 solution.1.5% (V/V) solution of nitric acid. As
reductant solution, 3.0g of (NaBH4) sodium
borohydride in 1%NaOH. A nitrogen gas cylinder filled with N2 gas of purity (4N) was provided by BOC,
Pakistan Ltd. This analysis is pertains to ultra trace level of mercury and it requires extra ordinary care. All the apparatus was washed with detergents and then soaked overnight in 0.1M HNO3. Then it was again
washed and rinsed with DD water. Atomic absorption spectrometer, Perkin Elmer™ AAnalyst 700 equipped with MHS-15 analyzer assembly is used for Hg determinations. A voltammetric work station Metrohm™ VA Trace analyzer 746VA is used for anodic stripping voltammetry that is coupled with 747VA stand. As the concentration of total mercury content (THg) in seawater is considerably lower than the detection limit of CVAA, the seawater samples were usually pre-concentrated. There are several ways of pre-concentration (Rao, et al. 2005). In current study a solvent extraction method is employed (Suzuki 2004).
For digestion of seawater samples a 250mL of acidified seawater sample is transferred to a separatory funnel. 2.5mL of ~20N H2SO4 is added and mixed.
Then 1.25mL of 0.5% KMnO4 is added with gentle
mixing, allowing the solution to settle for 5 minutes. Then 5mL of ~10N NaOH is added to neutralize the acid. 1.25mL of 10% NH2OH.HCl solution is then
added and mixed. After an elapse of 20 minutes, 1.25mL of 10% EDTA solution was added followed by 70mL of purified 0.01% Dithiozone-toluene reagent. The content was vigorously shaken for 1 hour. Aqueous phase was discarded and organic phase was collected in a centrifuge tube, then 0.125g of Na2SO4
was introduced after emulsion formation. The contents
were then shaken followed by centrifugation at 1500 rpm for 2 to 3 minutes.
Out of 10mL organic phase, exactly 7mL is transferred to sample digestion flask and the content is evaporated to dryness at low temperatures over a hotplate. ~1mL DD water is added followed by 2mL of (1:1) mixture of HNO3:HClO4 and 5mL of H2SO4. The
mixture is then heated at 200-230oC for 30 minutes. After cooling the whole content is transferred quantitatively to 25mL volumetric flask and finally the volume is made up. to dryness at low temperatures over a hotplate. ~1mL DD water is added followed by 2mL of (1:1) mixture of HNO3:HClO4 and 5mL
of H2SO4. The mixture is then heated at 200-230oC
for 30 minutes.
Thus we obtain digested sample, 5mL of this digested sample was run at CVAAS for analysis of seawater. 0.5-0.75g of wet sediments were transferred to digestion flask followed by the addition of 1mL DD water, 2mL of (1:1) mixture of HNO3-HClO4 and 5mL of H2SO4. Heated at
200-230oC for 30 minutes using hotplate. After cooling filtered the whole content (using Whatman 540) to 50mL volumetric flask and finally filled with DD water. 5mL of it is run at CVAAS.
AAS was already adjusted to notice peak area within 20 seconds time interval. After completion of rum the vessel is washed with DD water collecting all washings in a basin of KMnO4 solution. The use of
certified reference materials can ascertain the accuracy. During current study simultaneous measurements on CRM (certified reference material) of sediment SRM 1645 have been recorded to ascertain accuracy. A good agreement between the measurements on certified materials and the sample results i.e. 99.9% recovery. To ensure the quality of analysis samples were analyzed by another independent method i.e. anodic stripping voltammetry (ASV). ASV is reported for the analysis of mercury and its other compounds in environmental samples (Kateman and Buydens 1993; Pascal and Constant 2006; Turyan and Mandler 1994).
Aliquots of the same digested samples were run through both (CVAAS and ASV) using standard addition method. The results produce paired data. On the application of paired‘t’ test at (P = 0.05) for data obtained by CVAAS and ASV using MS-Excel, there is no significant difference evidenced in the data. Therefore, both methods (that are independent) are found to showing comparable results.
Analysis of Variance
Source DF SS MS F P Factor 7 22116.8 3159.5 44.63 0.000 Error 40 2831.5 70.8
Total 47 24948.3
Individual 95% CIs For Mean Based on Pooled StDev
Level N Mean StDev ---+---+---+---+--- Hawksbay 6 42.50 1.87 (--*---)
Kakapir 6 47.67 1.97 (---*--) Sandspit 6 49.83 1.47 (---*--)
Manora 6 99.50 17.35 (---*-) Gizri Cr 6 84.17 5.23 (--*---) Korangi 6 86.83 4.02 (--*---) Phitti Cr 6 96.67 12.24 (--*---) Port Qasim 6 71.33 7.89 (---*--)
---+---+---+---+--- Pooled StDev = 8.41 40 60 80 100
stations and it is in the following output (Fig. 1 One-way Analysis of variance for all stations.) of said software that all set of data are significantly different with each other at (P=0.05), as Fcal>F7,40. The
classification of sampling sites is also evident from ANOVA outcomes.
Fig. 1 One-way Analysis of variance for all stations.
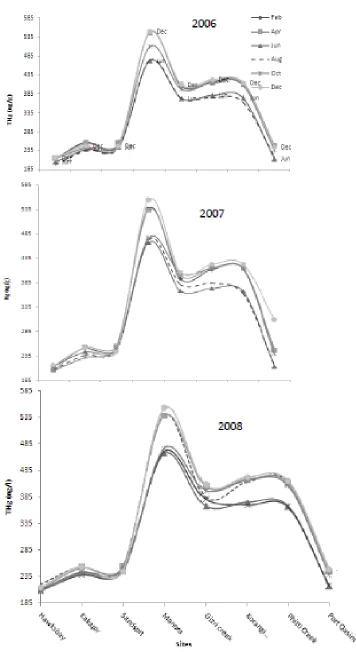
Table 1. Comparison of THg in sediment samples in three years sampled for February.
Sites
THg(ng/g)
Year 2006 Year 2007 Year 2008
Hawksbay 214.2±1.5 215.3±1.6 220.2±1.3
Kakapir 258.3±0.9 251.6±1.3 254.4±1.8
Sandspit 249.4±2.3 251.3±1.4 252.2±1.4
Manora 548.6±3.1 537.7±1.4 540.3±2.1
Gizri creek 404.5±1.3 393.6±1.2 385.5±1.3
Korangi Creek 416.5±0.9 412.0±2.0 413.0±1.8
Phitti Creek 413.9±1.7 415.3±0.9 413.1±2.0
60 70 80 90 100 110 120 130
440 460 480 500 520 540 560
Feb Apr Jun Aug Oct Dec
TH
g
Sea
w
ater
(ng/
l)
TH
g
Sedi
me
nt
(ng/
l)
Months
Sediments Seawater
Fig. 2 Comparison sediment-water THg distribution ratios for all sites.
Fig. 3 Season-wise comparison of THg values of sediment and seawater for Manora. 0
1 2 3 4 5 6 7 8
Feb Apr Jun Aug Oct Dec
D
ist
ri
but
ion
ra
ti
o
Months
Hawksbay
Kakapir
Sandspit
Manora
Gizri creek
Korangi Creek
Phitti Creek
Fig. 5 Effect of pH on THg value of seawater samples collected for February 2006.
Fig. 6 PCA outcomes for seawater, sediments, salinity and pH for whole study.
Discussion
The data present outcomes of three years spanning the period (2006-2008). It pertains to studies related to investigation of mercury related pollution in Karachi’s coastal belt. The study provides a baseline profile for mercury based pollution of Karachi’s marine environment. The discussion that follows debates the validity and authenticity of these results on one hand and also an attempt has been made to interpret these results in terms of environmental variables like salinity, pH, etc.
Total mercury content (THg) of environmental sample is chosen as tool for indication of overall pollution. The basis of total mercury is more sensitive as it is more abundant of all forms of mercury (Mann et. al. 2015; Adam et al., 2008). In comparison with
other trace metals mercury has quite low natural abundance.
Seawater is the largest in volume and abundance, therefore it is focused preliminary. At preliminary stage samples were collected from the distance of at least 15 km of coastal belt on the basis of difference in surrounding and activities. Initially fifteen different locations were sampled. Out of these seven stations were chosen on the basis of requirements for statistical treatment ANOVA (Fig. 1) of seawater data for Hg content and exposure level. Each of seven stations is having three sampling sites in order to make sampling representative of the whole area. Sediment and seaweed samples were also collected from all these stations.
6.6 6.8 7 7.2 7.4 7.6 7.8 8 8.2
0 20 40 60 80 100 120
pH
T
Hg
(n
g/l
)
Sampling sites
THg
Hawksbay, Kakapir and Sandspit sites have very little human activities and presence of any industrial unit is not evidenced. Stations other than Hawksbay, Kakapir and Sandspit are situated at the coastal area of main
city. These five stations (Manora, Gizri creek, Korangi Creek, Phitti Creek and Port Qasim) are identified in the vicinity of civil population. Their domestic and industrial waste is exposed to the environment. Effluents and fumes are carried to sea from different industrial units located at different areas. The two major paths of industrial effluents to coastal waters are Lyari and Malir Rivers.
The current study covers three years of monitoring coastal sites of Karachi city. Hawksbay, Kakapir and Sandspit are remarkably low in Hg content of seawater. Rests of the stations are high in mercury content. Statistical multivariate analysis PCA also helps to classify stations. PCA of THg and physicochemical parameters supports the classification of sites into two groups, one of them is Kakapir, Sandspit, Hawksbay are relatively pollution free and others having higher pollution load. On the basis of above facts the sampling stations can be classified into two classes, Hawksbay, Kakapir and Sandspit as safe area and rest of the stations as polluted area. Among all of the sampling stations, Manora and Phitti Creek are identified as most polluted areas. Status of total mercury content in seawater samples from Manora and Phitti creek stations are fairly high in comparison with those sites that are even higher than the guideline value of 50 ng/l. (Riley and Chester 1971). PCA of seawater analyses in all years of study also group Manora and Phitti creek in same class of high THg (6).
The seasonal variations are well noticed in the study. It is clear from and that there is similarity in pattern of curves for seawater and sediment samples collected from polluted stations. A particular pattern is noticed in three years regarding THg content in sediments of sites (Fig. 4). For the month of June the THg content is high at almost all of these stations. Unlike seawater pattern, the sediment THg is low in June (Fig. 3). The enhanced values for seawater samples and low for sediment in June are probably due to following few reasons. One may be that there is monsoon season in June, during which tides are very frequently changing, otherwise, high degree of inputs from urban runoff in consequence of higher consumption during summer. Such increment is lower in seawater and higher for sediment in stations identified as safe areas as these locations have no contributions from urban runoff which are conspicuously missing in June in this locality. The factor of tidal change is common for all the focused stations but the sludge from human activities is not a matter of concern at safe stations (Hawksbay, Kakapir and Sandspit). Tidal change disturbs the soluble and sediment THg distribution (Kuwabara, et al. 2002;
John, et al. 1999). Mercury load in water will be more where the accumulated THg in sediment is high. In order to discover that whether tidal changes is the only factor for such change in summer for all stations or other factors are also contributing the elevation of THg in summer, a parameter that can synchronize the criterion is needed. The ratio of the THg value for each station with THg of Hawksbay as control site for the same month can normalize the effect of tidal change. Assessment of sediment-water distribution is normalizing by the distribution ratio ‘D’ of THg in sediment and water.
)
(
)
(
w
THg
sd
THg
D
THg(sad) is total mercury in sediment and THg(w) is the corresponding value for seawater.
Plots of distribution ratio ‘D’ as function of months (Fig. 2) show the gradient during summer in polluted areas is prominent while in safe areas the effect is insignificant. The frequent change in the tides is a factor for increase in the THg in summer. Also sites where the pollution is already high and they are having channelized wastewater inputs record enhanced THg levels. Not only water consumption in summer is high producing higher flow rate of Lyari and Malir Rivers, but the consumption of (fuels, electricity etc.) is higher during summer. Remarkable change in waste disposal load in these rivers and other wastewater channels ultimately carries pollutants to sea. The same pattern is noticed in the season profile for each year. THg in seawater sampled in Feb and for sample of June for all years is shown.
open sea in a single tidal change from a Phitti Creek. A Mercury loss to shore waters was reported 8.6 ton yr
-1
in a similar survey for Finland. (Clark 1992). The THg loads are higher with age or size owing to long exposure or consuming larger account of filtration residues. THg accumulation pattern for samples collected in different seasons conform to the pattern of seawater and sediment analysis.
THg is highest in Manora (540-450ng/g) and lowest in Kakapir (240-280ng/g) samples. It also resembles the seawater and sediment analysis regarding pollution status. These parameters mostly support the interpretation of the other principal parameters of analysis. In this study temperature, pH, conductivity measurement and salinity were monitored for almost all the seawater samples at the time of sampling.
In the region of safe areas pH of seawater samples is quite higher, while in polluted areas the value of pH is low, but not necessarily acidic. In Manora and Gizri creek areas sometimes the value of pH is nearly neutral or little acidic and mostly not likely to be in the pH range of normal seawater.
A good agreement between the pH and THg values is observed in seawater samples (Fig. 5). High THg values in the region of low pH areas are observed and vice versa. It shows that existences of different chemical forms of Hg are strongly dependent upon the pH of seawater. Low pH values are noticed in most of the polluted areas. Neutral or low pH favors the production of MeHg over DMeHg (Beijer and Jernelov 1979). Therefore these regions are likely to be higher in MeHg content. DMeHg moves into atmosphere and if the pH is higher in polluted areas it influences the distribution of Hg in atmosphere-water phases (Chaser, et al. 2009). This may be a possible pattern for the Korangi Creek and Port Qasim where higher pH values are noticed, and may be another cause of low THg levels at Port Qasim. At higher pH values the sedimentation of mercury is also favorable in presence of sulfide in higher amounts. At high pH and low reduction potential mercury is precipitated in form of insoluble HgS and inhibits methylation (Gilmour and Capone 1987) to bring the ambient THg load down as in the case of Port Qasim.
Salinity is calculated by the conductance measurement. The conductivity of seawater samples is due to dissolved ions. Sodium and chloride are the major ions that are present in seawater and they have great contribution to the conductivity value. Another strong relationship of salinity and Thighs been noticed. THg gets enhanced in high salinity waters. This relationship of salinity may be due to the presence of other ionic substances rather than increased level of THg. THg and salinity get increased with increase in degree of pollution. In high salinity, the rate of biomethylation is lower (Blum & Bertha 1980). Biomethylation is also affect by bicarbonate content of
seawater (Compeau and Bartha. 1983), sulfide (Gilmour, et al. 1992) and chloride content (Craig and Moreton 1985). Percentage of MeHg in THg is lower in saline waters; it protects fishes and other living beings from more toxic MeHg exposure. Hence we could understand high pollution levels at Manora and Phitti creek, where salinity levels are higher. Also the decrease in sediment THg for Korangi and Gizri creeks are may be due to closing of noticeable industries in the city because of political and law and order situation in city.
Conclusion
Total Hg content is found to be useful tool for understanding of overall pollution status of marine system. Profile of THg regarding year-wise, site-wise and comparison of the THg values with corresponding physicochemical parameters explain the current situation and also helps in prediction of future.
References
Beijer, K.; Jernelov, A. (1979). Methylation of mercury in aquatic environments. In The Biogeochemistry of Mercury in the Environment, by J. O. Nriagu, 203-210. Elsevier/North-Holland Biomedical Press.: Elsevier/North-Holland Biomedical Press, New York, USA.
Blum, J. M.; R. Bartha. (1980). Effect of salinity on methylation of mercury. Bulletin of Environmental Contamination and Toxicology; 25, 404-408.
Bonzongo, J. J.; Berry, W. L.; Kenneth, J. H.; Chen, Y. U.; Warwick, J. J.; Miller, G. C.; Lechler, P.J. (1996). Mercury pathways in the Carson River-Lahontan Reservoir System Nevada, USA.
Environ. Toxicol. and Chem.; 15, 677-683. Chaser, L. R., C.; Barabara,; Scudder, A.; Robin, S.;
Amanda H. B.; George. (2009). Mecury cycling in stream Ecosystems. 3. Trophic
Dynamics and Methylmercury
Bioaccumulation. Environ. Sci. Technol.; 43, 2733-2739.
Colman, J. A.; Waldron, C. M.; Breaul F.; Robert, T.; Lent, M. R. (1999). Distribution and Transport of Total Mercury and Methylmercury in Mercury- Contaminated Sediments in Reservoirs and Wetlands of the Sudbury River, East-Central Massachusetts. U.S.Geological Survey Water-Resources Investigations Report, New York: U.S. Geological Survey, 99-4060. Compeau, G.; Bartha, R. (1983). Effects of sea salt
anions on the formation and stability of methylmercury. Bulletin of Environmental Contamination and Toxicology; 31, 486-493. Cossa, D.; Rondeau. J. G. (1985). Seasonal,
mercury pollution level in the Estuary and Gulf of St. Lawrence. Marine Biology; 88, 43-49. Craig, P. J.; Moreton, P. A. (1985). The role of
speciation in mercury methylation in sediments and water. Environmental Pollution Series B; 10, 141-158.
Gaude, T. C.; Lingard, S.; Cureton, P.; Keenleyside, K.; Smith, S. Rajn, G. (1995). Canadian environmental quality guidelines for mercury.
Water Air Soil Pollut.; 80, 1149-1159.
Gill, G. A., Bruland. K. W. (1990). Mercury speciation in surface freshwater systems in California and other areas. Environmental Science and Technology ; 24, 1392-1400.
Gilmour, C. C., Capone, D. G. (1987). Relationship between Hg methylation and the sulfur cycle in estuarine sediments. EOS; 68, 17-18.
Gilmour, C. C.; Henry. E. A. (1991). Mercury methylation in aquatic systems affected by acid deposition. Environmental Pollution; 71, 131-169.
Gilmour, C. C.; Henry, E. A.; Mitchell. R. (1992). Sulfate stimulation of mercury methylation in freshwater sediments. Environ. Sci. Technol.; 11, 2281-2287.
Hill, W. R.; Stewart, A. J.; Napolitano. G. E. (1996). Mercury speciation and bioaccumulation in lotic primary producers and primary consumers. Can. J. Fish. Aquat. Sci.; 53, 812-819.
Jackson, T. A. (1988). Accumulation of mercury by plankton and benthic invertebrate s in riverine lakes of northern Manitoba (Canada): Importance of regionally and seasonally varying environmental factors. Canadian Journal of Fisheries and Aquatic Sciences; 45, 1744-1757.
Kuwabara, S. (2002). Sediment-Water Interactions Affecting Dissolved-Mercury Distributions in Camp Far West Reservoir, California. Water-Resources Investigations Report 03-4140;, U.S. GEOLOGICAL SURVEY,.
Long, E. R.; Mac Donald, D. D. (1992). National Status and Trends Program Approach. Sediment Classification Methods Compendium, Washington, DC.: U.S. Environmental Protection Agency.
Long, E. R.; MacDonald D. D.; Smith, S. L.; Calder, F. D. (1995). Incidence of adverse biological effects within ranges of chemical concentrations in marine and estuarine sediments. Environmental Management; 1, 81-97.
Luoma, N. (1977). The dynamics of biologically available mercury in a small estuary. Estuarine Coast. Mar. Sci.; 5, 643-652.
Mason, R. P.; Reinfelder, J. R.; Morel. F. M. M. (1996). Uptake, toxicity, and trophic transfer of mercury in a coastal diatom. Environ. Sci. Technol.; 30, 1835-1845.
Mann, E. A.; Mallory, M. L.; Ziegler, S. E.; Tordon, R.; O'Driscoll. N. J. (2015). Mercury in Arctic snow: Quantifying the kinetics of photochemical oxidation and reduction.
Science of The Total Environment; 509–510, 115-132.
Mason, R. P.; Rolfhus, K. R.; Fitzgerald. W. F.; (1995). Methylated and elemental mercury cycling in surface and deep ocean waters of the North Atlantic." Water, Air and Soil Pollution; 80, 665-677.
Pascal, Salaǜn, Berg M. G., Constant,; (2006) "Voltammetric Detection of Mercury and Copper in Seawater Using a Gold Microwire Electrode. Anal. Chem.; 78, 5052-5060. Rao, T. P.; Metilda, P.; Mary, J. G. (2005). Overview of
Analytical Methodologies for Sea Water Analysis: Part I-Metals. Critical Reviews in Analytical Chemistry; 35, 247–288.
Riisgård, H. U.; Hansen, S. (1990). Biomagnification of mercury in a marine grazing food-chain: algal cells Phaeodactylum tricornutum, mussels Mytilus edulis and flounders Platichthys flesus studied by means of a stepwise-reduction-CVAA method. Marine Ecology Progress Series; 62, 259-270.
Riley, J. P.; Chester, R. (1971). Introduction to Marine Chemistry. Academic Press, 100p, London, UK Slaveykova, V. I.; Wilkinson, K. J. (2005). Predicting
the bioavailablity of metals and metal complexes: Critial review of the Biotic Lignad Model. Environ. Chem; 2, 9-24.
Suzuki, T. (2004). Mercury Analysis Manual. Analytical methods, Ministry of the Environment, Japan. Turyan, I.; Mandler, D. (1994). Electrochemical
determination of ultra low levels of Hg by ASV using a chemically modified electrode.
Electroanalysis; 6, 833–843.
Turyan, I.; Mandler, D. (1994). Electrochemical determination of ultra low levels of Hg by ASV using a chemically modified electrode.
Electroanalysis; 6, 833–843.
USEPA., (1997). Recommended Guidelines for sampling marine sediment, water column, and tissue in Puget Sound. Sampling guidelines, US-Environmental Protection Agency, USA. Waewtaa; Thongra; Preeda, P. (2002). Total Mercury
Concentrations in Coastal Areas of Thailand: A Review. Science Asia; 28, 301-312.