R E S E A R C H
Open Access
Epileptic foci localization based on
mapping the synchronization of dynamic
brain network
Tian Mei
1,2†, Xiaoyan Wei
1†, Ziyi Chen
3, Xianghua Tian
4, Nan Dong
1, Dongmei Li
5and Yi Zhou
1*FromThe International Conference on Intelligent Biology and Medicine (ICIBM) 2018 Los Angeles, CA, USA. 10-12 June 2018
Abstract
Background:Characterizing the synchronous changes of epileptic seizures in different stages between
different regions is profound to understand the transmission pathways of epileptic brain network and epileptogenic foci. There is currently no adequate quantitative calculation method for describing the propagation pathways of electroencephalogram (EEG) signals in the brain network from the short and long term. The goal of this study is to explore the innovative method to locate epileptic foci, mapping
synchronization in the brain networks based on EEG.
Methods: Mutual information was used to analyze the short-term synchronization in the full electrodes; while nonlinear dynamics quantifies the statistical independencies in the long –term among all electrodes. Then graph theory based on the complex network was employed to construct a dynamic brain network for epilepsy patients when they were awake, asleep and in seizure, analyzing the changing topology indexes.
Results: Epileptic network achieved a high degree of nonlinear synchronization compared to awake time. and
the main path of epileptiform activity was revealed by searching core nodes. The core nodes of the brain network were in connection with the onset zone. Seizures always happened with a high degree of distribution.
Conclusions: This study indicated the path of EEG synchronous propagation in seizures, and core nodes
could locate the epileptic foci accurately in some epileptic patients.
Keywords: Epilepsy, Synchronization, Dynamic brain network, Foci location
Background
Epilepsy is an abnormal disease of the brain network [1], which is caused by large super-synchronous neuronal discharge [2]. The synchronization between different brain regions infers the dynamical interactions of segre-gated brain regions [3]. Characterizing the synchronous changes of epileptic seizures in different stages and in-vestigating the propagation of electroencephalogram (EEG) signals in the brain network will be profound to
understand the transmission pathways of epileptic brain network and locate the seizure onset zone [4,5].
Given the nature of epilepsy, there are undeniably the-oretical hurdles to investigate signal synchronization widely, including linear and nonlinear methods [6]. Mu-tual information (MI) theory can be used to reveal the internal hidden relationships between synchronous sig-nals in short-term [7, 8]. Nonlinear dynamics theory quantifies the nonlinear dependencies among the dy-namics of simultaneously recorded signals in long-term [9, 10]. Studies have shown that nonlinear synchronization can be applied to evaluate the connect-ivity of cortex functions in different brain regions and * Correspondence:[email protected]
†Tian Mei and Xiaoyan Wei contributed equally to this work.
1Department of Biomedical Engineering, Zhongshan School of Medicine, Sun
Yat-sen University, Guangzhou 510080, China
Full list of author information is available at the end of the article
for epileptic foci localization in long-term [11]. However, few studies have focused on the combination of short-term and long-term changes to explore synchron-ous brain networks.
Based on the synchronization, complex network tech-nology is frequently used to investigate the integration of functionally specialized brain regions in a network [12,13]. Some studies summarized analytical and meth-odological elements of epileptic network studies and dis-cussed findings from recent detailed electrophysiological investigations [14]. The preliminary study suggested that seizure foci may be the weakest connected regions in the brain at the beginning of a seizure and the most strongly connected regions may be connected towards the end of a seizure [15]. Hao [16] indicated clustering coefficient was statistically higher in the ictal period than in the inter-ictal period, and there is no obvious difference for their average path length. Some other complex network indicators were also applied to brain network analysis [17]. However, the brain network was mostly limited to medical imaging in a static network. Scale EEG signals have the advantages of superior time-space resolution and real-time monitoring, which make it an excellent tool for constructing dynamic brain networks [18,19].
The study was aimed to construct dynamic brain net-works by mapping the synchronization of the nonlinear characteristics of the EEG. The characteristics of the complex network were analyzed, the propagation of epi-leptic discharges described in the short and long term. This study fills a void in the field of the synchronization relationships of the dynamic brain network, contributing to the localization of seizures.
Materials and methods
Data resource and data preparation Data resource
1) Data inclusion criteria.
In order to ensure the brain network construction and avoid artifacts as much as possible, the data were se-lected by the following criteria:
a)Patients with focal neocortical epilepsy.
b) Obvious EEG changes with inconspicuous body movements.
c)Each patient’s long-range EEG test chart must con-tain at least six or more seizures.
2) Data details.
Based on the above criteria, we can obtain sufficient repetitive sample data and relatively clean sample data for each patient. Patient1 was a 23-year-old female diag-nosed with temporal lobe epilepsy, received treatment at the Department of Neurology, the First Affiliated Hospital of Xinjiang Medical University, Urumqi, China. She had 7 seizures and left temporal postoperative changes detected through MRI. Patient 2 was a
6-year-old boy diagnosed with frontal lobe epilepsy, re-ceived treatment at the Department of Neurology, the First Affiliated Hospital of Sun Yat-sen University, Guangzhou, China, He had 15 seizures and focal cortical dysplasia in the right front lobe detected by MRI.
Data preparation
Electrodes were placed according to the international 10–20 system. A 24-h video-EEG system was used to collect data for a total of 48 h, with a sampling frequency of 2000 Hz. Then the signal was filtered from 0.3-75 Hz. Other artifacts were removed, which had no apparent behavior during seizures. Each seizure was divided into 2–6 segments. Different size of time window was parti-tioned into the same overlapping frames and the synchronization was computed.
Calculation of EEG synchronization
Calculation of the MIs
Kinney JB et al. defined information from the perspec-tive of information uncertainty [20]. The MI can reflect the magnitude and interdependence of information transmission between the two signals. The lower the MI between the two signals, the less similar information there is between them. When the two signals are inde-pendent, the value of MI is zero. By measuring the joint probability density distribution between two variants, MI quantifies the mutual dependence. The algorithm for the calculation of MI is as follows:
Define the probability of discrete random variables X and Y locating in N×N regions. If Pi represents the probability that xi will occur, then the probability of event {X = xi, Y = yi} is pij. The joint of the two var-iables is:
Hxy¼−
XM
i;jpij lgpij ð1Þ
The MI ofXandYis defined as:
Ixy¼HxþHy−Hxy ð2Þ
This study employed the statistical parameters of the total channels MIs, namely the mean value and variable coefficient to describe information interaction and synchronization in the brain.
Nonlinear characteristic T-index matrices
employed to measure the variation in synchronization of the multi-nonlinear characteristics of all channels.
Algorithm for the T-index of every two channels is: When the number of channels is N, the T-index matrix is aN×Nmatrix.
T¼ ffiffiffiffiffiffiffiffiffiffiffiffiffiffiffiffiffiffiffiffiffiffiffiffiffiffiffiX1−X2
S2 C
1 n1þ
1 n2
s ð3Þ
S2 C¼
S2
1ðn1−1Þ þS22ðn2−1Þ
n1þn2−2 ð
4Þ
X1andX2are the mean values of the two samples, S2Cis
the standard deviation of the difference of the mean values, S21andS22 are the variances of the two samples. n1andn2are the data lengths of the samples.
Calculation of nonlinear characteristics
By reconstructing the phase space, Correlation dimen-sion(CD), approximate entropy(ApEn), Hurst exponent (HE), and the principal component analysis index (PCAI) [22, 23] were calculated to describe the chaotic EEG signals.
Cd
CD is a fractal dimension used for the quantitative de-scription of the self-similar structure of a chaotic at-tractor [24]. This algorithm uses the time series to calculate CD directly, which is by far the most common method. Here, the embedding dimensions for the recon-struction of phase space were calculated using improved Cao method [25] using the nearest neighbors. The delay time was calculated using mutual information. The CD algorithm is as follows:
Calculate the contextual integral of the oscillators:
C rð Þ ¼ 2 NmðNm−1Þ
XNm i¼1
XNm
j¼1 j≠i
H r−rij
ð5Þ
C(r) is the correlation integral function of the signals, where ris the hypersphere radius in phase space andm is the embedding dimension. rij=‖x(i)−x(j)‖ represents the Euclidean distance between two random points x(i)
and x(j) among the Nm sample points, among whichHð
rÞ ¼ 10;;rr>≤00
is the Heaviside function.
Within a certain range, C(r)∝rD(m)(r→0), when N→ ∞, D(m) is the correlation dimension:
d2¼ lim r→0
ln C rð Þ
ln r ð6Þ
Draw scale curve lnr−ln C(r), the straight part of which will be the scaling region. Fit the straight line through least squares method. The straight slope is the CD.
ApEn
Approximate entropy is a non-dimensional parameter to represent a signal character from the perspective of measuring the complexity and regularity of signal se-quences. As ApEn measures the probability of new pat-terns, it can quantitatively describe the information included in the specific sequence. The algorithm is de-scribed in our previously published work [26]. Here we set the embedding dimension of compared sequences to m = 2, the threshold value to r=0.25, and the unit time duration for calculation to 1 s.
He
The Hurst exponent is a statistical parameter used to as-sess the chaotic characteristics of time sequences. Which could accurately reveal tendencies in time sequences. The value of HE is between 0 and 1, and quantitatively reflects the long-range correlation between sequences. Rescaled range (R/S) analysis [27].
The algorithm is as follows:
For a given time sequence {x(i)| i = 1, 2, ⋯N}, define the average error of the firstkpoints as:
Wk¼x1þx2þ⋯þkx nð Þ ð7Þ
In the above formula, xðnÞ is the average value ofx1(i= 1, 2…N), 1≤k≤n, 1≤n≤N.
Calculate the difference between the minimum and maximum value ofn’s correspondent average error:
R(n) = max(W1…Wn)−min(W1…Wn), n = 1,2....N (8)
R nð Þ S nð Þ¼
max Wð 1…WnÞffiffiffiffiffiffiffiffiffiffiffi−min Wð 1…WnÞ
S2ð Þn
p ð9Þ
In the above formula, S(n) is the standard deviation of xi(i= 1,2…N)..
Transform the above equation:
RðnÞ
SðnÞ¼anH;n¼1;2…N (10).
In the above formula, H represents the Hurst expo-nent, thenHis:
HðnÞ ¼
log
RðnÞ. SðnÞ
logðnÞ ;n¼1;2…N (11).
PCAI
represent integrated characteristics and represent the center of gravity position of data points and the disper-sion range of group points. In this study, the PCAI rep-resents the distribution balance of nonlinear eigenvectors extracted through PCA. The algorithm is as follows:
Calculate the average value E(x) of each row in recon-structed phase space matrix Y, and calculate the differ-ence between elements in each row of the phase space matrix and the average value of this row, namely
Y¼X−E xð Þ: ð12Þ
Calculate the covariance matrix:
A¼ Y
TY
n−ðm−1Þτ ð13Þ
Calculate the A’s eigenvalue pi and its correspondent eigenvector Ui (i= 1, 2,…m). The eigenvalue and eigen-vector are the principal components.
Sum all the eigenvalues:
γ¼Xm i¼1
pi ð14Þ
Then range the eigenvectors according to their values from small to large. Calculate the standard deviation of principal components distribution:
PCAI=STD(log(pi/γ)) (15).
Construction of brain network The rule for construction network
MI and nonlinear indexes of pairs of nodes were first calculated. The average MI of all channels was selected as the threshold. When two channels’ MIs was larger than the threshold of the total channels, the functions of these two brain regions were considered to be function-ally related. and brain network could be constructed. Then T-matric index of nonlinear characteristic was ap-plied based on such a model.
Methods of localizing core nodes
Degree distribution was chosen as the index for measur-ing network synchronization [29]. The node with the biggest degree is defined as the central node which plays an important role in communication within a brain. If the number of nodes linked to nodeiisk(i), then its de-gree isk(i). Nodes with the largest degrees were marked as the key nodes and the pathways between them marked as key pathways. The actual anatomical connect-ivity between the two regions was not considered in the determination of correlation.
Statistical analysis
Statistics were performed using analysis of variance (ANOVA) models to examine the different characteristic values of synchronization, if data had normal distribu-tions and homogeneous variances. Otherwise, the Kruskal-Wallis test (K-W test) for nonparametric statis-tics was employed. The Tukey method, with its high de-gree of stability, was used for multiple comparisons. The covariance structure was assumed to be compound and symmetric. Analyses were implemented in SPSS (version 18) with a significance level of 0.05. All data are given as mean ± standard deviation (SD).
Results
EEG synchronization in different stages EEG synchronization based on MIs
There were certain differences between the three stages for each patient from the statistical analysis indicated in Tables 1 and 2. For a patient with temporal lobe epi-lepsy, EEG synchronization is at the highest level in the ictal stage and at its lowest level in the awake stage. The synchronization distribution difference is most unbal-anced in the sleep stage and is relatively consistent in the ictal and awake stages. For a patient with frontal lobe epilepsy, EEG synchronization is at the highest level in the ictal stage and synchronization distribution differ-ence is most unbalanced in the ictal stage and most con-sistent in the awake stage.
EEG synchronization based on nonlinear dynamics
Table3shows T-index averages in different stages under global channels. Table 4 displays the corresponding T-test. The EEG of Patient 1, with temporal lobe epilepsy, revealed the prominent statistical difference between the awake and ictal stages. Compared with the awake stage, the ictal stage had a lower synchronization level of ApEn and HE and a higher degree of CD (p< 0.05). The statistical difference be-tween the awake stage and the ictal stage only mani-fested in the T matrix of HE (p< 0.05).
The EEG of the patient with frontal lobe epilepsy re-vealed significant differences between PCAI and ApEn in the three stages (p< 0.05). Compared with the awake stage, the ictal stage had a higher synchronization level of CD and PCAI and lower ApEn. Statistical differences
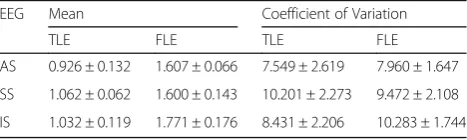
Table 1Global mutual information in three stages
EEG Mean Coefficient of Variation
TLE FLE TLE FLE
AS 0.926 ± 0.132 1.607 ± 0.066 7.549 ± 2.619 7.960 ± 1.647
SS 1.062 ± 0.062 1.600 ± 0.143 10.201 ± 2.273 9.472 ± 2.108
IS 1.032 ± 0.119 1.771 ± 0.176 8.431 ± 2.206 10.283 ± 1.744
between the awake and sleep stages were revealed by all of the 4 eigenvalues (p< 0.05).
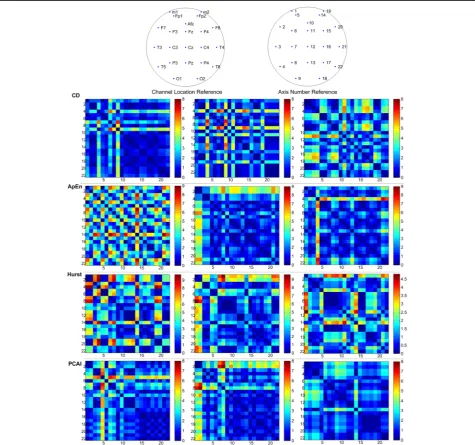
T-index matrix values were distributed differently in different stages. For the patient with temporal lobe epi-lepsy, the seizure usually happened in the sleep stage. From the awake stage to the sleep stage and the ictal stage, the T-index matrix for the nonlinear eigenvalue gradually changed (see Fig. 1). As the CD revealed, the signals in fractal appear to be progressively more con-sistent as the color is more balanced. In the awake stage, the right hemisphere EEG is highly consistent, while glo-bal activity is highly consistent in the ictal stage and the ApEn, HE, and PCAI synchronization levels declined. The ApEn matrix outstands in T5 channel as the color is more vivid, and the PCAI matrix also outstands in a similar area. In the patient with frontal lobe epilepsy, sei-zures usually occurred in the sleep stage. From the sleep stage to the awake stage and on to the ictal stage, only the PCAI T-index matrix showed gradual change.
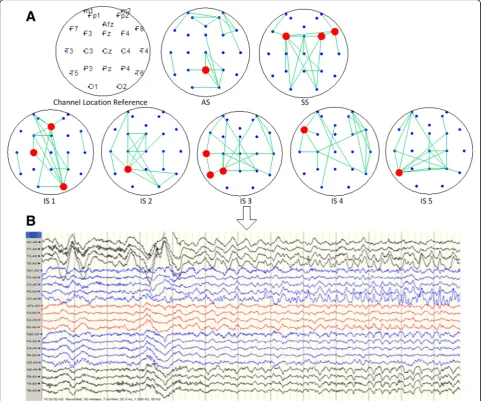
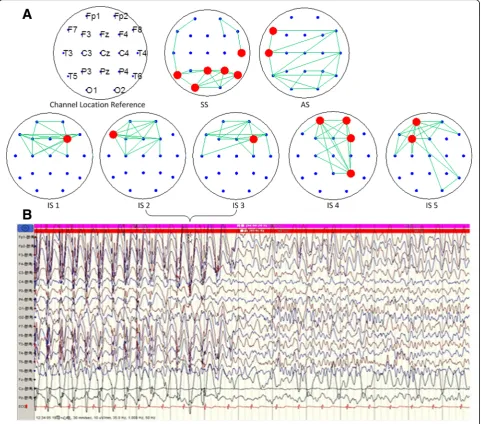
Dynamic network construction results Pathway of synchronous discharge
In this study, the maximum number of connections of the constructed brain network was 271. 20 pairs of channels with the largest MI were displayed in the brain network. Each figure has 20 channels, as shown in Fig.2 and Fig.3. The core nodes of the MI network indicated the location of the abnormal channel. Similar to the brain function network construction based on MI, net-work topology with four indexes can easily be con-structed. The meaning of this remains unclear.
Core node of brain network
The core node in the network is the largest node of the degree distribution. The rubricated channels shown in Fig.2and Fig.3are brain network core nodes, the infor-mation of which is exchanged with the most active nodes with the strongest synchronization impact. From the beginning of sleep stage 2, the core nodes indicate coincide well with the location of an abnormal channel (T3 and T5 for the patient with temporal lobe epilepsy; F4 and Fp2 for the patient with frontal lobe epilepsy). These core nodes near the seizure focus area or appear as a corresponding offside locus.
Conversely, the core node of the network with four in-dexes shows that in the ictal stage, the characteristic values trend towards deviating to the brain hemisphere with the seizure focus. By counting the frequency of the core nodes simultaneously indicated by four characteris-tic networks, the two channels with the highest node de-grees were obtained. As shown in Fig. 4, the network node with nonlinear characteristics in the ictal stage ac-cords with the clinical result of the seizure focus.
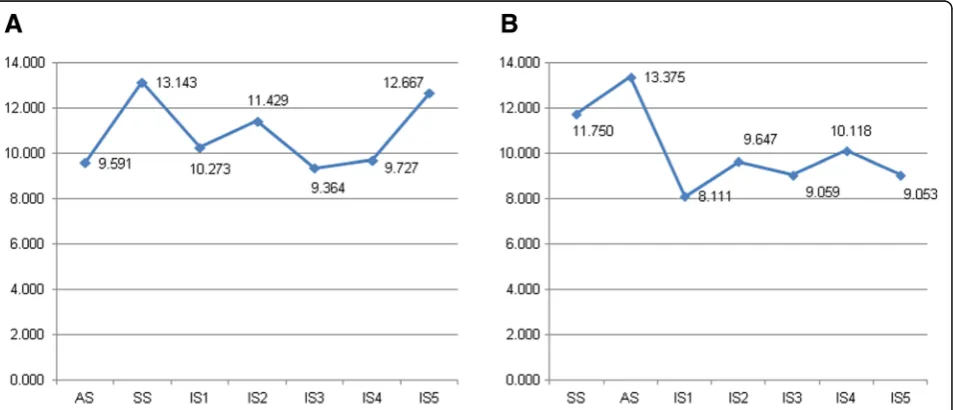
Degree distribution of brain network
The degree distribution of the brain network is shown in Fig. 5. The seizures happen in the brain network state with relatively high degree distribution. When the stage transitions from inter-ictal to seizure, the degree distri-bution of the whole network shows an initial decrease. During the seizure, the low degree distribution of brain network shows a slight increase and then decreases again.
Discussion
According to the synchronization, the whole brain synchronization varies with different EEG states. The distribution of MI in different brain regions differs sig-nificantly in the same state. Previous studies have re-vealed that the MI of each channel in the epileptic foci is higher in seizures than interictal state [30]. This study shows that MI synchronization in the epileptic seizure stage is higher than in the awake stage, which is consist-ent with the global synchronization analysis result ob-tained by previous studies [31, 32]. Meanwhile, EEG signal synchronization is at the lowest level in the awake stage, which is believed to be a result of increased au-tonomous brain activity in the awake stage. It is worth noting that the rise of EEG signal synchronization in the sleep stage is very probably due to the high level of synchronization in partial regions.
The awake stage based on nonlinear eigenvalue shows the highest level of ApEn and HE synchronization as well as the lowest degree of CD, while the seizure stage has the highest degree of CD. Both patients had indi-vidual discrepancies in PCAI synchronization, which
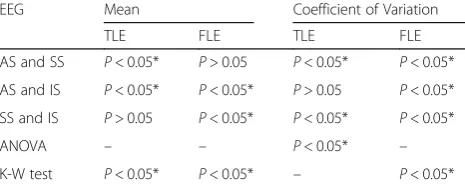
Table 2Statistical results of mutual information in three stages
EEG Mean Coefficient of Variation
TLE FLE TLE FLE
AS and SS P< 0.05* P> 0.05 P< 0.05* P< 0.05*
AS and IS P< 0.05* P< 0.05* P> 0.05 P< 0.05*
SS and IS P> 0.05 P< 0.05* P< 0.05* P< 0.05*
ANOVA – – P< 0.05* –
K-W test P< 0.05* P< 0.05* – P< 0.05*
AS: Awake stage;SS: Sleep stage;IS: Ictal stage;TLE: temporal lobe epilepsy; FLE: frontal lobe epilepsy
Table 3the T-index average value of nonlinear eigenvalue in three stages
stage CD ApEn Hurst PCAI
TLE FLE TLE FLE TLE FLE TLE FLE
AS 1.452 3.902 3.220 2.070 3.099 1.262 1.816 1.075
SS 1.843 3.244 1.948 5.317 2.479 3.194 1.839 1.873
IS 2.154 3.801 1.913 4.443 1.395 2.301 1.601 3.950
Table 4Statistical results of T-index of nonlinear eigenvalues in three stages
stage CD ApEn Hurst PCAI
TLE FLE TLE FLE TLE FLE TLE FLE
AS and SS P< 0.05* P< 0.05* P< 0.05* P< 0.05* P> 0.05 P< 0.05* P> 0.05 P< 0.05*
AS and IS P< 0.05* P< 0.05* P< 0.05* P< 0.05* P< 0.05* P> 0.05 P> 0.05 P< 0.05*
SS and IS P> 0.05 P> 0.05 P> 0.05 P< 0.05* P< 0.05* P< 0.05* P> 0.05 P< 0.05*
K-W test P< 0.05* P< 0.05* P< 0.05* P< 0.05* P< 0.05* P< 0.05* P> 0.05 P< 0.05*
AS: Awake stage;SS: Sleep stage;IS: Ictal stage;TLE: temporal lobe epilepsy;FLE: frontal lobe epilepsy
may arise from the different reference electrodes chosen for the channel. Though HE synchronization in both the seizure and sleep stages in the two patients shows discrepancies, the opposite results were ob-served. This implies that individual discrepancies must be taken into consideration in epileptic seizure detec-tion and the threshold value detecdetec-tion method is unreliable.
The seizures were all found to occur when the brain network has high degrees of distribution. The degrees slightly rise and then drop in the seizure stage. From the perspective of network information flow, epileptic sei-zures occur more easily when the brain network is highly active. When epileptic seizures occur, the
information flow of the brain remains inactive, and the information interaction intensifies as the seizure continues.
For a patient with frontal lobe epilepsy, EEG clinical diagnosis shows that the spike-and-slow wave com-plex activities are mostly dominated by the right
an-terior section (F4 and Fp2) and occasionally
dominated by the left anterior section (F3 and Fp1) in the seizure stage. These involve the whole channel,
and then parts of the seizures shift to
anterior-dominated slow activities, involving the tem-ple (F8) and occipital region (O2). Using the network diagram, we can derive that the network in the pre-frontal region is active in the seizure stage, with the
left and right frontal regions alternately being active, followed by the right posterior occipital region.
For a patient with temporal lobe epilepsy, EEG clinical diagnosis shows that the seizure stage starts from the left temple, and consecutive spike waves can be seen through the left middle and posterior temples (T3 and T5). Using a network diagram, during the seizure the network is first been activated in the left posterior brain region, then becomes symmetrically active in the whole brain, and finally stays active in the right anterior brain region. The brain network connection in the awake stage is quite dispersed. In the sleep stage, temporal lobe epi-lepsy is active in the frontal region, while in frontal lobe
epilepsy activity occurs in the posterior occipital region. In both, activity shies away from the epileptogenic region.
In sum, there are differences between the two patients. For the patient with frontal lobe epilepsy, the main path of the network is: (P4\O1\T4\T5) -(F7\T3)-F4-F7-Fz-(Fp1\Fp2\F4) -(Fp1\F3). While the patient with temporal lobe epilepsy, the main path of the network is: Pz-(F3\F4\F8) -(C3\O2)-P3-(T3\P3)-F7-T5. Contrasted the process of each person’s electroencephalogram to the corresponding clinical diagnosis report, the brain network shifting path in this study is highly consistent with details in the clin-ical diagnosis report.
In the earlier stage of a seizure, activities of neurons at the seizure focus separate, leading the seizure focus nerves to dissociate from the inhibition of peripheral neurons and discharge with intensity [33]. Previous stud-ies found a difference between the brain graphs of af-fected and unaffected hemispheres [34, 35] and compared to EEG signals from epileptic brain areas, sig-nals recorded from epileptogenic brain areas are more
uniform and nonlinear-dependent [36]. In this study, the epileptic foci are quiet in the interictal periods. However, the epileptogenic region activates in the seizure stage and simultaneously becomes the key node of a brain net-work. During an epileptic seizure, the brain network core nodes, which are the most active nodes with the strongest synchronization impacts, shift along with the transfer of synchronous discharge [37]. Our results also
Fig. 4The key channel positions of a brain network constructed based on nonlinear characteristics. Round areas with color are location key channels and elliptic areas with color are seizure foci. The location of the deep sphenoid electrode is represented by the M1 channel
show that the nonlinear characteristic network nodes are consistent with the localization of epileptic foci during clinical diagnosis. Since this article focus on mapping of the map of the EEG network. The construction method of this paper can also be applied to more samples to ex-plore brain synchronization in different conditions.
Conclusions
The accurate foci location will revolutionize the internal and surgical treatment of epilepsy. In this study, we have demonstrated that the way synchronization-based brain networks change along with space-time. The path of EEG synchronous propagation in seizures, and core nodes could locate the epileptic foci accurately in some epileptic patients. Especially MI, gives a quantitative in-formation on the degree of inin-formation interaction in detail, which can be consistent with the clinical mani-festation. Considering that EEG signals reflect the dis-charges of neurons in the brain, the level of EEG synchronization between channels represents the inten-sity of information exchange. Therefore, this study may be served as a benchmark for exploring the dynamic brain network. We hope that study will motivate and guide further development of the epileptic network.
Abbreviations
ANOVA:analysis of variance; ApEn: Approximate Entropy; AS: Awake stage; CD: Correlation Dimension; EEG: electroencephalogram; FLE: frontal lobe epilepsy.; HE: Hurst Exponent; IS: Ictal stage; K-W test: Kruskal-Wallis test; MI: Mutual Information; PCA: Principal Component Analysis; PCAI: Principal Component Analysis Index; SD: standard deviation; SS: Sleep stage; TLE: temporal lobe epilepsy
Acknowledgments
The authors truly express deep gratitude to all those who have helped me during the submission of this paper. And the authors thank the reviewers and editor for their careful review.
Funding
This work was financially supported by the National Natural Science Foundation of China (NSFC) [No. 61876194], The National Key Research and Development Program of China [No. 2018YFC0116902, No.2018YFC0116904, No. 2016YFC0901602], Joint Foundation for the NSFC and Guangdong Science Center for Big Data (No. U1611261], Science and Technology Program of Guangzhou [No. 201604020016], Natural Science Foundation of Xinjiang (No. 2016D01C169), Natural Science Foundation of Guangdong Province [No. 2018A030313345] and Science and Technology Program of Huizhou [No. 2014B010118003]. The publication costs for this article were funded by The National Key Research and Development Program of China [No. 2016YFC0901602].
Availability of data and materials
All data were collected from the patients who had been admitted at First Affiliated Hospital of Sun Yat-sen University, so the clinical data cannot be shared with other research groups without permission.
About this supplement
This article has been published as part of BMC Medical Informatics and Decision Making Volume 19 Supplement 1, 2019: Selected articles from the International Conference on Intelligent Biology and Medicine (ICIBM) 2018: medical informatics and decision making. The full contents of the supplement are available online athttps://bmcmedinformdecismak.biomedcentral.com/articles/ supplements/volume-19-supplement-1.
Authors’contributions
YZ, ZYC and XHT conceived of the study and collected the data. TM and XYW formulate the model and performed the computational coding. DML and ND conducted the data analysis. TM, XYW and ND drafted the manuscript. All the authors read and approved the final version of the manuscript.
Ethics approval and consent to participate
(Not applicable)
Consent for publication
(Not applicable).
Competing interests
The authors declare that they have no competing interests.
Publisher’s Note
Springer Nature remains neutral with regard to jurisdictional claims in published maps and institutional affiliations.
Author details
1Department of Biomedical Engineering, Zhongshan School of Medicine, Sun
Yat-sen University, Guangzhou 510080, China.2Department of Information,
Sixth Affiliated Hospital, Sun Yat-sen University, Guangzhou 510655, China.
3Department of Neurology, First Affiliated Hospital, Sun Yat-sen University,
Guangzhou 510080, China.4Department of Medical Engineering and
Technology, Xinjiang Medical University, Urumqi 830011, China.5College of
Public Health, Xinjiang Medical University, Urumqi 830011, China.
Published: 31 January 2019
References
1. Stam CJ. Modern network science of neurological disorders. Nat Rev Neurosci. 2014;15(10):683.
2. Ravindra VM, Sweney MT, Bollo RJ. Recent developments in the surgical management of paediatric epilepsy. Arch Dis Child. 2017;102(8):760–6. 3. Pastor J, Sola RG, Ortega GJ. Influence of paroxysmal activity on background
synchronization in epileptic recordings. J Neurosci Meth. 2014;223:69–73. 4. Shahaf DB, Shahaf G, Mehta J, Venkatraghavan L. Intracarotid etomidate
decreases the interhemispheric synchronization in electroencephalogram (EEG) during the Wada test. J Neurosurg Anesth. 2016;28(4):341–6. 5. Bandyopadhyay S, Koubeissi MZ, Azar NJ. Physiologic basis of EEG and
epilepsy. In: Epilepsy Board Review: Springer; 2017. p. 3–13.
6. Assi EB, Nguyen DK, Rihana S, Sawan M. Towards accurate prediction of epileptic seizures: a review. Biomed Signal Process Control. 2017;34:144–57. 7. Caballero-Gaudes C, Van de Ville D, Grouiller F, Thornton R, Lemieux L,
Seeck M, Lazeyras F, Vulliemoz S. Mapping interictal epileptic discharges using mutual information between concurrent EEG and fMRI. Neuroimage. 2013;68:248–62.
8. Sharmila A, Geethanjali P. Detection of epileptic seizure from
electroencephalogram signals based on feature ranking and best feature subset using mutual information estimation. J Med Imaging Health Inform. 2016;6(8):1850–64.
9. Strogatz SH. Nonlinear dynamics and chaos: with applications to physics, biology, chemistry, and engineering: CRC Press; 2018.
10. Zhang Z, Zhou Y, Mei T, Chen Z, Du S, Tian X. Localization of epileptic foci based on scalp EEG and approximate entropy. In: International conference on biomedical engineering and informatics: 2014; 2014. p. 240–4. 11. Tibdewal MN, Dey HR, Mahadevappa M, Ray A, Malokar M. Multiple
entropies performance measure for detection and localization of multi-channel epileptic EEG. Biomed Signal Process Control. 2017;38:158–67. 12. Sporns O, Betzel RF. Modular brain networks. Annu Rev Psychol. 2016;
67:613–40.
13. Mierlo PV, Papadopoulou M, Carrette E, Boon P, Vandenberghe S, Vonck K, Marinazzo D. Functional brain connectivity from EEG in epilepsy: seizure prediction and epileptogenic focus localization. Prog Neurobiol. 2014; 121:19–35.
14. Smith EH, Schevon CA. Toward a mechanistic understanding of epileptic networks. Curr Neurol Neurosci Rep. 2016;16(11):97.
epilepsy: seizure prediction and epileptogenic focus localization. Prog Neurobiol. 2014;121:19–35.
16. Hao C, Chen Z, Zhao Z: Analysis and prediction of epilepsy based on visibility graph. In: 2016 3rd International Conference on Information Science and Control Engineering (ICISCE): 2016: IEEE; 2016: 1271–1274. 17. Su L, et al. Influence of resting-state network on lateralization of functional
connectivity in mesial temporal lobe epilepsy. Am J Neuroradiol. 2015;36(8): 1479-87.
18. Allen EA, Damaraju E, Eichele T, Wu L, Calhoun VD. EEG signatures of dynamic functional network connectivity states. Brain Topogr. 2018;31(3):1–16. 19. Juárez-Martinez EL, Nissen IA, Idema S, Velis DN, Hillebrand A, Stam CJ,
Straaten ECWV. Virtual localization of the seizure onset zone: using non-invasive MEG virtual electrodes at stereo-EEG electrode locations in refractory epilepsy patients. Neuroimage Clinical. 2018;19:758–66. 20. Kinney JB, Atwal GS. Equitability, mutual information, and the maximal
information coefficient. Proc Natl Acad Sci U S A. 2014;201309933. 21. Zhang Z, Chen Z, Zhou Y, Du S, Zhang Y, Mei T, Tian X. Construction of
rules for seizure prediction based on approximate entropy. Clin Neurophysiol. 2014;125(10):1959–66.
22. Faust O, Acharya UR, Adeli H, Adeli A. Wavelet-based EEG processing for computer-aided seizure detection and epilepsy diagnosis. Seizure. 2015;26:56–64.
23. Guastello SJ, Gregson RA. Nonlinear dynamical systems analysis for the behavioral sciences using real data: CRC Press; 2016.
24. Osorio I, Harrison MAF, Lai Y-C, Frei MG. Observations on the application of the correlation dimension and correlation integral to the prediction of seizures. J Clin Neurophysiol. 2001;18(3):269–74.
25. Cao L. Practical method for determining the minimum embedding dimension of a scalar time series. Physica D: Nonlinear Phenomena. 1997; 110(1–2):43–50.
26. Mei T, Qiao J, Zhou Y, Gu H, Chen Z, Tian X, Gu K: Analysis of neural oscillations on Drosophila’s subesophageal ganglion based on approximate entropy.Entropy2015, 17(10):6854–6871.
27. Martis RJ, Acharya UR, Tan JH, Petznick A, Tong L, Chua CK, Ng EYK. Application of intrinsic time-scale decomposition (ITD) to EEG signals for automated seizure prediction. Int J Neural Syst. 2013;23(05):1350023. 28. Subasi A, Gursoy MI. EEG signal classification using PCA, ICA, LDA and
support vector machines. Expert Syst Appl. 2010;37(12):8659–66. 29. Vecchio F, Miraglia F, Curcio G, Della Marca G, Vollono C, Mazzucchi E,
Bramanti P, Rossini PM. Cortical connectivity in fronto-temporal focal epilepsy from EEG analysis: a study via graph theory. Clin Neurophysiol. 2015;126(6):1108–16.
30. Lopes MA, Richardson MP, Abela E, Rummel C, Schindler K, Goodfellow M, Terry JR. Elevated ictal brain network ictogenicity enables prediction of optimal seizure control. Front Neurol. 2018;9:98.
31. Schindler K, Rummel C, Andrzejak RG, Goodfellow M, Zubler F, Abela E, Wiest R, Pollo C, Steimer A, Gast H. Ictal time-irreversible intracranial EEG signals as markers of the epileptogenic zone. Clin Neurophysiol. 2016;127(9): 3051–8.
32. Alotaiby TN, Alshebeili SA, Alshawi T, Ahmad I, El-Samie FEA. EEG seizure detection and prediction algorithms: a survey. EURASIP J Adv Signal Process. 2014;2014(1):183.
33. Höller Y, Trinka E. Is there a relation between EEG-slow waves and memory dysfunction in epilepsy? A critical appraisal. Front Hum Neurosci. 2015;9:341. 34. Ouyang G, Wang Y, Yang Z, Li X. Global synchronization of multichannel
EEG in patients with electrical status epilepticus in sleep. Clinical EEG and neuroscience. 2015;46(4):357–63.
35. Bonini F, Lambert I, Wendling F, McGonigal A, Bartolomei F. Altered synchrony and loss of consciousness during frontal lobe seizures. Clin Neurophysiol. 2016;127(2):1170–5.
36. Lopour BA, Staba RJ, Stern JM, Fried I, Ringach DL. Characterization of long-range functional connectivity in epileptic networks by neuronal spike-triggered local field potentials. J Neural Eng. 2016;13(2):026031. 37. Nemtsas P, Birot G, Pittau F, Michel CM, Schaller K, Vulliemoz S, Kimiskidis