R E S E A R C H A R T I C L E
Open Access
The relationship between serum fatty-acid
binding protein 4 level and lung function
in Korean subjects with normal ventilatory
function
Hye-Jeong Park
1, Se Eun Park
1, Cheol-Young Park
1, Seong Yong Lim
2, Won-Young Lee
1, Ki-Won Oh
1,
Sung-Woo Park
1and Eun-Jung Rhee
1*Abstract
Background:The aim of this study was to assess the association of lung function with serum fatty-acid binding protein 4 (FABP4) in apparently healthy Korean adults.
Methods:In 495 participants in a health screening program, Force Exploratory Volume (FEV) 1 and Forced Vital Capacity (FVC) were assessed with standard spirometry. Subjects with obstructive (n= 19) and restrictive (n= 45) lung function were excluded from the analysis. Serum FABP4 level was measured by enzyme-linked immunosorbent assay and transformed into Ln(FABP4). 431 subjects with normal ventilator function (72.4 % men, mean age 41 years) were included in the final analysis.
Results:Mean Ln(FABP4) significantly decreased in subjects from 1stquartile to 4thquartile of FVC (p= 0.008). Ln(FABP4) did not show significant differences across the quartile groups of FEV1. The odds ratio (OR) of being in the lowest quartile of FVC was 2.704 in subject with 3rdtertile of Ln(FABP4) after full adjustment for confounding variables {95 % confidence interval (CI) 1.397 ~ 5.357}. OR of being in the lowest quartile of FEV1 was 1.822 (95 % CI 1.021 ~ 3.298) in subjects with 3rdtertile of Ln(FABP4) after adjustment of age and sex, which was attenuated after full adjustment for confounding variables.
Conclusion:Increased FABP4 level showed increased risk for reduced lung function in subjects with normal ventilatory function.
Keywords:Fatty-acid binding protein-4, Ventilatory function, Adipokine
Background
Adipokines, such as leptin, adiponectin, ghrelin, resistin, and visfatin, are peptides that are secreted from visceral adipose tissues [1]. Adipocytokines secreted from adipose tissue are the results of close interactions between adipo-cytes and immune cells that are infiltrated in adipose tis-sue. Adipocytokines mediate the crosstalk between adipose tissues and other metabolic organs in our body, especially the liver, muscle, pancreas, and the organs of the central nervous system. They maintain metabolic
homeostasis and their dysfunctions have been causally linked to a wide range of metabolic diseases [2–4].
Adipocytokines are known to play a role in the process of development of lung diseases from previous studies [5]. Ghrelin level in circulation is decreased in patients with chronic obstructive pulmonary disease [6]. Visfatin—initially known as pre-B cell colony-enhancing factor—also plays a critical role in some in-flammatory processes, the apoptosis of neutrophils, and the secretion of interleukin-8 from the endothelial cells of the pulmonary artery in humans [7]. Furthermore, decreased forced vital capacity (FVC) or forced expira-tory volume in one second (FEV1), indicating impaired lung function, is associated with persistent low grade
* Correspondence:[email protected]
1Department of Endocrinology and Metabolism, Kangbuk Samsung Hospital,
Sungkyunkwan University School of Medicine, Seoul, Korea Full list of author information is available at the end of the article
systemic inflammation assessed by serum inflammatory markers, such as C-reactive protein (CRP) [8, 9].
Although emerging evidence has shown that pulmon-ary dysfunction has a connection with not only cigarette smoking, but also with obesity, type 2 diabetes, and insu-lin resistance [9–12], only few studies have investigated the relationship between reduced lung function and adi-pocytokine levels. Fatty acid–binding protein 4 (FABP4) is an adipocytokine that is expressed in both adipocytes and macrophages [13]. It is known that the FABP4 level is associated with obesity, insulin resistance, and athero-sclerosis. It has been reported that FABP4 acts as a posi-tive regulator of cellular proliferation; therefore its role in lung function may be important [14]. However, little is known about the relationship between reduced lung function and FABP4 levels.
We therefore assessed the association between in-creased serum FABP4 levels with reduced lung function in apparently healthy Korean adults with normal ventila-tory function.
Methods Study subjects
This study was performed as a sub-study in the Kangbuk Samsung Medical Center (KBSMC)-adipokine study, which is a longitudinal study performed in subjects who received annual health check-ups at the Health Promotion Center at Kangbuk Samsung Hospital in Seoul, Korea, between 2003 and 2007. In 1635 serum samples of the subjects who participated in annual health check-up in 2003, 499 subjects in whom serum adipocytokine levels were available, were selected to participate in this study. Of them, 4 individuals were excluded because they had no available FEV1 or FVC level measurements. In total of 495 subjects, 45 subjects (9.1 %) had restrictive ventilatory pattern and 19 subjects (3.8 %) had obstructive pattern. The final analyses were performed in 431 subjects with normal ventilatory function after exclusion of these 64 subjects.
The study protocol conformed to ethical guidelines of the 2000 Declaration of Helsinki, and accordingly the Kangbuk Samsung Hospital Human Research Committee approved it. The Kangbuk Samsung Hospital Institutional Review Board also approved this study. The informed consent requirement for this study was exempted by the Institutional Review Board at the time the study was in the planning phase because researchers only accessed the database for analysis purposes, which was free of identify-ing personal information.
Measurement of lung function
Spirometry was performed as recommended by the American Thoracic Society, using Vmax22 (SensorMedics, Yorba Linda, CA, USA). Absolute Values of FVC and
FEV1 were obtained and the percentage of predicted values (% pred) for FEV1 and FVC were calculated from the following equations obtained in a representative Korean Population [15].
Predicted FVC ¼ 4:8434– 0:00008633 age2½years þ ð0:05292 height cm½ Þ
þ ð0:01095 weight kg½ Þ
Predicted FEV1 ¼ 3:4132– 0:0002484 age2½years
þ ð0:04578 height cm½ Þ
The highest FVC and FEV1 values of the tests with ac-ceptable curves were used. Ventilatory patterns were de-fined as normal (FVC ≥80 % and FEV1/FVC ≥0.7), restrictive (FVC <80 % and FEV1/FVC ≥0.7; n= 45; 9.1 %), or obstructive (FEV1/FVC <0.7;n= 19; 3.8 %).
Subjects with normal patterns were subdivided into quartiles according to the baseline percentage of predicted values (% predicted) for FVC or FEV1. Based on the FVC, the resulting four categories were as follows: ≤99.3 % in quartile 1, 99.3–104.4 % in quartile 2, 104.4–112.7 % in quartile 3, and >112.7 % in quartile 4. Similarly, the sub-jects were also divided into quartiles based on the FEV1 values (% predicted): ≤97.9 % in quartile 1, 97.9–106.9 % in quartile 2, 106.9–118.2 % in quartile 3, and >118.2 % in quartile 4.
Anthropometric measurements and laboratory tests
Trained physicians carried out the anthropometric mea-surements including height, weight, and body fat per-centage. Systolic (SBP) and diastolic blood pressures (DBP) were measured according to the Hypertension De-tection and Follow-up Program protocol by using a mer-cury blood pressure device after the subjects had rested longer than 5 min [16]. For the cases with a SBP higher than 140 mmHg and a DBP higher than 90 mmHg, the BP was measured two more times after resting and the average value was used. Body mass index (BMI) (kg/m2) was calculated by dividing the weight (kg) by the squared height (m).
and an inter-assay coefficient of variance of 1.4 to 3.3 %. The results were presented as milligrams per liter and the limit of measurement was 0.175 mg/L, with a sample dilu-tion of 1:20. Insulin resistance status was calculated by using the homeostatic model assessment-insulin resist-ance (HOMA-IR) [17]. The formula used for calculation was as follows:
HOMA‐IR ¼ ðfasting insulin½μIU=mL
fasting blood glucose mM=LÞ=22:5:
Measurement of serum FABP4 levels
Serum FABP4 levels were measured using an enzyme-linked immunosorbent assay (ELISA; BioVendor Laboratory Medicine, Modrice, The Czech Republic). The intra- and inter-assay coefficients of variation (CVs) were 5.0 and 9.8 %, respectively.
Subjects were divided into three groups according to the Ln(FABP4); 1st tertile: Ln(FABP4) < 2.04, 2nd tertile: 2.04≤Ln(FABP4) < 2.41, 3rdtertile: Ln(FABP4)≥2.41.
Evaluation of body composition
Body composition measurements of the subjects were car-ried out by segmental bioelectric impedance, using eight tractile electrodes according to the manufacturer’s instruc-tions (InBody 3•0, Biospace, Korea). Lean mass (kg), fat mass (kg), percent fat mass (%), and waist-hip ratio (WHR) as a marker of abdominal obesity, were measured.
Statistical analysis
Statistical analysis was performed with SPSS version 18.0 (PASW Statistics version 18.0 (SPSS Inc., Chicago, IL, USA). Data are represented as mean descriptive statistics and were used to describe the mean ± SD. Descriptive sta-tistics were used to describe the study population at the baseline. The assessment for the normality of the variables was done with Kormogorov–Smirnov test and the FABP4 values were log-transformed as they did not follow a nor-mal distribution. The comparisons of mean values of the variables among the subdivided groups were performed by Kruskal-Wallis test or one-way ANOVA and multiple comparison tests were performed with post hoc analysis. The chi-square test was used for cross-tabulation analysis. Stepwise multiple logistic regression analyses were per-formed to evaluate the associations between FABP4 and being in the lowest FVC and FEV1 (% pred) quartiles after adjustment for confounding factors. A 95 % confidence interval (CI) was determined for each risk. For all statis-tical tests used, apvalue <0.05 was considered significant.
Results
Clinical characteristics of total study participants according to the ventilatory pattern
Clinical characteristics of the total study population based on the ventilatory patterns are presented in Table 1. 431 (87.1 %) subjects had normal ventilator pattern, 45 (9.1 %) had restrictive ventilatory pattern and 19 (3.8 %) subjects had obstructive ventilatory pattern. Mean age of the partici-pants was 41 years. Subjects with restrictive ventilator pat-tern were younger and leaner than subjects with normal ventilatory pattern. The subjects with obstructive ventila-tory pattern showed similar metabolic profiles to subjects with normal ventilatory pattern. There were no significant differences in FABP4 levels among the three groups.
Further analyses were performed only in subjects with normal ventilatory function (N= 431).
Comparisons of metabolic components by quartiles of FVC and FEV1 (% pred) in subjects with normal ventilatory function
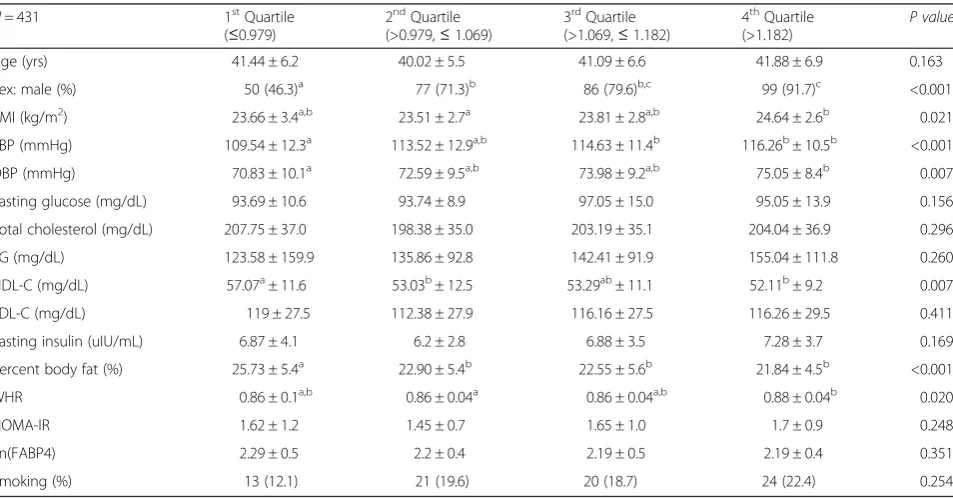
Mean age of the subjects with normal ventilatory function was 41 years and 312 subjects (72.4 %) were men. When the mean values of metabolic parameters were compared according to the quartiles of FVC (% pred), age, HDL-C and percent body fat showed significant differences among the groups (Table 2). The mean values of HDL-C and per-cent body fat decreased from quartile 1 to quartile 4. Mean Ln(FABP4) significantly decreased from quartile 1 to quartile 4 of FVC (% pred) (Table 2, Fig. 1).
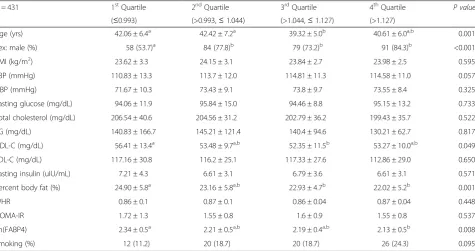
When the mean values of metabolic parameters were compared according to the quartiles of FEV1 (% pred), mean values of BMI, BP, HDL-C, percent body fat and WHR showed significant differences among the groups (Table 3). The mean values of BMI and BP increased as the quartiles of FEV1 (% pred) increased from quartile 1 to quartile 4. Mean HDL-C values decreased from quartile 1 to quartile 4. Other components of metabolic syndrome showed inconsistent results. The mean percent body fat of 1st quartile was significantly lower than other quartile groups (p< 0.001). The mean Ln(FABP4) values did not show significant differences across the quartile groups.
Table 1Baseline characteristics of total population
All (N= 495) Normal (N= 431) Restrictive (N= 45) Obstructive (N= 19) P value
Age (yrs) 40.83 ± 6.27 41.10 ± 6.30a 38.96 ± 5.95b 39.05 ± 5.46a,b 0.041
Sex: male (%) 327 (66.1) 312 (72.4) 7 (15.6) 8 (42.1) <0.001
BMI (kg/m2) 23.63 ± 2.96 23.90 ± 2.92a 21.50 ± 2.63b 22.59 ± 2.42a,b <0.001
SBP (mmHg) 112.91 ± 12.21 113.48 ± 12.03a 106.67 ± 11.68b 114.74 ± 13.89a,c 0.001
DBP (mmHg) 72.67 ± 9.51 73.11 ± 9.40a 68.00 ± 9.19b 73.68 ± 10.12a,c 0.002
Fasting glucose (mg/dL) 94.40 ± 12.08 94.88 ± 12.40 90.84 ± 10.34 92.05 ± 5.50 0.071
Total cholesterol (mg/dL) 200.89 ± 35.72 203.34 ± 36.05a 182.53 ± 27.36b 188.74 ± 31.66a,b <0.001
Triglyceride (mg/dL) 132.75 ± 111.83 139.19 ± 117.52a 87.13 ± 40.43b 94.74 ± 40.30a,b 0.004
HDL-C (mg/dL) 54.21 ± 11.23 53.88 ± 11.31 57.07 ± 10.18 54.95 ± 11.27 0.185
LDL-C (mg/dL) 114.44 ± 28.11 115.91 ± 28.08a 102.54 ± 26.34b 105.84 ± 26.25a,b 0.008
Fasting insulin (uIU/mL) 6.72 ± 3.45 6.80 ± 3.56a 6.74 ± 2.64a,b 4.83 ± 1.89c 0.051
Percent body fat (%) 23.55 ± 5.47 23.26 ± 5.46a 26.04 ± 4.80b 24.27 ± 5.94a,b 0.004
WHR 0.86 ± 0.05 0.86 ± 0.05a 0.83 ± 0.04b 0.85 ± 0.04a,b <0.001
HOMA-IR 1.58 ± 0.94 1.60 ± 0.96 1.55 ± 0.81 1.11 ± 0.46 0.076
FVC (% pred) 1.01 ± 0.16 1.04 ± 0.13a 0.71 ± 0.08b 1.02 ± 0.16b,c <0.001
FEV1 (% pred) 1.05 ± 0.19 1.09 ± 0.16a 0.75 ± 0.10b 0.76 ± 0.12b <0.001
Ln(FABP4) 2.21 ± 0.45 2.22 ± 0.45 2.18 ± 0.38 2.10 ± 0.52 0.490
Smoking (%) 80 (16.2) 78 (18.1) 1 (2.2) 1 (5.3) 0.009
Different superscripts denote a significant difference between groups Values were expressed as Mean ± SD or N (%)
BMIbody mass index,SBPsystolic blood pressure,DBPdiastolic blood pressure,HDL-Chigh-density lipoprotein cholesterol,LDL-Clow-density lipoprotein cholesterol, WHRwaist-hip ratio,HOMA-IRhomeostasis model assessment-insulin resistance,FVCforce vital capacity,FEV1forced expiratory volume in 1 s,Ln(FABP4)logarithmized form of fatty-acid binding protein 4
Table 2Comparisons of metabolic components by quartile of FVC (% pred) among subjects with normal ventilator function
N= 431 1stQuartile 2ndQuartile 3rdQuartile 4thQuartile P value
(≤0.993) (>0.993,≤1.044) (>1.044,≤1.127) (>1.127)
Age (yrs) 42.06 ± 6.4a 42.42 ± 7.2a 39.32 ± 5.0b 40.61 ± 6.0a,b 0.001
Sex: male (%) 58 (53.7)a 84 (77.8)b 79 (73.2)b 91 (84.3)b <0.001
BMI (kg/m2) 23.62 ± 3.3 24.15 ± 3.1 23.84 ± 2.7 23.98 ± 2.5 0.595
SBP (mmHg) 110.83 ± 13.3 113.7 ± 12.0 114.81 ± 11.3 114.58 ± 11.0 0.057
DBP (mmHg) 71.67 ± 10.3 73.43 ± 9.1 73.8 ± 9.7 73.55 ± 8.4 0.325
Fasting glucose (mg/dL) 94.06 ± 11.9 95.84 ± 15.0 94.46 ± 8.8 95.15 ± 13.2 0.733
Total cholesterol (mg/dL) 206.54 ± 40.6 204.56 ± 31.2 202.79 ± 36.2 199.43 ± 35.7 0.522
TG (mg/dL) 140.83 ± 166.7 145.21 ± 121.4 140.4 ± 94.6 130.21 ± 62.7 0.817
HDL-C (mg/dL) 56.41 ± 13.4a 53.48 ± 9.7a,b 52.35 ± 11.5b 53.27 ± 10.0a,b 0.049
LDL-C (mg/dL) 117.16 ± 30.8 116.2 ± 25.1 117.33 ± 27.6 112.86 ± 29.0 0.650
Fasting insulin (uIU/mL) 7.21 ± 4.3 6.61 ± 3.1 6.79 ± 3.6 6.61 ± 3.1 0.571
Percent body fat (%) 24.90 ± 5.8a 23.16 ± 5.8a,b 22.93 ± 4.7b 22.02 ± 5.2b 0.001
WHR 0.86 ± 0.1 0.87 ± 0.1 0.86 ± 0.04 0.87 ± 0.04 0.448
HOMA-IR 1.72 ± 1.3 1.55 ± 0.8 1.6 ± 0.9 1.55 ± 0.8 0.537
Ln(FABP4) 2.34 ± 0.5a 2.21 ± 0.5a,b 2.19 ± 0.4a,b 2.13 ± 0.5b 0.008
Smoking (%) 12 (11.2) 20 (18.7) 20 (18.7) 26 (24.3) 0.095
Different superscripts denote a significant difference between groups Values were expressed as Mean ± SD or N (%)
Multiple logistic regression analyses for Ln(FABP4) with lowest quartiles of FVC and FEV1 (% pred) as the dependent variable in subjects with normal ventilatory function
Stepwise multiple logistic regression analyses were per-formed with being in the lowest quartile of FVC (%
pred) as the dependent variable (Table 4). The odds ratio (OR) of being in the lowest quartile of FVC (% pred) was 2.193 in subjects with 3rdtertile of Ln(FABP4) after adjustment for age and sex with the 1st tertile of Ln(FABP4) as the reference {95 % CI 1.239 ~ 3.949}. When the analysis was performed with full adjustment
Fig. 1Comparisons of mean Ln(FABP4) among the quartile groups of FVC (% pred) in subjects with normal lung function
Table 3Comparisons of metabolic components by quartile of FEV1 (% pred) among subjects with normal ventilator function
N= 431 1stQuartile
(≤0.979)
2ndQuartile
(>0.979,≤1.069)
3rdQuartile
(>1.069,≤1.182)
4thQuartile
(>1.182) P value
Age (yrs) 41.44 ± 6.2 40.02 ± 5.5 41.09 ± 6.6 41.88 ± 6.9 0.163
Sex: male (%) 50 (46.3)a 77 (71.3)b 86 (79.6)b,c 99 (91.7)c <0.001
BMI (kg/m2) 23.66 ± 3.4a,b 23.51 ± 2.7a 23.81 ± 2.8a,b 24.64 ± 2.6b 0.021
SBP (mmHg) 109.54 ± 12.3a 113.52 ± 12.9a,b 114.63 ± 11.4b 116.26b± 10.5b <0.001
DBP (mmHg) 70.83 ± 10.1a 72.59 ± 9.5a,b 73.98 ± 9.2a,b 75.05 ± 8.4b 0.007
Fasting glucose (mg/dL) 93.69 ± 10.6 93.74 ± 8.9 97.05 ± 15.0 95.05 ± 13.9 0.156
Total cholesterol (mg/dL) 207.75 ± 37.0 198.38 ± 35.0 203.19 ± 35.1 204.04 ± 36.9 0.296
TG (mg/dL) 123.58 ± 159.9 135.86 ± 92.8 142.41 ± 91.9 155.04 ± 111.8 0.260
HDL-C (mg/dL) 57.07a± 11.6 53.03b± 12.5 53.29ab± 11.1 52.11b± 9.2 0.007
LDL-C (mg/dL) 119 ± 27.5 112.38 ± 27.9 116.16 ± 27.5 116.26 ± 29.5 0.411
Fasting insulin (uIU/mL) 6.87 ± 4.1 6.2 ± 2.8 6.88 ± 3.5 7.28 ± 3.7 0.169
Percent body fat (%) 25.73 ± 5.4a 22.90 ± 5.4b 22.55 ± 5.6b 21.84 ± 4.5b <0.001
WHR 0.86 ± 0.1a,b 0.86 ± 0.04a 0.86 ± 0.04a,b 0.88 ± 0.04b 0.020
HOMA-IR 1.62 ± 1.2 1.45 ± 0.7 1.65 ± 1.0 1.7 ± 0.9 0.248
Ln(FABP4) 2.29 ± 0.5 2.2 ± 0.4 2.19 ± 0.5 2.19 ± 0.4 0.351
Smoking (%) 13 (12.1) 21 (19.6) 20 (18.7) 24 (22.4) 0.254
Different superscripts denote a significant difference between groups Values were expressed as Mean ± SD or N (%)
for confounding variables, OR for being in the lowest quartile of FVC (% pred) was 2.704 in subjects with 3rd tertile of Ln(FABP4) (95 % CI 1.397 ~ 5.357).
Similar analyses were performed with being in the lowest quartile of FEV1(% pred) as the dependent vari-able (Tvari-able 5). OR of being in the lowest quartile of FEV1 (% pred) was 1.822 in subjects with 3rd tertile of Ln(FABP4) after adjustment for age and sex. However, further adjustment for confounding variables attenuated the significance (Table 5).
Discussion
Our study is the first study that revealed the association between FABP4 and lung function. The major finding of this study was that the concentration of serum FAPB4 increased as the lung function decreased within the nor-mal range of lung function, after adjustment for a wide range of variables, including age, gender, current smok-ing, BP, FBG, BMI, HOMA-IR, lipid profile, and percent body fat, when the study population was divided into quartiles based on FVC or FEV1 (% pred). Multiple lo-gistic regression and stepwise lolo-gistic regression revealed that increased serum FABP4 correlated with an in-creased risk for reduced lung function, especially show-ing significant correlation with FVC.
Impaired lung function is known to be associated with an increased prevalence and mortality of cardiovascular dis-ease. It is well recognized that severe obesity is associated
with impaired lung function [18, 19]. Most population stud-ies that examined the relationship between obesity and lung function used BMI as a measurement of overall adiposity and insignificant or weak associations have been reported, with diminished lung function at both extremes of the BMI distribution [20]. Recently, it was suggested that fat mass, and fat-free mass might have distinct effects on pulmonary function. Several studies reported inverse associations be-tween lung function and measures of central adiposity, such as the waist circumference and the WHR [21–23]. Al-though recent studies suggest the association of impaired lung function and metabolic syndrome with total body fat [24], there have been few studies investigating the relation-ship between lung function and the related markers.
Adipocytokines are a group of hormone-like mediators secreted by adipose tissues. They were first described as regulators of energy metabolism, but were later also rec-ognized as being produced by inflammatory cells and be-ing involved in many immune and inflammatory processes in the human body [1]. Recently, adipocytokines have also been found to mediate inflammatory responses in the human lung, and associations between the levels of some adipocytokines and obstructive airway diseases have been described [4–6]. It is not well-known that obesity may play a significant role in the pathogenesis of pulmon-ary diseases through mechanisms in association with pro-inflammatory mediators produced from adipose tissues, and they contribute to a low-grade systemic inflammation.
Table 4Multiple logistic regression analyses with lowest
quartile of FVC(% pred) as dependent variable among subjects with normal ventilator function
OR 95 % CI
Model 1
Ln(FABP4), 1sttertile 1 –
Ln(FABP4), 2ndtertile 1.736 0.969 ~ 3.154
Ln(FABP4), 3rdtertile 2.193 1.239 ~ 3.949
Model 2
Ln(FABP4), 1sttertile 1 –
Ln(FABP4), 2ndtertile 1.817 1.002 ~ 3.340
Ln(FABP4), 3rdtertile 2.337 1.251 ~ 4.451
Model 3
Ln(FABP4), 1sttertile 1 –
Ln(FABP4), 2ndtertile 2.034 1.093 ~ 3.845
Ln(FABP4), 3rdtertile 2.704 1.397 ~ 5.357
Model 1, adjusted for covariates with age, sex; Model 2, adjusted as Model 1 plus significant covariables (smoking, SBP, HDL-C, percent body fat); Model 3, fully adjusted as Model 2 plus insignificant covariables (fasting glucose, DBP, TG, LDL-C, fasting insulin, WHR, HOMA-IR, BMI)
FVCforced vital capacity,ORodds ratio,CIconfidence interval,Ln(FABP4) logarithmized form of fatty-acid binding protein 4,SBPsystolic blood pressure, HDL-Chigh-density lipoprotein cholesterol,DBPdiastolic blood pressure,TG triglyceride,LDL-Clow-density lipoprotein cholesterol,WHRwaist-hip ratio, HOMA-IRhomeostasis model assessment-insulin resistance; BMI, body mass index
Table 5Multiple logistic regression analyses with lowest
quartile of FEV1(% pred) as dependent variable among subjects with normal ventilatory function
OR 95 % CI
Model 1
Ln(FABP4), 1sttertile 1 –
Ln(FABP4), 2ndtertile 1.547 0.858 ~ 2.819
Ln(FABP4), 3rdtertile 1.822 1.021 ~ 3.298
Model 2
Ln(FABP4), 1sttertile 1 –
Ln(FABP4), 2ndtertile 1.406 0.767 ~ 2.597
Ln(FABP4), 3rdtertile 1.579 0.840 ~ 3.002
Model 3
Ln(FABP4), 1sttertile 1 –
Ln(FABP4), 2ndtertile 1.512 0.816 ~ 2.827
Ln(FABP4), 3rdtertile 1.574 0.819 ~ 3.056
Model 1, adjusted for covariates with age, sex; Model 2, adjusted as Model 1 plus significant covariables (SBP, DBP, HDL-C, body fat percentage); Model 3, fully adjusted as Model 2 plus insignificant covariables (smoking, glucose, TG, fasting insulin, percentage body fat, WHR, HOMA-IR, BMI)
In animal models, inflammatory responses in the lung have been shown to influence the production of adipocy-tokines, leptin and adiponectin, cyadipocy-tokines, acute phase proteins, and other mediators produced by adipose tis-sues, which may participate in immune responses in lungs [5, 25, 26]. An increased adipose tissue mass may also in-fluence susceptibility to pulmonary infections, enhance pulmonary inflammation associated with environmental exposures, and exacerbate airway obstruction in preexist-ing lung diseases [27].
In our study, the FABP level increased as the FVC (% pred) decreased within the normal range of lung function after adjustment for other variables. FABP4 belongs to a family of cytosolic chaperones that are involved in systemic regulation of lipid and glucose metabolism [13]. FABP4 has been implicated in several aspects of the metabolic syn-drome in mice, including insulin resistance and atheroscler-osis [28–32]. The level of circulating human FABP4 was proposed as an independent prognostic marker for the de-velopment of metabolic syndrome, non-alcoholic fatty liver and diabetes [33–36]. To date, the mechanism by which FABP4 promotes insulin resistance, inflammation or pul-monary dysfunction are not fully understood. Decreased FVC or FEV1 has been shown to be persistent in low-grade systemic inflammatory status assessed by increased serum levels of inflammatory markers, such as CRP [8, 9, 37, 38]. Our results imply that FABP4 might also act as a pro-inflammatory adipocytokine and affect pulmonary function. Further research is needed to clarify the role of FABP4 on pulmonary function or inflammation.
Our study has a few limitations. First, our study is cross-sectional study; therefore, we cannot know the cause-effect relationship between FABP4 levels and lung func-tion. Second, the correlation of serum FABP4 and lung function is limited to the FVC (% pred). The reason why FABP4 level did not show significant correlation with FEV1 could not be clarified. Third, as the analyses were performed regarding the relationship only between the FABP4 levels and lung function, the possible effects of other adipocytokines on FABP4 and lung function could not be separately analyzed. In addition, it could be inter-esting to see other FABPs such as FABP5 and FABP1 in relation to lung function in future studies. Despite these limitations, our study has strength in that this is the first study that analyzed the relationship between FABP4 and lung function in apparently healthy adults.
Conclusions
In summary, the results of this study indicate that increased FABP4 is related with reduced lung function, especially de-creased FVC (% pred) even after adjustment for confound-ing factors in subjects with normal lung function. Further prospective studies are needed to clarify the effect of FABP4 on lung function.
Additional file
Additional file 1: Table S1.Comparisons of the metabolic components in the lowest quartile and other quartiles of FVC (% pred) among subjects with normal ventilatory function.Table S2.Comparisons of the metabolic components in the lowest quartile and other quartiles of FEV1 (% pred) among subjects with normal ventilatory function. (DOCX 18 kb)
Abbreviations
BMI:Body mass index; CI: Confidence interval; CRP: C-reactive protein; DBP: Diastolic blood pressure; FABP4: Fatty acid–binding protein 4; FBG: Fasting blood glucose; FEV1: Forced expiratory volume in one second; FVC: Forced vital capacity; HDL-C: High-density lipoprotein cholesterol; HOMA-IR: Homeostasis model assessment-insulin resistance; LDL-C: Low-density lipoprotein cholesterol; SBP: Systolic blood pressure; TC: Total cholesterol; TG: Triglyceride; WHR: Waist-hip ratio.
Competing interests
The authors declare that they have no competing interests.
Authors’contributions
HJP analyzed the data and wrote the manuscript. SEP, CYP, SYL, WYL, KWO and SWP helped collect the data and commented on the manuscript. EJR had full access to all of the data in the study and take responsibility for the integrity of the data and the accuracy of the data analysis. All authors read and approved the final manuscript.
Author details
1
Department of Endocrinology and Metabolism, Kangbuk Samsung Hospital, Sungkyunkwan University School of Medicine, Seoul, Korea.2Division of
Pulmonary and Critical Care Medicine, Department of Internal Medicine, Kangbuk Samsung Hospital, Sungkyunkwan University School of Medicine, Seoul, Korea.
Received: 13 July 2015 Accepted: 2 February 2016
References
1. Cao H. Adipocytokines in obesity and metabolic disease. J Endocrinol. 2014;220(2):T47–59.
2. Ouchi N, Kihara S, Funahashi T, Matsuzawa Y, Walsh K. Obesity, adiponectin and vascular inflammatory disease. Curr Opin Lipidol. 2003;14(6):561–6. 3. Ouchi N, Ohashi K, Shibata R, Murohara T. Adipocytokines and
obesity-linked disorders. Nagoya J Med Sci. 2012;74(1–2):19–30.
4. Ouchi N, Parker JL, Lugus JJ, Walsh K. Adipokines in inflammation and metabolic disease. Nat Rev Immunol. 2001;11(2):85–97.
5. Shore SA. Obesity and asthma: cause for concern. Curr Opin Pharmacol. 2006;6(3):230–6.
6. Luo FM, Liu XJ, Li SQ, Wang ZL, Liu CT, Yuan YM. Circulating ghrelin in patients with chronic obstructive pulmonary disease. Nutrition. 2005;21(7–8):793–8.
7. Jia SH, Li Y, Parodo J, Kapus A, Fan L, Rotstein OD, et al. Pre-B cell colony-enhancing factor inhibits neutrophil apoptosis in experimental inflammation and clinical sepsis. J Clin Invest. 2004;113(9):1318–27. 8. Lawlor DA, Ebrahim S, Smith GD. Associations of measures of lung function
with insulin resistance and Type 2 diabetes: findings from the British Women’s Heart and Health Study. Diabetologia. 2004;47(2):195–203. 9. Lim SY, Rhee EJ, Sung KC. Metabolic syndrome, insulin resistance and
systemic inflammation as risk factors for reduced lung function in Korean nonsmoking males. J Korean Med Sci. 2010;25(10):1480–6.
10. Kim SK, Hur KY, Choi YH, Kim SW, Chung JH, Kim HK, et al. The Relationship between Lung Function and Metabolic Syndrome in Obese and Non-Obese Korean Adult Males. Korean Diabetes J. 2010;34(4):253–60.
11. Oda E, Kawai R. A cross-sectional relationship between vital capacity and diabetes in Japanese men. Diabetes Res Clin Pract. 2009;85(1):111–6. 12. Oda E, Kawai R. A cross-sectional relationship between vital capacity and
13. Garin-Shkolnik T, Rudich A, Hotamisligil GS, Rubinstein M. FABP4 attenuates PPARgamma and adipogenesis and is inversely correlated with
PPARgamma in adipose tissues. Diabetes. 2014;63(3):900–11.
14. Elmasri H, Karaaslan C, Teper Y, Ghelfi E, Weng M, Ince TA, et al. Fatty acid binding protein 4 is a target of VEGF and a regulator of cell proliferation in endothelial cells. FASEB J. 2009;23(11):3865–73.
15. Choi JK, Paek D, Lee JO. Normal predictive values of spirometry in Korean population. Tuberc Respir Dis (Seoul). 2005;58(3):230–42.
16. Curb JD, Ford C, Hawkins CM, Smith EO, Zimbaldi N, Carter B, et al. A coordinating center in a clinical trial: the Hypertension Detection and Followup Program. Control Clin Trials. 1983;4(3):171–86.
17. Matthews DR, Hosker JP, Rudenski AS, Naylor BA, Treacher DF, Turner RC. Homeostasis model assessment: insulin resistance and beta-cell function from fasting plasma glucose and insulin concentrations in man. Diabetologia. 1985;28(7):412–9.
18. Jubber A. Respiratory complications of obesity. Int J Clin Pract. 2004;58(6): 573–80.
19. Ray CS, Sue DY, Bray G, Hansen JE, Wasserman K. Effects of obesity on respiratory function. Am Rev Respir Dis. 1983;128(3):501–6.
20. Maiolo C, Mohamed EI, Carbonelli MG. Body composition and respiratory function. Acta Diabetol. 2003;40 Suppl 1:S32–8.
21. Cotes JE, Chinn DJ, Reed JW. Body mass, fat percentage, and fat free mass as reference variables for lung function: effects on terms for age and sex. Thorax. 2001;56(11):839–44.
22. Lazarus R, Sparrow D, Weiss ST. Effects of obesity and fat distribution on ventilatory function: the normative aging study. Chest. 1997;111(4):891–8. 23. Santana H, Zoico E, Turcato E, Tosoni P, Bissoli L, Olivieri M, et al. Relation between body composition, fat distribution, and lung function in elderly men. Am J Clin Nutr. 2001;73(4):827–31.
24. Wannamethee SG, Shaper AG, Whincup PH. Body fat distribution, body composition, and respiratory function in elderly men. Am J Clin Nutr. 2005; 82(5):996–1003.
25. Mancuso P. Obesity and lung inflammation. J Appl Physiol. 1985;108(3):722–8. 26. Wang C. Obesity, inflammation, and lung injury (OILI): the good. Mediat
Inflamm. 2014;2014:978463.
27. Gurzu B, Zugun FE, Costuleanu M, Mihaescu T, Carasevici E, Petrescu G. Adipokines involvement in lung function. Rev Med Chir Soc Med Nat Iasi. 2008;112(3):719–25.
28. Furuhashi M, Fucho R, Gorgun CZ, Tuncman G, Cao H, Hotamisligil GS. Adipocyte/macrophage fatty acid-binding proteins contribute to metabolic deterioration through actions in both macrophages and adipocytes in mice. J Clin Invest. 2008;118:2640–50.
29. Furuhashi M, Tuncman G, Gorgun CZ, Makowski L, Atsumi G, Hotamisligil GS. Treatment of diabetes and atherosclerosis by inhibiting fatty-acid-binding protein aP2. Nature. 2007;447(7147):959–65.
30. Hotamisligil GS, Johnson RS, Distel RJ, Ellis R, Papaioannou VE, Spiegelman BM. Uncoupling of obesity from insulin resistance through a targeted mutation in aP2, the adipocyte fatty acid binding protein. Science. 1996;274(5291):1377–9.
31. Maeda K, Cao H, Kono K, Gorgun CZ, Furuhashi M, Uysal KT, et al. Adipocyte/macrophage fatty acid binding proteins control integrated metabolic responses in obesity and diabetes. Cell Metab. 2005;1(2):107–19. 32. Makowski L, Boord JB, Maeda K, Babaev VR, Uysal KT, Morgan MA, et al. Lack
of macrophage fatty-acid-binding protein aP2 protects mice deficient in apolipoprotein E against atherosclerosis. Nat Med. 2001;7(6):699–705. 33. Kaess BM, Enserro DM, McManus DD, Xanthakis V, Chen MH, Sullivan LM, et
al. Cardiometabolic correlates and heritability of fetuin-A, retinol-binding protein 4, and fatty-acid binding protein 4 in the Framingham Heart Study. J Clin Endocrinol Metab. 2012;97(1):E1943–7.
34. Stejskal D, Karpisek M. Adipocyte fatty acid binding protein in a Caucasian population: a new marker of metabolic syndrome? Eur J Clin Invest. 2006; 36(9):621–5.
35. Jeon WS, Park SE, Rhee EJ, Park CY, Oh KW, Park SW, et al. Association of serum adipocyte-specific Fatty Acid binding protein with Fatty liver index as a predictive indicator of nonalcoholic Fatty liver disease. Endocrinol Metab (Seoul). 2013;28(4):283–7.
36. Lee TH, Jeon WS, Han KJ, Lee SY, Kim NH, Chae HB, et al. Comparison of Serum Adipocytokine Levels according to Metabolic Health and Obesity Status. Endocrinol Metab (Seoul). 2015;30(2):185-94.
37. Lin WY, Yao CA, Wang HC, Huang KC. Impaired lung function is associated with obesity and metabolic syndrome in adults. Obesity (Silver Spring). 2006;14(9):1654–61.
38. Nakajima K, Kubouchi Y, Muneyuki T, Ebata M, Eguchi S, Munakata H. A possible association between suspected restrictive pattern as assessed by ordinary pulmonary function test and the metabolic syndrome. Chest. 2008;134(4):712–8.
• We accept pre-submission inquiries
• Our selector tool helps you to find the most relevant journal
• We provide round the clock customer support
• Convenient online submission
• Thorough peer review
• Inclusion in PubMed and all major indexing services
• Maximum visibility for your research
Submit your manuscript at www.biomedcentral.com/submit