T E C H N I C A L A D V A N C E
Open Access
Ear biometrics for patient identification in
global health: a field study to test the
effectiveness of an image stabilization
device in improving identification accuracy
Lauren P. Etter
1, Elizabeth J. Ragan
2, Rachael Campion
1, David Martinez
1and Christopher J. Gill
3*Abstract
Background:In many low and middle-income countries (LMICs), difficulties in patient identification are a major obstacle to the delivery of longitudinal care. In absence of unique identifiers, biometrics have emerged as an attractive solution to the identification problem. We developed an mHealth App for subject identification using pattern recognition around ear morphology (Project SEARCH (Scanning EARS for Child Health). Early field work with the SEARCH App revealed that image stabilization would be required for optimum performance.
Methods:To improve image capture, we designed and tested a device (the‘Donut’), which standardizes distance, angle, rotation and lighting. We then ran an experimental trial with 194 participants to measure the impact of the Donut on identification rates. Images of the participant’s left ear were taken both with and without use of the Donut, then processed by the SEARCH algorithm, measuring the top one and top ten most likely matches. Results:With the Donut, the top one identification rate and top ten identification rates were 99.5 and 99.5%, respectively, vs. 38.4 and 24.1%, respectively, without the Donut (P< 0.0001 for each comparison). In sensitivity analyses, crop technique during pre-processing of images had a powerful impact on identification rates, but this too was facilitated through the Donut.
Conclusions:By standardizing lighting, angle and spatial location of the ear, the Donut achieved near perfect identification rates on a cohort of 194 participants, proving the feasibility and effectiveness of using the ear as a biometric identifier.
Trial registration:This study did not include a medical intervention or assess a medical outcome, and therefore did not meet the definition of a human subjects research study as defined by FDAAA. We did not register our study underclinicaltrials.gov.
Keywords:Ear biometrics, Identification, Patient identification, Global health, Public health, Electronic medical record, Image stabilization, Pattern recognition algorithm
© The Author(s). 2019Open Access This article is distributed under the terms of the Creative Commons Attribution 4.0 International License (http://creativecommons.org/licenses/by/4.0/), which permits unrestricted use, distribution, and reproduction in any medium, provided you give appropriate credit to the original author(s) and the source, provide a link to the Creative Commons license, and indicate if changes were made. The Creative Commons Public Domain Dedication waiver (http://creativecommons.org/publicdomain/zero/1.0/) applies to the data made available in this article, unless otherwise stated.
* Correspondence:[email protected]
3Department of Global Health, Boston University School of Public Health, 801
Massachusetts Avenue, Boston, MA 02118, USA
Background
Any public health, clinical, or research program that re-quires collecting and acting upon longitudinal data crit-ically depends on accurately and repeatedly identifying individuals over time and space.
Consider a newborn baby girl in Boston. There, her routine well-child care is delivered seamlessly because she is easily identified using multiple identifiers: home address, birth certificate, name and date of birth, insur-ance card, social security number, etc. Now, imagine that same infant girl in rural Zambia. As in many low and middle-income countries (LMICs), she has no formal mailing address; she is too young to have been named (in Zambia, naming is often deferred until 6 weeks of age); her family is too poor to participate in the national insurance system; and since she was delivered at home, a still-frequent occurrence in many countries, her birth was never formally registered, leaving her without a birth certificate or social security number.
Given this reality, a Zambian infant’s well-child care is coordinated using an‘Under Five Card’, a 4 × 5 inch hard stock paper trifold which remains the mother’s responsi-bility to retain. When cards are lost or degraded to illegi-bility, a child’s vaccination history, growth curves, HIV screening data, and acute care history are irretrievably lost. In Zambia, as in many LMICs, the lack of robust patient identification renders even routine medical care fragmented, redundant, porous, and inefficient, and is a major barrier to the effective management of prevent-able and chronic diseases.
Recent years have seen an explosion of interest in de-veloping electronic medical records (EMRs) adapted for LMICs to help facilitate longitudinal care and transfer the burden of record retention from the patient back to the clinic [1–6]. However, the enormous potential of EMRs can only be realized once the problem of subject identification has been solved. This is far from a reality. With the growing ubiquity of smartphones with power-ful processing capacity, mobile health (mHealth) applica-tions (Apps) may be particularly suited to solving the patient identification problem [7,8].
In Project SEARCH (Scanning EARs for Child Health), our multidisciplinary team of public health, engineering, and computer science faculty and students at Boston University (BU) has focused on solving the identification problem through pattern recognition ana-lysis of biometric data, using ear morphology as the identi-fier. Biometric data offer distinct advantages over external identifiers. By definition, biometric features are intrinsic and cannot be lost, left at home, sold, or traded. And the choice of ears is logical, offering clear advantages over other biometric identifiers: finger prints are stigmatized by associ-ation with law enforcement; faces lack anonymity; and iris/ retinal scans require magnification and external lighting,
rendering them futile for infants. By contrast, ears are im-personal, easily imaged with a smartphone’s camera with little to no discomfort, and are as unique as fingerprints [9–19].
Former work under the scope of Project SEARCH has involved three studies. In the analog proof of concept, a 3-dimensional object (the ear) was rendered into a set of stereotypical digital features. In a blinded matching exer-cise, an individual ear allowed for high re-identification rates (83%), proving the ear identifiable even with a rela-tively crude, analog approach [20]. In the digital proof of concept evaluation, Project SEARCH created the first version of the SEARCH mobile app. The App was built around a powerful pattern recognition algorithm (PRA) called ‘Scale Invariant Feature Transform’ (SIFT), [21] and allows one to register a new subject, capture an image of the ear, render it into a digital matrix, add this to a library of digital renditions, and then later interro-gate that library of renditions to obtain a match. [22] The results from this experiment provided context that the SEARCH App was viable, but highlighted clear limi-tations. Most notably, the experiment used a set of im-ages taken from an on-line database and did not evaluate the App’s performance in the face of random error introduced by the image capture process. In the third experiment, the‘real-world’ evaluation, a birth co-hort of 50 infants at a local pediatrics office were en-rolled in a study to assess the process of image capture and how this affected the App’s performance. The ana-lysis yielded critical results: random error around image capture had a profound negative impact on the accuracy of identification resulting in an inadequate recapture ac-curacy of just 27.3% (unpublished). All previous work clearly highlighted that in order for this simplified, computationally-efficient method to work, there was a need to minimize sources of random variation during image capture.
Results from these previous experiments set the stage for the current study, which was conceived and con-ducted by a team of three Boston University under-graduate engineering students in fulfilment of their senior project requirement under mentorship from pro-fessors of engineering and public health. The twin goals of this study were: (1) to design an image stabilization device that would improve the rate of re-identification by neutralizing variables of lighting, distance, and angle of image capture; and (2) to test how the use of this de-vice improved individual identification rates using the SEARCH algorithm.
Methods
[13, 22, 23]. Under previous work through Project SEARCH, a student team from the Computer Science Department at Boston University analyzed three com-mon feature extraction methods and their accuracy when applied to ear biometric identification: Local Bin-ary Patterns (LBPs), Generic Fourier Descriptor (GFD), and Scale Invariant Feature Transform (SIFT). To analyze these methods, the SEARCH team used 493 ear images of 125 subjects from the IIT Delhi Ear Image Database, and found that SIFT gave the highest accuracy in identifying the top 1 match correctly (96.5%) [22]. Since images were taken from an ear image database, where conditions of illumination and out of plane image capture angle are non-variable, this initial analysis did not take into account variables present in the field. Pro-ject SEARCH used the SIFT algorithm in the form of an iOS application, to test on a cohort of 50 infants in a clinical setting. In the face of random error, recapture rate plummeted to 27.3% (unpublished). The need to control for random error inherent in field settings set the stage for our current experiment.
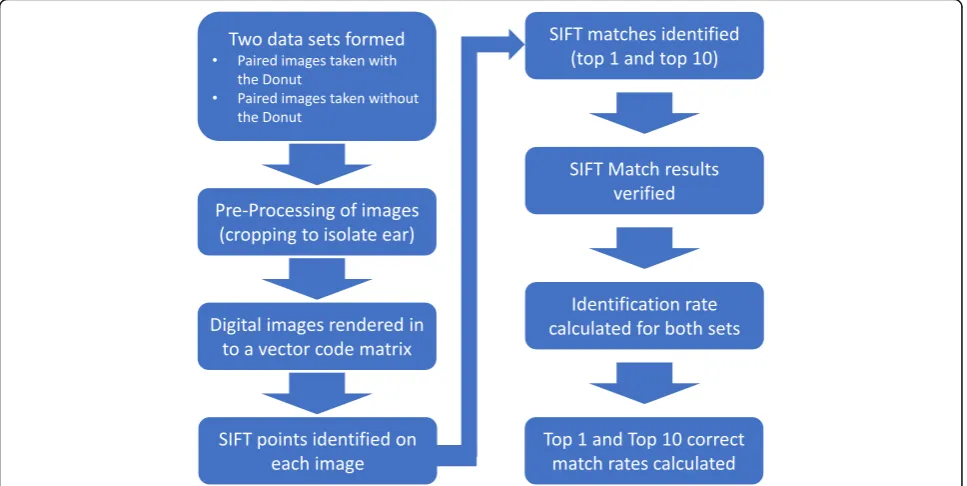
For our experiment, we use the Matlab algorithm de-veloped in that initial study (with few modifications) in order to test the effect that neutralizing random error in the image capture process has on identification rates. The algorithm reads in two datasets of images (denoted first visit and second visit images, respectively), which are passed in as single precision, greyscale images. The images undergo a preprocessing step to resize and auto-crop all images passed into the system. Prepro-cessing limits the number of pixels that the open-source SIFT functions analyze, drastically cutting down processing time, which simulates implementation in a mobile application. After preprocessing, the algorithm reads in the first visit images to establish the cohort, and loops through the second visit images independ-ently. A best (top one) match and a top ten list of matches for each image are determined based on a set of SIFT features, i.e. points of high contrast in the image. Each image is designated a SIFT feature vector, and the match is determined using a function that com-pares SIFT feature vectors. After all second visit images are read in and matched to images in the first visit dataset, the algorithm determines if the correct match was made. The correct match is determined by a func-tion that checks if the matches made (both top one and top ten, independently) had the same image name. The name assigned to the images correspond to the partici-pant number, and thus are the same in each dataset. An identification rate is computed (for both a top 1 match and a top 10 match), and the process repeats, using the second visit images to establish the cohort, looping in-dependently through first visit images. The average of both processes is taken as the overall identification rate,
yielding an averaged top match identification rate, and an average top ten identification rate. The algorithm runs twice, once yielding identification rates for images taken with the Donut (standardizing variables in the image capture process) and the second time yielding identification rates for images taken without the Donut (random error present). Fig. 1 provides a visual repre-sentation of the algorithm; access to the Matlab func-tions and main script are provided as Additional file1.
Device manufacture method
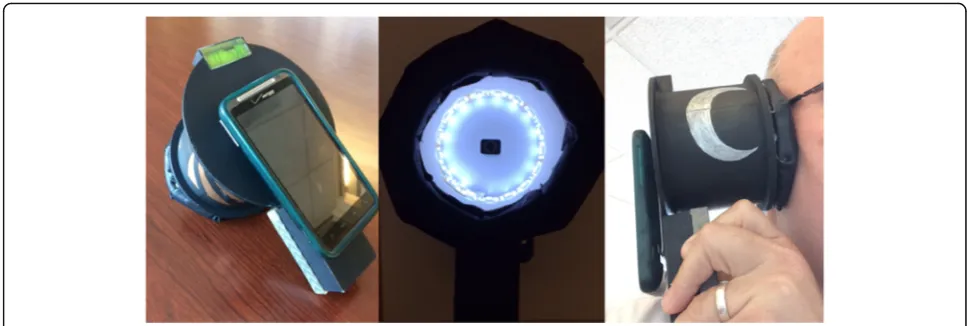
The Donut was first modeled using a Computer Aided Design software, CREO. This model was converted to an STL file, adjusting chord length and angle for optimal 3D printing. The Donut was manufactured using a Uprint 3D printer, painted black to neutralize external light, and then assembled with the remaining design fea-tures. The circuit was secured to the bottom circumfer-ence of the Donut. Foam padding with an antimicrobial leather covering were attached to the top circumference (the area in contact with the patient’s head) in order to provide comfort and sterility. Finally, a bubble level (to standardize rotation of image capture) and Velcro (to easily mount the phone) were adhered to the back of the Donut. The final version that advanced to field testing is shown in Fig.2.
Clinical study methodology
To validate the impact of the Donut on identification accu-racy, we conducted a field study among BU undergraduate students, all of whom provided informed consent. This involved creating a cohort and database of ear images taken both with and without use of the Donut. After receiving IRB approval, the cohort was established by contacting a number of different student organizations across Boston University’s campus.
To simulate two distinct patient visits at a clinic, we constructed our experimental study to capture two sets of pictures of each participant’s ear under different light-ing conditions. To accomplish this, we stationed one study coordinator on one side of a classroom, and sta-tioned a second study coordinator across the room fa-cing a different direction (altering the ambient light).
Fig. 1This figure depicts high-level system architecture of the Matlab algorithm used in our experiment
Table 1Pugh Chart for Alternate Design Analysis
Concepts
Criteria Weight Diffused LED plate Electroluminescent Ribbons LED Strip
Shadow 2 0 0 +
Power Required 1 0 0 –
Shape 1 0 + +
Buy/Make 1 0 0 +
Price 1 0 – 0
Weighted Total 0 0 3
The participant visited the first study coordinator, where two images of their left ear were captured (one with the Donut and one without). These two images taken under identical ambient light, were designated ‘first visit’ im-ages for the corresponding datasets (with and without Donut). The participant then walked to the second study coordinator where the process was repeated –
designat-ing ‘second visit’ images for the corresponding datasets
(with and without Donut). A total of four images of each participant’s left ear were collected - two images taken with the Donut (first and second visit images), and two images taken without the Donut (first and second visit images).
Power assumptions and statistical analysis
Based on Project SEARCH’s prior analog and digital proof of concept studies, we conservatively estimated the probability of a correct match at 80%: assuming that the Donut improved identification by 10%, we would need 199 participants. A type 1 error for the null hy-pothesis was 0.05 with 80% power. We used an uncor-rected chi squared analysis to evaluate the null hypothesis that our device did not improve the identifi-cation accuracy. Once identifiidentifi-cation accuracies were de-termined, we used an uncorrected chi squared analysis to determine the statistical significance of using the Donut to aid the image capture process.
In order to analyze data from our study, we modified the previously developed Matlab algorithm used by SEARCH [22]. After running an image through the en-tire database, an ‘identification’ or match is determined, which corresponds to the image stored in the database that has the most matching SIFT points, i.e., points of high contrast [21,23].
Two distinct identification accuracies, equivalent to match probability, were determined by running the
Matlab algorithm twice – once using all images taken with the Donut and once using all images taken without the Donut. To analyze images taken with the Donut, two data sub-sets (‘first visit’, with Donut;‘second visit’, with Donut) were passed into the Matlab algorithm as single-precision, greyscale images. A pre-processing step was done, using built in Matlab functions, to crop and resize all images. Pre-processing limited the number of pixels that the algorithm analyzed, which drastically cut down processing time, allowing the algorithm to simulate the speed needed to be effectively implemented in a mobile application. We tested a number of different dimensions in order to determine the ideal crop for images both with and without the device, respectively.
Next, the algorithm established the ‘first visit’ images as the database, and looped through the ‘second visit’ images independently, finding a best (top one) match and a top ten list of matches for each image, ranked in order of most likely match. After all‘second visit’images were read in and matched to images in the database, the algorithm determined: 1) if the correct match was made (top one), or 2) if the correct match resided within the top ten most likely matches (top ten).
An identification accuracy was computed (for both a top one match and a top ten match), and the process was repeated using the ‘second visit’images as the data-base, and looping independently through the ‘first visit’ images. The average of both processes was taken as the overall identification accuracy, yielding an averaged top match identification accuracy, and an averaged top ten identification accuracy.
In order to most accurately compare improvement due to solely lighting and angle we analyzed the bias in-troduced by an automated cropping methodology. We completed a sensitivity analysis, with the goal of
assessing whether or not pre-processing the images had a different effect between the two image datasets (with and without use of Donut). To accomplish this, we ran the algorithm multiple times, changing both the crop length (corresponding to ear length) and the crop width (corresponding to ear width) of images taken with and without the Donut. We analyzed how changing these variables affected the output of top one identification ac-curacy. Sensitivity was quantified as the change in iden-tification accuracy with respect to change in crop. If sensitivity values were large (> 1), we deemed that the identification accuracy was largely affected by the crop. If values were largely different between the two datasets (with and without Donut), this would signify that pre-processing introduced bias between the datasets.
Results
Creating the Donut
Internal lighting of the device was deemed the most im-portant design feature. Without a way to control for variable lighting conditions, we would be unable to im-prove the signal-to-noise ratio, thus the rate of re-identification. An LED strip inlaid along the inner cir-cumference of the device proved the best solution for standardizing internal lighting, notably reducing shadow more than alternatives, such as a diffused LED plate or electroluminescent ribbons. To achieve optimal lighting, we powered the device with a 9 V battery–chosen due to its optimized voltage for the LED strip, availability, and it being an easily replaceable power supply. In order to maintain consistent illumination, we wired the battery in series with a 33-Ωresistor, which served as a voltage regulator. As the battery runs down, light intensity stays constant above a critical threshold and then switches off (rather than slowly dimming, as with the common household flashlight). Dimensions of the device were de-termined from research on the focus length of cell-phone cameras and the average size of the human ear. [25] These dimensions, which define the inner diameter and the depth of the device, were constrained by the average skull size of an infant (4 in.) [26]. The final spec-ifications for the device are shown in Table 2. Aesthetic appropriateness of the Donut was achieved by employing similar methodology used in the GE Adventure Series (Fig.2)[24], [27,28].
Evaluation of the impact of the Donut on identification rates Complete image sets were obtained from 194 partici-pants enrolled in the study. Cohort demographics are
summarized in Table 3. The majority of participants were Caucasian (62%) and male (60%). All were under-graduate students at Boston University who had been in-vited to participate after SEARCH team members made brief presentations at classes and to on campus student groups.
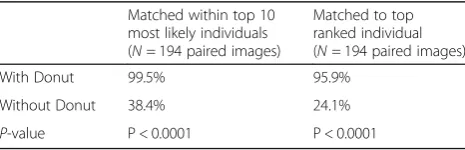
After processing the images through the MatLab algo-rithm, the following identification accuracies were deter-mined. Images taken with use of the Donut yielded a top one match accuracy of 95.9% and a top 10 match accur-acy of 99.5%, significantly outperforming the matching rates without the Donut (Table4).
A sensitivity analysis was performed to determine what effect pre-processing the images had on identification rates. Figures 3a-d outline the results of the sensitivity analysis. In both cases (with and without the Donut), identification accuracy was most sensitive when chan-ging the length of the crop (corresponding to cropping the length of the ear), while cropping the width of the ear had little to no effect on identification accuracies. There was little difference in sensitivity values between the two datasets.
Additionally, we found that the Donut localized the ear during image capture. In order to be processed efficiently by the MatLab algorithm, images must be cropped and resized. For images taken with the Donut, we created an automatic crop in MatLab based on the edges of the Donut in the image. For images taken without the Donut, however, the ear was in a number of different spatial loca-tions, making automatic crop dimensions difficult to de-termine and leading to cropping of parts of the image containing the ear, decreasing the identification accuracy.
Discussion
In this experiment, we showed that the SEARCH algo-rithm’s performance was significantly improved with the use of an image stabilization/standardization device (i.e., the Donut). A direct comparison of the results from this experiment show that, with the device, we improved the identification accuracy from just under 40 to > 96% for the single most likely match, and to > 99% within the top 10 most likely matches. A previously completed study was able to get an accuracy of 80%, without any device, by employing a box on the screen of the phone in which a user would place the ear. Using this prior study as our benchmark expected value of 80%, our current results significantly exceeded our expectations. As hypothesized, quality control around image capture, and the ability to standardize lighting, distance,
Table 2Final Device Dimensions
Inner Diameter Depth Battery Box Width Battery Box Height Battery Box Length
centering, rotation, and angle of capture, is a key deter-minant of the accuracy of biometric matching via pat-tern recognition algorithms and is a problem that is readily addressed using our simple mechanical engineer-ing solution. We view this as a major step forward in Project SEARCH, and one that allows us to move for-ward with improving our design in future iterations.
Over the course of this experiment, we came across a number of notable findings. First, we found that hair oc-clusion within the image, in addition to lighting and ro-tation angle, was another factor that interfered with the image capture and identification process. While we had not planned this explicitly, it turned out that the design of the Donut tended to keep hair out of the image by consistently enclosing the ear during image capture. This is important because the pattern recognition algorithm is sensitive to all elements within the image, and hair, being mobile and therefore impossible to standardize, could be a source of a significant degree of random error. This unforeseen advantage to our device further limited the variables involved in the image capture process, likely contributing to the increased identifica-tion accuracy on images taken with our device. The im-plication is that future iterations of the Donut should include some method to systematically and more effect-ively exclude hair from the image, perhaps by including an internal shroud that would cup and therefore isolate the ear from the hair, head and neck, limiting the data for the SIFT algorithm to information just from the ear.
Additionally, through pre-processing the images, we found that our Donut localized spatial location of the ear, while images taken without the Donut did not. Because of this, automatic crop dimensions were
Table 3Demographics of cohort
Variables n= 194
Race, % Caucasian 120 (62%) Asian 45 (23%) Hispanic 13 (7%) African American 6 (3%) Other 10 (5%) Sex, % Male 116 (60%)
Female 78 (40%)
This table identifies the demographics of our 194 participant cohort. Both race and gender demographics are broken down by number and percent
Table 4Identification accuracies with and without use of the Donut
Matched within top 10 most likely individuals (N= 194 paired images)
Matched to top ranked individual (N= 194 paired images) With Donut 99.5% 95.9%
Without Donut 38.4% 24.1%
P-value P < 0.0001 P < 0.0001
The identification accuracies are shown as percentages for each case: with Donut, top 10 accuracy; with Donut, top 1 accuracy; without Donut, top 10 accuracy; without Donut, top 1 accuracy
determined for each dataset, independently. Since the Donut localized the ear during image capture, automatic crop dimensions were easier to determine in comparison to images taken without the Donut. This further em-phasizes the need to standardize how the image is centered on the ear during capture, a problem that could be solved by software modifications to the SEARCH App (e.g., by including an on-screen C-shaped guided to align with the edge of the ear while taking the image), through post-capture automatic processing of the image, through design modifications to the Donut, or poten-tially all three.
Although our experiment was successful in many ways, there were clear limitations to our study that need to be addressed in future work. Major limitations to our methodology include that 1) this experiment was not done using an infant cohort, 2) identification accuracies were determined using a computer algorithm, not a fully developed smartphone application, and 3) there are newer computational methods that should also be con-sidered and compared to SIFT’s performance. First, the most rapid period of ear growth occurs within the first few years of an infant’s life, and the algorithm has not been validated in a longitudinal field study on a cohort of infants. Validation in this context is a clear next step for testing the SEARCH platform. Second, our experi-ment tested identification rates using an algorithm after all data had been collected, and did not make use of a developed smartphone application. The application would need to be fully developed and tested in the field to prove that the capabilities of the application match that of the computer algorithm. Planning of a pragmatic field study in Zambia by assembling a longitudinal cohort of infants is currently underway. Lastly, these ex-periments used SIFT as the pattern recognition algo-rithm of choice. Since the start of SEARCH, there have been several advancements in the development of deep learning models in the field of computer vision. It should be noted that these models, although requiring a large amount of data to train, have the potential to im-prove performance in ear recognition. As research con-tinues under Project SEARCH, an effort to explore these models is underway.
Conclusions
Our experiment adds to previous work done through Project SEARCH aimed at proving ear biometrics an ac-curate and reliable method of patient identification. We demonstrated viability of the SEARCH App in a real-world context, and proved that image standardization and stabilization through a device could minimize ran-dom error during image capture and thereby improve accuracy. This project has proven that our device is both
necessary and effective for identifying individuals using a SIFT biometric recognition algorithm. In the future, by combining our device with an application, Project SEARCH will have a cost effective, accurate way to iden-tify and link patients to their medical records in Zambia.
Additional file
Additional file 1:Matlab functions and main script. (ZIP 4 kb)
Abbreviations
App:Application; BU: Boston University; CREO: A computer aided design software; LED: light emitting diode; LMIC: Low and Middle-Income Countries; mHealth: mobile health; SEARCH: Scanning Ears for Child Health; SIFT: Scale-Invariant Feature Transform
Acknowledgments
We would like to thank Professor William Hauser from the Mechanical Engineering Department at Boston University for his contributions and support throughout the study. We would also like to acknowledge and thank Dr. Sarah Bargal at the Boston University Computer Science Department for her time and support with the project, particularly in regard to the MatLab algorithm.
Authors’contributions
The experiment was conceived, designed and executed by all LE, DM, RC, ER and CJG. Design of the device was completed by LE, DM and RC. Data collection and extraction into the algorithm was also by LE, DM and RC. LE wrote the paper, with contributions from ER and CJG. All authors read and approved the final manuscript.
Funding
SEARCH was funded through a pilot grant provided by Boston University School of Public Health and through a crowd-funding campaign led by the SEARCH team. Funding for this portion of the project was used on materials to manufacture the Donut prototype. The funder played no role in the de-sign, implementation or interpretation and reporting of this work.
Availability of data and materials
The datasets used and/or analyzed during the current study are available from the corresponding author on reasonable request.
Ethics approval and consent to participate
This study was approved by the Institutional Review Board of Boston University Medical Campus under protocol H35788. All participants provided written informed consent.
Consent for publication
All participants provided consent for publication of images.
Competing interests
The authors declare that they have no competing interests.
Author details 1
College of Engineering, Boston University, Boston, MA, USA.2Department of Medicine, Section of Infectious Diseases, Boston Medical Center, Boston, USA.
3
Department of Global Health, Boston University School of Public Health, 801 Massachusetts Avenue, Boston, MA 02118, USA.
Received: 24 October 2018 Accepted: 6 June 2019
References
doi.org/10.1186/1472-6947-13-95. PubMed PMID: 23981292; PubMed Central PMCID: PMCPMC3766002.
2. Tapsfield JB, Jane Bates M. Hospital based palliative care in sub-Saharan Africa; a six month review from Malawi. BMC Palliat Care. 2011;10:12. Epub 2011/07/12.https://doi.org/10.1186/1472-684X-10-12. PubMed PMID: 21740584; PubMed Central PMCID: PMCPMC3146929.
3. Oluoch T, Santas X, Kwaro D, Were M, Biondich P, Bailey C, et al. The effect of electronic medical record-based clinical decision support on HIV care in resource-constrained settings: a systematic review. Int J Med Inform. 2012; 81(10):e83–92. Epub 2012/08/28.https://doi.org/10.1016/j.ijmedinf.2012.07. 010. PubMed PMID: 22921485.
4. Ali MK, Shah S, Tandon N. Review of electronic decision-support tools for diabetes care: a viable option for low- and middle-income countries? J Diabetes Sci Technol 2011;5(3):553-70. Epub 2011/07/05.https://doi.org/10. 1177/193229681100500310. PubMed PMID: 21722571; PubMed Central PMCID: PMCPMC3192622.
5. Hotchkiss DR, Diana ML, Foreit KG. How can routine health information systems improve health systems functioning in low- and middle-income countries? Assessing the evidence base. Adv Health Care Manag 2012;12: 25–58. Epub 2012/08/17. PubMed PMID: 22894044.
6. Piette JD, Lun KC, Moura LA, Jr., Fraser HS, Mechael PN, Powell J, et al. Impacts of e-health on the outcomes of care in low- and middle-income countries: where do we go from here? Bull World Health Organ. 2012;90(5): 365–72. Epub 2012/05/17.https://doi.org/10.2471/BLT.11.099069. PubMed PMID: 22589570; PubMed Central PMCID: PMCPMC3341688.
7. van Velthoven MH, Car J, Zhang Y, Marusic A. mHealth series: new ideas for mHealth data collection implementation in low- and middle-income countries. J Glob Health 2013;3(2):020101. Epub 2013/12/24.https://doi.org/ 10.7189/jogh.03.020101. PubMed PMID: 24363911; PubMed Central PMCID: PMCPMC3868820.
8. van Heerden A, Tomlinson M, Swartz L. Point of care in your pocket: a research agenda for the field of m-health. Bull World Health Organ. 2012; 90(5):393–4. Epub 2012/05/17. doi:https://doi.org/10.2471/BLT.11.099788. PubMed PMID: 22589575; PubMed Central PMCID: PMCPMC3341694. 9. Jain A, Ross A, P S. An introduction to biometric recognition. IEEE
Transactions on Circuits Systems and Video Technology. 2004.https://doi. org/10.1109/TCSVT.2003.818349.
10. Burge M, B W. Ear biometrics in computer vision. Proceedings of the international conference on pattern recognition. 2000:822–6. 11. Iannerelli AV. Ear identification (forensic identification series). Paramount
publishing company; 1989.
12. Yan P, KB. Ear biometrics using 2D and 3D images. Proceedings IEEE Conference Computer Vision and Pattern Recognition Workshop in Advanced 3D imaging for safety and security2005. p. 121.
13. Chang K, Bowyer K, Sarkar S, B. V. Comparison and combination of ear and face images in appearance-based biometrics. IEEE Transactions Pattern Analysis Machine Intelligence2003. p. 1160–65.
14. Moreno B, AS. On the use of outer ear images for personal identification in security applications. Proceedings of IEEE 33rd annual international conference on Secruity Technology1999. p. 469–76.
15. Pun K, YM. Recent advances in ear biometrics. Proceedings of the sixth IEEE International Conference on automatic face and gesture recognition2004. p. 164–69.
16. Khursheed F, AM. time series model based personal verification using ear biometrics. 4th international conference on computer and communication Technology2013. p. 264–68.
17. Ibrahim MI, Nixon MS, SM. The effect of time on ear biometrics. IEEE 2011;2011. 18. Pflug A, CB. Ear biometrics: a survey of detection, feature extraction and
recognition methods. IET biometrics2012. p. 114–29.
19. Abaza A, Ross A, Heber C, Harrison MAF, MSN. A survey of ear biometrics. In: Surv AC, editor.2013. p. 1–35.
20. Ragan EJ, Johnson C, Milton JN, Gill CJ. Ear biometrics for patient identification in global health: a cross-sectional study to test the feasibility of a simplified algorithm. BMC Res Notes 2016;9(1):484. Epub 2016/11/04.https://doi.org/10. 1186/s13104-016-2287-9. PubMed PMID: 27806727; PubMed Central PMCID: PMCPMC5094067.
21. Introduction to SIFT (scale-invariant feature transform) [April 2017]. Available from:http://opencv-python-tutroals.readthedocs.io/en/latest/py_tutorials/ py_feature2d/py_sift_intro/py_sift_intro.html.
22. Bargal S.A. WA, Chan C. R., Howes S., Sclaroff S., Ragan E., Johnson C., Gill C.J. Image-based ear biometric smarphone app for patient identification in field
settings. International Conference on Computer Visiion Theory and Application (VISAPP); Berlin, Germany2015.
23. Li D, Zhou H, Lam KM. High-resolution face verification using pore-scale facial features. IEEE Trans Image Process 2015;24(8):2317–2327. Epub 2015/03/18. https://doi.org/10.1109/TIP.2015.2412374. PubMed PMID: 25781876. 24. Burge S. The systems engineering toolbox 2018 [May 2018]. Available from:
https://www.burgehugheswalsh.co.uk/uploaded/1/documents/pugh-matrix-v1.1.pdf.
25. Niemitz C, Nibbrig M, Zacher V. Human ears grow throughout the entire lifetime according to complicated and sexually dimorphic patterns--conclusions from a cross-sectional analysis. Anthropol Anz 2007;65(4):391– 413. Epub 2008/01/17. PubMed PMID: 18196763.
26. Nellhaus G. Head circumference from birth to eighteen years. Practical composite international and interracial graphs. Pediatrics. 1968;41(1):106–14. Epub 1968/01/01. PubMed PMID: 5635472.
27. Brucker MJ, Patel J, Sullivan PK, Department of Plastic Surgery BMS, Rhode Island hospital PUSA. A morphometric study of the external ear: age- and sex-related differences. Plast Reconstr Surg 2003;112(2):647–52; discussion 53-4. Epub 2003/08/06.https://doi.org/10.1097/01.PRS.0000070979.20679.1F. PubMed PMID: 12900628.
28. Adventure series for CT [April 2018]. Available from:https://www. gehealthcare.com/products/accessories-and-supplies/adventure-series-for-ct.
Publisher’s Note