R E S E A R C H A R T I C L E
Open Access
Identifying patients at highest-risk: the best
timing to apply a readmission predictive
model
Natalie Flaks-Manov
1, Maxim Topaz
2, Moshe Hoshen
1, Ran D. Balicer
1,3and Efrat Shadmi
1,2*Abstract
Background:Most of readmission prediction models are implemented at the time of patient discharge. However,
interventions which include an early in-hospital component are critical in reducing readmissions and improving patient outcomes. Thus, at-discharge high-risk identification may be too late for effective intervention. Nonetheless, the tradeoff between early versus at-discharge prediction and the optimal timing of the risk prediction model application remains to be determined. We examined a high-risk patient selection process with readmission prediction models using data available at two time points: at admission and at the time of hospital discharge. Methods:An historical prospective study of hospitalized adults (≥65 years) discharged alive from internal medicine units in Clalit’s (the largest integrated payer-provider health fund in Israel) general hospitals in 2015. The outcome was all-cause 30-day emergency readmissions to any internal medicine ward at any hospital. We used the previously validated Preadmission Readmission Detection Model (PREADM) and developed a new model incorporating PREADM with hospital data (PREADM-H). We compared the percentage of overlap between the models and calculated the positive predictive value (PPV) for the subgroups identified by each model separately and by both models.
Results:The final cohort included 35,156 index hospital admissions. The PREADM-H model included 17 variables with a C-statistic of 0.68 (95% CI: 0.67–0.70) and PPV of 43.0% in the highest-risk categories. Of patients categorized by the PREADM-H in the highest-risk decile, 78% were classified similarly by the PREADM. The 22% (n= 229) classified by the PREADM-H at the highest decile, but not by the PREADM, had a PPV of 37%. Conversely, those classified by the PREADM into the highest decile but not by the PREADM-H (n= 218) had a PPV of 31%.
Conclusions:The timing of readmission risk prediction makes a difference in terms of the population identified at each prediction time point–at-admission or at-discharge. Our findings suggest that readmission risk identification should incorporate a two time-point approach in which preadmission data is used to identify high-risk patients as early as possible during the index admission and an“all-hospital”model is applied at discharge to identify those that incur risk during the hospital stay.
Keywords:Timing of readmission predictive model, All-cause readmission, Electronic medical records
Background
Interventions that are aimed at the prevention of hospital readmissions are increasingly guided by computerized risk prediction models, which identify high-risk patients [1]. To date, most readmission prediction models are imple-mented upon patient discharge [2]. A growing body of evi-dence, however, indicates that interventions that include
an early in-hospital component, such as comprehensive discharge planning [3], are key to reducing readmissions, thus, highlighting the need for early, within hospitalization high-risk prediction.
Early high-risk patient identification is becoming in-creasingly possible. With the advent of electronic health records (EHRs) [4], detailed data on key risk factors, including clinical and healthcare utilization, are also avail-able from the preadmission period [5]. Previously, we showed that such a pre-admission prediction model (the Preadmission Readmission Detection Model [PREADM])
© The Author(s). 2019Open AccessThis article is distributed under the terms of the Creative Commons Attribution 4.0 International License (http://creativecommons.org/licenses/by/4.0/), which permits unrestricted use, distribution, and reproduction in any medium, provided you give appropriate credit to the original author(s) and the source, provide a link to the Creative Commons license, and indicate if changes were made. The Creative Commons Public Domain Dedication waiver (http://creativecommons.org/publicdomain/zero/1.0/) applies to the data made available in this article, unless otherwise stated.
* Correspondence:[email protected]
1Clalit Research Institute, Clalit Health Services, Shoham 2, Ramat Gan, Israel 2Cheryl Spencer Department of Nursing, Faculty of Social Welfare and Health
Sciences, University of Haifa, 31905 Haifa, Israel
provides accurate high-risk assessment [6]. Similarly, a multi-condition electronic model, based on data available at admission, showed that meaningful patient-level risk stratification of readmission risk can occur early in the hospital stay without the need to wait for further informa-tion at time of discharge [7]. A recent review has demon-strated that preadmission prediction models performed comparably well to the at-discharge models [2].
Whether identification of patients at high-risk for re-admission should be performed at the beginning or at the end of the index hospitalization is not only a ques-tion of predictive accuracy, it also depends on the types of readmission prevention interventions to which high-risk patients are referred. Thus, in-hospital interventions can benefit from early high-risk identification of targeted patients, and programs targeting the post-hospitalization phase, should rely on risk prediction at the time of discharge. Thus, the trade-off between early versus at-discharge prediction and the optimal timing of high-risk case identification remains to be determined. To address this gap, the aim of this study was to examine a high-risk patient selection with readmission prediction models using data available at two time points: (1) at admission and (2) at the time of hospital discharge.
Methods
Study design and setting
We conducted a historical prospective cohort study of adult members from Clalit Health Services (Clalit), the lar-gest of four integrated payer-provider health funds, which covers over 52% of the Israeli population (more than 4.2 million patients). Clalit’s data warehouse includes clinical information, administrative data on patient demographics and healthcare service utilization, community clinic infor-mation (preventive care, risk factors, primary care and specialist visits), hospital records, and laboratory and pharmacy data (prescribing and dispensing).
Study population
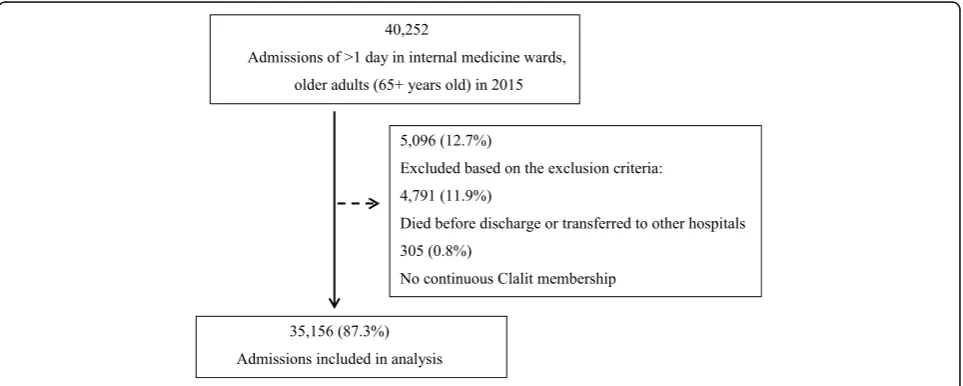
Our cohort included all hospitalized older adults (≥65 years) discharged alive from internal medicine units in one of Clalit’s eight general hospitals in 2015 (1/1/2015 to 31/12/2015). We excluded individuals who died dur-ing the index hospitalization, were transferred to another facility, or did not have continuous membership in Clalit 1 year before the index hospitalization and 30 days after (less than 1% of the Clalit membership). Hospitalizations with lengths of stay (LOS) of less than one night were also excluded to avoid including observation stays. All datasets were made anonymous, in keeping with the standard operating procedures of Clalit’s Data Extraction Committee. The study was approved by Clalit’s institu-tional review board.
Study outcome
The outcome of interest was all-cause 30-day emergency (unplanned) readmissions to any internal medicine ward at any hospital in Israel.
Study predictors
To compare the preadmission with at-discharge predic-tion models, we used the previously validated PREADM model and developed a new model incorporating PRE-ADM [6] with hospital data (PREADM-H). For the at-discharge model we used combined preadmission and within-hospitalization data, as this approach has previ-ously shown the highest prediction accuracy [8].
The PREADM allows early identification of high-risk patients upon hospital admission to an internal medicine unit [6]. The PREADM has been in use in Clalit since 2012 to direct the readmission prevention strategy for high-risk patients on the second day of admission to any hospital throughout Israel, and in primary care interven-tions aimed at counseling high-risk patients upon discharge from the hospital. The model includes: six chronic condi-tions (congestive heart failure, chronic obstructive pulmon-ary disease, chronic renal failure, malignancy, arrhythmia, and disability), number of primary care and specialist visits, number of days since last hospitalization, number of hos-pital admissions in the past year, body mass index, and an indicator for the hospital’s catchment area.
Data from the index admission period were based on variables from the widely used and well-validated HOSPITAL model [9]. The HOSPITAL model was pre-viously incorporated into an admission model showing good discriminatory power (C-statistic of 0.72 in the United States and Canadian hospitals and 0.68 in Swiss hospitals) [10].
The risk factors included the above 11 variables from the PREADM and six unique predictor variables (not including the number of previous hospitalizations, as it already ap-pears in the PREADM) from the HOSPITAL model, including last available hemoglobin before discharge, dis-charge from oncology treatment, last available sodium level before discharge, any procedure performed during the index admission, type of index admission, and LOS.
Data analysis
positives and false negatives at all possible thresholds. Model calibration was assessed by comparing predicted with observed probabilities of readmission by top decile and quintile of risk. For each model (PREADM and PREADM-H), we calculated the positive predictive value (PPV) for the 10 and 20% highest risk categories.
We then compared the percentage of overlap between the models for each of the 10 and 20% cut-points (i.e., the percentage of patients identified as being in the same high-risk category by each model separately and by both models) and calculated the PPV for the subgroups iden-tified by each model separately and by both models. We conducted all analyses using R version 3.2.2.
Results
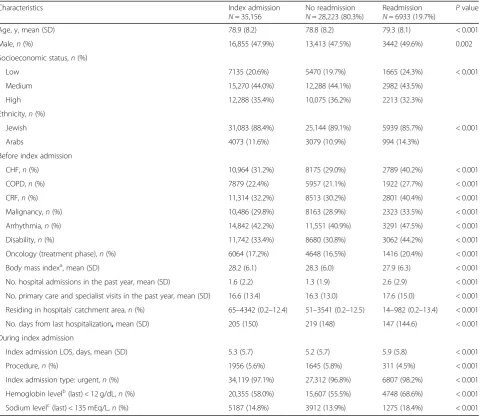
The final cohort included 35,156 index hospital admis-sions (24,510 unique inpatients) after we excluded 5096 patient’s admissions who died before discharge or did not have a continuous membership in Clalit. The flow-chart for selection of the study's population appears in Fig. 1. The study population was 47.9% male, 78.9 years of age on average, and predominantly Jewish (88.4%). The mean index hospital admission lasted 5.3 days, and 6933 (19.7%) index admissions resulted in 30-day re-admission (Table 1). Patients who were readmitted dif-fered from non-readmitted patients in terms of their demographic, clinical and prior health service use characteristics.
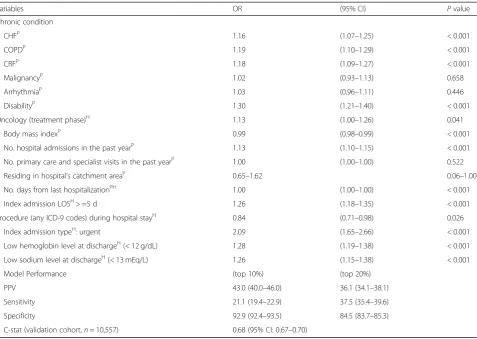
Model derivation was performed on 24,599 admissions and tested on 10,557 admissions. Our final model in-cluded 17 variables; the 11 PREADM model variables, and six from the HOSPITAL model. In the validation cohort, the PREADM-H model had fair discrimination,
with a C-statistic of 0.68 (95% CI: 0.67–0.70). The PPV of the PREADM-H model in the highest risk categories (top 10 and 20%) was 43.0 and 36.1%, respectively and sensitivity and specificity in top 10% was 21.1 and 92.9% respectively (Table2).
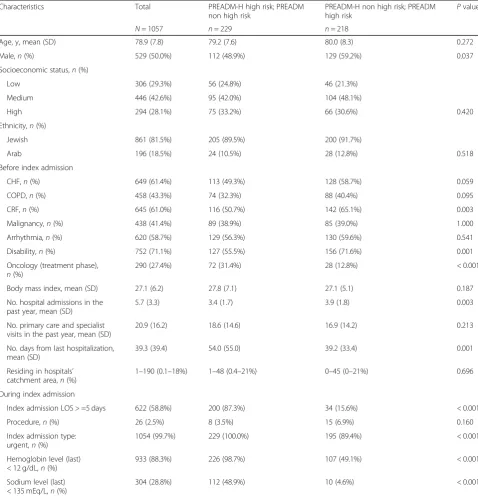
Figure 2 shows that 78% of those categorized by the PREADM-H at the highest decile of risk (with a PPV of 45%) were classified similarly by the PREADM model. The remaining 22% who were classified by the PREADM-H highest decile, but not by the PREADM, had a PPV of 37%. Conversely, those classified by the PREADM into the highest decile but not by the PREADM-H (n= 218) had a PPV of 31%. A similar picture emerged when examining the differences in populations identified as the 20% highest risk group. In the highest quintile, 82% of those catego-rized by the PREADM-H (with a PPV of 38%) were also categorized at the highest quintile by the PREADM. The PPV for the remaining 18% who were not identified by the PREADM at the highest quantile was 29%. Thus, applying the PREADM at baseline and PREADM-H at-discharge allowed for accurate detection of an additional 85 subse-quently readmitted patients (37% of 229 patients), with a cutoff point for the 10% highest risk group, and 110 pa-tients (31% of 359 papa-tients), using a cutoff point for the 20% highest risk group, who would have other-wise been missed. A detailed account of percent of pa-tients detected at high-risk for 30-day readmission at-admission (PREADM) vs. at-discharge (PREADM-H) ap-pears in Fig.3.
The characteristics of the two non-overlapping popu-lations appear in Table3. Patients with a high-risk PRE-ADM score who were not identified as high-risk according to the PREDM-H model had more disability (71.6% vs. 55.5%, p value = 0.001), more chronic renal
failure (65.1% vs. 50.7%, p value = 0.003), more hospital admissions in the past year (3.9 vs. 3.4, p value = 0.003) and less days from the previous hospitalization (39.2 vs. 54.0, p value = 0.001). Patients who were identified as non-high-risk by the PREADM model but were identi-fied as high-risk by the PREADM-H model have longer LOS (87.3% vs. 15.6% with a LOS of at least 5 days, p value< 0.001), a larger percent were in an oncology treatment phase (31.4% vs. 12.8%, p value< 0.001), all had an urgent index admission (100% vs. 89.4%, p value< 0.001), almost all had a low hemoglobin level (98.7% vs. 49.1%, p value< 0.001) and about half had low sodium levels (48.9% vs. 4.6%, pvalue< 0.001).
Discussion
Our results show that the timing of hospital readmission risk prediction both at admission and discharge should be considered when making the decision regarding which population should and can be identified for inclu-sion in readmisinclu-sion prevention programs. Use of the PREADM model allowed for early identification of high-risk patients, yet missed a portion (18–22%, depending on whether a 10% or 20% highest risk cut-off was used) whose readmission risk was almost as high. Alternatively, the PREADM-H enabled accounting for risk factors that accrued during the hospital stay, though missed some pa-tients who had an a priori high-risk according to the Table 1Baseline cohort characteristics of 35,156 index admissions
Characteristics Index admission
N= 35,156
No readmission
N= 28,223 (80.3%)
Readmission
N= 6933 (19.7%) P value
Age, y, mean (SD) 78.9 (8.2) 78.8 (8.2) 79.3 (8.1) < 0.001
Male,n(%) 16,855 (47.9%) 13,413 (47.5%) 3442 (49.6%) 0.002
Socioeconomic status,n(%)
Low 7135 (20.6%) 5470 (19.7%) 1665 (24.3%) < 0.001
Medium 15,270 (44.0%) 12,288 (44.1%) 2982 (43.5%)
High 12,288 (35.4%) 10,075 (36.2%) 2213 (32.3%)
Ethnicity,n(%)
Jewish 31,083 (88.4%) 25,144 (89.1%) 5939 (85.7%) < 0.001
Arabs 4073 (11.6%) 3079 (10.9%) 994 (14.3%)
Before index admission
CHF,n(%) 10,964 (31.2%) 8175 (29.0%) 2789 (40.2%) < 0.001
COPD,n(%) 7879 (22.4%) 5957 (21.1%) 1922 (27.7%) < 0.001
CRF,n(%) 11,314 (32.2%) 8513 (30.2%) 2801 (40.4%) < 0.001
Malignancy,n(%) 10,486 (29.8%) 8163 (28.9%) 2323 (33.5%) < 0.001
Arrhythmia,n(%) 14,842 (42.2%) 11,551 (40.9%) 3291 (47.5%) < 0.001
Disability,n(%) 11,742 (33.4%) 8680 (30.8%) 3062 (44.2%) < 0.001
Oncology (treatment phase),n(%) 6064 (17.2%) 4648 (16.5%) 1416 (20.4%) < 0.001
Body mass indexa, mean (SD) 28.2 (6.1) 28.3 (6.0) 27.9 (6.3) < 0.001
No. hospital admissions in the past year, mean (SD) 1.6 (2.2) 1.3 (1.9) 2.6 (2.9) < 0.001
No. primary care and specialist visits in the past year, mean (SD) 16.6 (13.4) 16.3 (13.0) 17.6 (15.0) < 0.001
Residing in hospitals’catchment area,n(%) 65–4342 (0.2–12.4) 51–3541 (0.2–12.5) 14–982 (0.2–13.4) < 0.001
No. days from last hospitalization,mean (SD) 205 (150) 219 (148) 147 (144.6) < 0.001
During index admission
Index admission LOS, days, mean (SD) 5.3 (5.7) 5.2 (5.7) 5.9 (5.8) < 0.001
Procedure,n(%) 1956 (5.6%) 1645 (5.8%) 311 (4.5%) < 0.001
Index admission type: urgent,n(%) 34,119 (97.1%) 27,312 (96.8%) 6807 (98.2%) < 0.001
Hemoglobin levelb(last) < 12 g/dL,n(%) 20,355 (58.0%) 15,607 (55.5%) 4748 (68.6%) < 0.001
Sodium levelc(last) < 135 mEq/L,n(%) 5187 (14.8%) 3912 (13.9%) 1275 (18.4%) < 0.001
Abbreviations:yyears,SDStandard deviation,CHFCongestive heart failure,COPDChronic obstructive pulmonary disease,CRFChronic renal failure,NoNumber, LOSLength of stay,Procedureany ICD-9 coded procedure, such cardiac catheterization, or diagnostic radiology
a
Missing values contributed to 0.8%
b
Missing values contributed to 0.3%
c
Highest 10% (N=1,057) Highest 20% (N=2,134)
Abbreviations: PREADM: Preadmission Readmission Detection Model; PREADM-H: Preadmission Readmission Detection Model + Hospital model; PPV: positive predictive value
Fig. 2Model Performance for Different Cutoff Points of the PREADM-H vs. PREADM model
Table 2Prediction of 30-day readmission based on PREADM-H model variables (Derivation cohort,N= 24,599)
Variables OR (95% CI) Pvalue
Chronic condition
CHFP 1.16 (1.07–1.25) < 0.001
COPDP 1.19 (1.10–1.29) < 0.001
CRFP 1.18 (1.09–1.27) < 0.001
MalignancyP 1.02 (0.93–1.13) 0.658
ArrhythmiaP 1.03 (0.96–1.11) 0.446
DisabilityP 1.30 (1.21–1.40) < 0.001
Oncology (treatment phase)H 1.13 (1.00–1.26) 0.041
Body mass indexP 0.99 (0.98–0.99) < 0.001
No. hospital admissions in the past yearP 1.13 (1.10–1.15) < 0.001
No. primary care and specialist visits in the past yearP 1.00 (1.00–1.00) 0.522
Residing in hospital’s catchment areaP 0.65–1.62 0.06–1.00
No. days from last hospitalizationPH 1.00 (1.00–1.00) < 0.001
Index admission LOSH> =5 d 1.26 (1.18–1.35) < 0.001
Procedure (any ICD-9 codes) during hospital stayH 0.84 (0.71–0.98) 0.026
Index admission typeH: urgent 2.09 (1.65–2.66) < 0.001
Low hemoglobin level at dischargeH(< 12 g/dL) 1.28 (1.19–1.38) < 0.001
Low sodium level at dischargeH(< 13 mEq/L) 1.26 (1.15–1.38) < 0.001
Model Performance (top 10%) (top 20%)
PPV 43.0 (40.0–46.0) 36.1 (34.1–38.1)
Sensitivity 21.1 (19.4–22.9) 37.5 (35.4–39.6)
Specificity 92.9 (92.4–93.5) 84.5 (83.7–85.3)
C-stat (validation cohort,n= 10,557) 0.68 (95% CI: 0.67–0.70)
Abbreviations OROdds ratio,CIConfidence interval,CHFCongestive heart failure,COPDChronic obstructive pulmonary disease,CRFChronic renal failure,LOS Length of stay,C-statModel’s discrimination and calibration,PPVPositive predictive value
P: variables from PREADM model H: variables from HOSPITAL model PH: variables from PREADM-H model
PREADM and whose actual re-hospitalization rate was much higher than the general population (31% readmission rate). Also, as expected, the clinical characteristics of the population that was identified as high-risk by the PREADM-H model was different than those who were identified by the PREADM model (especially as to the within hospital risk-factors). Malignancy, arrhythmia, and number of primary care and specialist visits in the past year were statistically significantly associated with readmission in the univariate analysis (Table 1), and in PREADM model [6]. Yet, when included in a model with variables from the admission period (PREADM-H) they are no longer statistically significant. This is prob-ably due to the inclusion of the LOS variable, which possibly also indirectly captures the complexity and se-verity of the patient’s overall condition. This is similar to at least part of the contribution of the above stated variables, which may explain why they were no longer statistically significantly associated with the readmis-sion outcome. Taken together, our findings suggest that readmission risk identification should incorporate a two-time-point approach in which preadmission data are used to identify high-risk patients as early as pos-sible during the index admission (with a PREADM type of algorithm) and an at-discharge “all-hospital” model (such as the PREADM-H model), which is applied to identify those who incur risk during the hospital stay.
A two-time-point risk identification approach is also compatible with evidence that reports on the effect-iveness of readmission prevention interventions. Sys-tematic reviews [3, 12, 13] have repeatedly shown that no intervention implemented alone is associated with reduced risk for 30-day readmissions. Rather, in-terventions including components that are
imple-mented before and after discharge, such as
transitional nurse visits and discharge follow-up ap-pointments, achieve the greatest reduction in hospital readmissions [14–17].
While the PREADM model, already in use in Clalit for early identification of high-risk patients and guiding physi-cians and nurses in prioritizing patients for inclusion in early readmission preventive programs that are tailored to meet their ongoing care needs (e.g., discharge planning or referral to a transitional nurse care). This study shows that there is value in the PREADM-H model being incorpo-rated into practice to inform interventions implemented at the point of discharge, as well as communicated to the primary or ambulatory care teams to allow for selection of patients for inclusion in post-discharge targeted interven-tions. Our results provide an example of the potential complementary implementation of the predictive models to maximize their power in identifying various groups of high-risk patients for inclusion in within as well as post-discharge interventions.
This study’s findings add to the recent literature that ad-dresses the need for new modeling approaches that pro-vide innovative, actionable insights for risk stratification to improve the ability to prevent hospital readmissions [18]. An example of such an approach is multi-hypotheses causal analysis, which generates meaningful insights from health care claims data, guiding the design of care and intervention programs by developing more personalized interventions based on readmission risk associated with specific comorbidities [18] or improved understanding of causes of asthma-related readmission [19]. This is similar to our approach which identifies various groups of high-risk patients for inclusion in interventions by checking the patient’s risk at different time points throughout the hospitalization, rather than providing broad-scope inter-ventions for all individuals.
Another consideration in the applicability of risk-prediction models relates to the compatibility between the type of analytical approach used for the development of the model and the purpose of the use of the model. For example, a model developed for risk adjustment pur-poses to allow for fair comparisons amongst hospitals’ readmission rates should be developed retrospectively, for which timely data availability does not play a factor [20]. Yet, a predictive model that evaluates patients at-risk for deciding on inclusion in preventive interventions requires the inclusion of data available in real-time from an EHR [21].
Limitations
Although the patient sample was taken from a large in-tegrated health fund, and the types of data used are simi-lar to those used by other healthcare systems, our results may not be generalizable to other settings where clinic and hospital data are not linked. Specifically, the type of data available at Clalit’s EHR data warehouse may not be available elsewhere. However, with the growing use of EHRs [4], the data included in the final PREADM-H may be increasingly available to many healthcare organizations.
to readmission risk detection. Future studies that may be able to improve model accuracy, should, in addition to model performance take into consideration applicability of models, as tested and reported here.
Another limitation is that our model did not include predictors of readmission that are included in other at-discharge models (e.g., indications of complications, pathology reports, or lab values) [22]. Nonetheless, we
used variables from the widely used and validated HOS-PITAL model with an aim to increase generalizability and applicability to other healthcare systems. Finally, al-though our results show that the PREADM-H can be applied at two points, immediately at admission and discharge, this process depends on each hospital’s abil-ity and willingness to operate identification and inter-vention schemes.
Table 3Characteristics of the highest risk groups (top 10%), according to each model separately (PREADM-H vs. PREADM)
Characteristics Total PREADM-H high risk; PREADM
non high risk
PREADM-H non high risk; PREADM
high risk P
value
N= 1057 n= 229 n= 218
Age, y, mean (SD) 78.9 (7.8) 79.2 (7.6) 80.0 (8.3) 0.272
Male,n(%) 529 (50.0%) 112 (48.9%) 129 (59.2%) 0.037
Socioeconomic status,n(%)
Low 306 (29.3%) 56 (24.8%) 46 (21.3%)
Medium 446 (42.6%) 95 (42.0%) 104 (48.1%)
High 294 (28.1%) 75 (33.2%) 66 (30.6%) 0.420
Ethnicity,n(%)
Jewish 861 (81.5%) 205 (89.5%) 200 (91.7%)
Arab 196 (18.5%) 24 (10.5%) 28 (12.8%) 0.518
Before index admission
CHF,n(%) 649 (61.4%) 113 (49.3%) 128 (58.7%) 0.059
COPD,n(%) 458 (43.3%) 74 (32.3%) 88 (40.4%) 0.095
CRF,n(%) 645 (61.0%) 116 (50.7%) 142 (65.1%) 0.003
Malignancy,n(%) 438 (41.4%) 89 (38.9%) 85 (39.0%) 1.000
Arrhythmia,n(%) 620 (58.7%) 129 (56.3%) 130 (59.6%) 0.541
Disability,n(%) 752 (71.1%) 127 (55.5%) 156 (71.6%) 0.001
Oncology (treatment phase),
n(%)
290 (27.4%) 72 (31.4%) 28 (12.8%) < 0.001
Body mass index, mean (SD) 27.1 (6.2) 27.8 (7.1) 27.1 (5.1) 0.187
No. hospital admissions in the past year, mean (SD)
5.7 (3.3) 3.4 (1.7) 3.9 (1.8) 0.003
No. primary care and specialist visits in the past year, mean (SD)
20.9 (16.2) 18.6 (14.6) 16.9 (14.2) 0.213
No. days from last hospitalization, mean (SD)
39.3 (39.4) 54.0 (55.0) 39.2 (33.4) 0.001
Residing in hospitals’ catchment area,n(%)
1–190 (0.1–18%) 1–48 (0.4–21%) 0–45 (0–21%) 0.696
During index admission
Index admission LOS > =5 days 622 (58.8%) 200 (87.3%) 34 (15.6%) < 0.001
Procedure,n(%) 26 (2.5%) 8 (3.5%) 15 (6.9%) 0.160
Index admission type: urgent,n(%)
1054 (99.7%) 229 (100.0%) 195 (89.4%) < 0.001
Hemoglobin level (last) < 12 g/dL,n(%)
933 (88.3%) 226 (98.7%) 107 (49.1%) < 0.001
Sodium level (last) < 135 mEq/L,n(%)
304 (28.8%) 112 (48.9%) 10 (4.6%) < 0.001
Conclusions
The timing of readmission risk prediction makes a dif-ference in terms of the population identified at each pre-diction time point - at admission or discharge. As our model performance data shows, early risk identification (by the PREADM) allowed for accurate detection of patients who were highly likely to be readmitted (actual readmission rate of 31%) but were no longer detected at the highest-risk decile when at-discharge identification was applied (by the PREADM-H). Similarly, application of only early at-admission high-risk detection (PRE-ADM) can miss patients with as high as about 37% like-lihood for readmission who are newly identified
at-discharge (PREADM-H). Thus, implementing
at-admission models allows early identification and inter-vention but misses a portion of patients who are at high-risk of readmission due to factors accrued during the hospitalization period. Conversely, an at-discharge pre-diction model not only misses the opportunity for early intervention, but also fails to account for patients at high-risk for readmission who can be identified early in their hospital stay. To account for patient risk as well as the opportunity to intervene in order to address this risk, we recommend a combined and complementary approach of applying readmission risk detection at two-time-points, both at-admission and at-discharge.
Abbreviations
EHR:Electronic health records; LOS: Lengths of stay; PREADM: Preadmission Readmission Detection Model; PREADM-H: Preadmission Readmission Detection Model with hospital data
Acknowledgements
The authors would like to thank Sydney Krispin (Clalit Research Institute, Israel) for her assistance in editing and reviewing the manuscript.
Authors’contributions
FMN had full access to all the data in the study and take responsibility for the integrity of the data and the accuracy of the data analysis. Author contributions were as follows: 1) conception and design (FMN, SE, TM); 2) extraction and statistical analysis of data (FMN); 3) interpretation of data (FMN, SE, TM, HM); 4) drafting of the manuscript (FMN, SE, TM); 5) critical revision of the manuscript for important intellectual content (SE, TM, BR); All authors read and approved the final manuscript.
Funding No funding.
Availability of data and materials
The datasets analyzed during the current study are not publicly available due to public availability would compromise patient confidentiality. The data restrictions are imposed by the Clalit Health Services Data Utilization Committee and the Clalit Health Services Internal Review board in order to protect patient confidentiality. But the anonymous datasets are available from the corresponding author on reasonable request.
Ethics approval and consent to participate
The study was approved by Clalit’s institutional review board.
Consent for publication Not applicable.
Competing interests
The authors declare that they have no competing interests.
Author details
1Clalit Research Institute, Clalit Health Services, Shoham 2, Ramat Gan, Israel. 2
Cheryl Spencer Department of Nursing, Faculty of Social Welfare and Health Sciences, University of Haifa, 31905 Haifa, Israel.3Department of
Epidemiology, Faculty of Health Sciences, Ben-Gurion University of the Negev, Beer-Sheva, Israel.
Received: 13 September 2018 Accepted: 6 June 2019
References
1. Kansagara D, Englander H, Salanitro A, et al. Risk prediction models for hospital readmission: a systematic review. Jama. 2011;306(15):1688–98. 2. Zhou H, Della PR, Roberts P, et al. Utility of models to predict 28-day or
30-day unplanned hospital readmissions: an updated systematic review. BMJ Open. 2016;6(6):e011060.
3. Hansen LO, Young RS, Hinami K, et al. Interventions to reduce 30-day rehospitalization: a systematic review. Ann Intern Med. 2011;155(8):520–8. 4. Goldstein BA, Navar AM, Pencina MJ, et al. Opportunities and challenges in
developing risk prediction models with electronic health records data: a systematic review. J Am Med Inform Assoc. 2017;24(1):198–208.
5. Vest JR, Kern LM, Silver MD, et al. The potential for community-based health information exchange systems to reduce hospital readmissions. J Am Med Inform Assoc. 2015;22(2):435–42.
6. Shadmi E, Flaks-Manov N, Hoshen M, et al. Predicting 30-day readmissions with preadmission electronic health record data. Med Care. 2015;53(3):283–9.
7. Amarasingham R, Velasco F, Xie B, et al. Electronic medical record-based multicondition models to predict the risk of 30 day readmission or death among adult medicine patients: validation and comparison to existing models. BMC Med Inform Decis Mak. 2015;15:39.
8. Nguyen OK, Makam AN, Clark C, et al. Predicting all-cause readmissions using electronic health record data from the entire hospitalization: model development and comparison. J Hosp Med. 2016;11(7):473–80.
9. Donze J, Aujesky D, Williams D, et al. Potentially avoidable 30-day hospital readmissions in medical patients: derivation and validation of a prediction model. JAMA Intern Med. 2013;173(8):632–8.
10. Donze JD, Williams MV, Robinson EJ, et al. International validity of the HOSPITAL score to predict 30-day potentially avoidable hospital readmissions. JAMA Intern Med. 2016;176(4):496–502.
11. Hanley JA, Negassa A, Edwardes MD, et al. Statistical analysis of correlated data using generalized estimating equations: an orientation. Am J Epidemiol. 2003;157(4):364–75.
12. Rennke S, Nguyen OK, Shoeb MH, et al. Hospital-initiated transitional care interventions as a patient safety strategy: a systematic review. Ann Intern Med. 2013;158(5 Pt 2):433–40.
13. Jayakody A, Bryant J, Carey M, et al. Effectiveness of interventions utilising telephone follow up in reducing hospital readmission within 30 days for individuals with chronic disease: a systematic review. BMC Health Serv Res. 2016;16(1):403.
14. Coleman EA, Smith JD, Frank JC, et al. Preparing patients and caregivers to participate in care delivered across settings: the care transitions intervention. J Am Geriatr Soc. 2004;52(11):1817–25.
15. Coleman EA, Parry C, Chalmers S, et al. The care transitions intervention: results of a randomized controlled trial. Arch Intern Med. 2006;166(17):1822–8. 16. Jack BW, Chetty VK, Anthony D, et al. A reengineered hospital discharge
program to decrease rehospitalization: a randomized trial. Ann Intern Med. 2009;150(3):178–87.
17. Naylor M, Brooten D, Jones R, et al. Comprehensive discharge planning for the hospitalized elderly. A randomized clinical trial. Ann Intern Med. 1994; 120(12):999–1006.
18. Casucci S, Lin L, Hewner S, et al. Estimating the causal effects of chronic disease combinations on 30-day hospital readmissions based on observational Medicaid data. J Am Med Inform Assoc. 2017;25(6):670–8. 19. Beck AF, Huang B, Auger KA, et al. Explaining racial disparities in child
asthma readmission using a causal inference approach. JAMA Pediatr. 2016; 170(7):695–703.
20. Preyde M, Brassard K. Evidence-based risk factors for adverse health outcomes in older patients after discharge home and assessment tools: a systematic review. J Evid Based Soc Work. 2011;8:445–68.
21. Escobar GJ, Ragins A, Scheirer P, et al. Nonelective rehospitalizations and postdischarge mortality: predictive models suitable for use in real time. Med Care. 2015;53(11):916.
22. Cai X, Perez-Concha O, Coiera E, et al. Real-time prediction of mortality, readmission, and length of stay using electronic health record data. J Am Med Inform Assoc. 2016;23(3):553–61.
Publisher’s Note