Convergence In State And Local Spending
On Education: Are Lotteries Ear Marked
For Education The Key?
Rex J. Pjesky, West Texas A&M University, USAABSTRACT
Using Barro regression analysis, this paper finds evidence that per capita state spending on education converged from 1977 to 2006 across the U.S. states. Convergence was conditional on a state’s passage of a lottery for education during that time period. Despite evidence that the convergence of state education spending was conditional on the passage of an education lottery, the relative increase in education spending among many states that passed education lotteries was much greater than the revenue from the lotteries themselves. So, education lotteries seemed to be part of a larger bundle of policies in low spending states to increase education funding.
Of all the functions of state and local government, education is both the largest and the most important. In 2006, state and local government direct expenditures were $2.12 trillion dollars. Direct expenditures on education were $728 billion, just over one-third of the total spending. No other single category of spending in state and local government finance rivals education in the number of dollars spent.
There is clear competition among states over education funding. Legislatures and advocacy groups in states lagging behind their neighbors often will cite this fact as a reason to increase education spending. A popular choice among states recently has been to initiate a state lottery with the proceeds earmarked for education. From 1977 to 2006, sixteen states either started lotteries, which dedicated net proceeds exclusively for education, or redefined their existing lottery to earmark net proceeds to education. In every case, the lottery was hailed as a resounding success, but have these sixteen states that passed lotteries for education recently seen a relative increase in funding verses the other states? This paper addresses that question.
Keywords: Conditional Convergence; Education Spending; Lottery; Earmarked Funds
BACKGROUND AND MOTIVATION
here is much literature on the impact lotteries have on education funding. Many studies have concluded that lotteries with funds dedicated to education do not result in increased spending for education. The common explanation for this is that any money arriving in a public coffer becomes fungible. Money from lotteries can be allocated to education, but then legislators can allocate money, that otherwise would have been assigned to education, to other priorities. Many think lottery funds for education seem to be particularly fungible since the total amount spent on education is a relatively large amount of the budget compared to the relatively small amount which trickles into the state from the lottery (French and Stanley, 2002; Mikesell and Zorn, 1988; and Spindler, 1995).
Furthermore, at least one study found evidence that spending for education in states that pass lotteries with funds earmarked for education actually experienced a decrease in spending for education once lottery funds started to flow into the state’s budget (Miller and Pierce, 1997).
Some studies, however, disagree. Evans and Zang (2007) found that 50 to 70 cents of every dollar of net revenue from a state’s lottery went to education if that state earmarked lottery proceeds for education. Novarro (2005) found that a dollar from a dedicated education lottery increased education spending by 79 cents and a dollar from a “non-education lottery” increased funding for education by 43 cents. The studies by Evans and Zang and Novarro used panel data techniques that might be better able to disentangle the sophisticated relationships existing among revenue sources and spending items.
This paper will build on the previous literature and explore the relationship between lotteries and education finance. The specific question of this paper addresses convergence in state education spending – “Is per capita spending on education across the states converging and, if so, is that convergence conditional on the state passing a lottery with funds dedicated for education?”
It is commonly thought that higher spending on education translates into better educational outcomes. Funding for education is perhaps the primary issue for state lawmakers. In 2000, there were 442 funding bills passed at the state level in the United States, and evidence suggests that 2000 was a relatively quiet year (Crampton, 2007). Given the political support, it is not surprising that funding for education has increased dramatically in the United States. Per pupil spending on elementary and secondary school increased from an inflation adjusted $4,303 in the 1974-75 school year to $7,628 in the 2000-2001 school year - a 77% increase (Grubb, Huerta, and Goe, 2006).
In the successful, rigorous effort to increase school funding, it should not be surprising to discover that states that lag in funding try to catch up to states that place more effort in educational funding. States that lag in funding face the considerable risk that the future vitality of their economies will suffer from the lack of a skilled workforce. The link between education funding and educational outcomes is tenuous at best, as researchers who have carefully studied the question have discovered that the connection among funding and learning outcomes and educational resources and outcomes is elusive (Grubb, Huerta, and Goe, 2006).
Despite the uncertain relationship between educational outcomes and funding for education, many education advocates insist that a relationship exists. The National Education Association (NEA) warns that the needs of the current economy require schools to teach pupils a much higher skill set, and teaching a higher skill set will certainly require more resources (Jefferson, 2005). The sentiment behind the NEA position has led them, and many other advocacy groups, to lobby for more resources for education in their communities and states.
Since the effort to increase education funding seems to be going on in the United States, in general, states beginning at a lower level must experience higher levels of growth to catch up with their neighbors. Running to stand still is not enough for the states with low education spending.
Because increased funding comes at an opportunity cost, either by reduced expenditures in other budget areas or by increasing taxes, even states with strong lobbies to increase education funding will reach a point where resistance from taxpayers or other interest groups is strong enough to stop or slow further increases. This is where educational advocates must get creative and design policies to reduce resistance. It is likely that an educational lottery would be a good candidate to be the centerpiece of that bundle of policies.
DATA
An educational lottery might be attractive because it is seen by many as a voluntary tax. If a low education expenditure state was “running to stand still” with higher spending neighbors and was unable to accelerate tax increases or budget substitutions to further hasten increases in its education budget, a new lottery might do the trick.
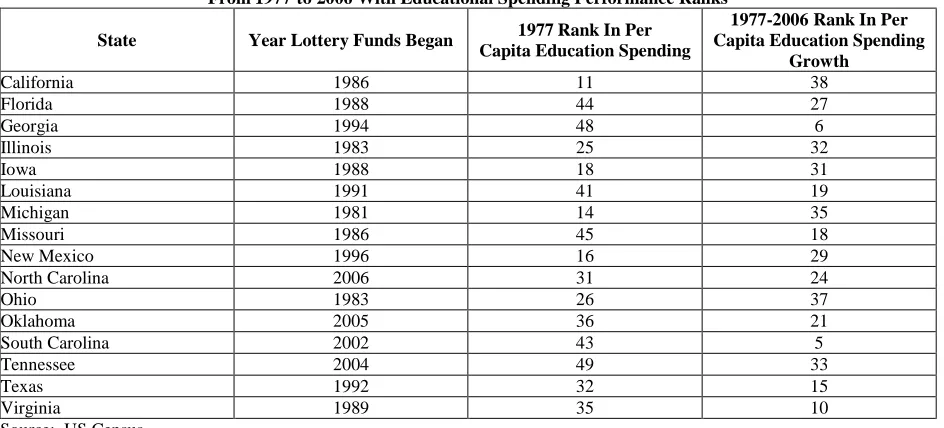
Between 1977 and 2006, sixteen states began a lottery with funds earmarked for education or rededicated their existing lottery’s windfalls to education from some other purpose. Table 1 lists these states along with the year the lottery funds began accruing to education, the 1977 rank among states in per capita education spending, and the rank at which education spending grew from 1977-2006. The results are interesting. In general, these sixteen states funded education at a low level (the average rank was 32); only four of the sixteen were in the top half of states - California, Iowa, Michigan, and New Mexico. Ten of the states (California, Illinois, Iowa, Michigan, Ohio, and New Mexico were the exceptions) had a rank in growth higher than their rank of initial spending. The average growth rank of the 16 states was 24.
Table 1: States That Passed Education Lotteries (Or Dedicated The Funds From An Existing Lottery To Education) From 1977 to 2006 With Educational Spending Performance Ranks
State Year Lottery Funds Began 1977 Rank In Per
Capita Education Spending
1977-2006 Rank In Per Capita Education Spending
Growth
California 1986 11 38
Florida 1988 44 27
Georgia 1994 48 6
Illinois 1983 25 32
Iowa 1988 18 31
Louisiana 1991 41 19
Michigan 1981 14 35
Missouri 1986 45 18
New Mexico 1996 16 29
North Carolina 2006 31 24
Ohio 1983 26 37
Oklahoma 2005 36 21
South Carolina 2002 43 5
Tennessee 2004 49 33
Texas 1992 32 15
Virginia 1989 35 10
Source: US Census.
A simple regression of the 1977 rank in spending and the 1977-2006 growth rate yielded a negative, significant coefficient. This suggested, rather crudely, that education spending was converging for these states and that states that passed lotteries for education from 1977-2006 tended to have lower per capita education spending than average and tended to increase their education budgets more quickly than average.
Theroy Underlying The Empirical Model
The notion of convergence and conditional convergence comes from the literature in macroeconomics and the economics of growth. The idea was that countries with different levels of income would grow at different rates such that incomes across countries would converge on a single level. The notion of convergence was later modified to test if the convergence was influenced (was conditional) on various characteristics present or absent in a country.
Barro and Sala-i-Martin (1991 and 1992) and Barro (2008) explored the notion of conditional convergence and came up with a method of testing if the presence of a factor is an important condition for convergence. This method used “Barro regressions”. Barro regressions are cross-sectional equations with the growth of a variable on the left-hand side and the initial value of the variable, along with other important control variables, on the right-hand side. The initial value of the variable is included to test if convergence is occurring (for convergence to occur, high growth rates must be associated with low initial values) and the control variables are included to verify various hypotheses on what other factors might be important conditions that make convergence happen.
average and marginal tax rates. There is no reason one could not use the same statistical techniques to discover if spending on education is converging across the states and if that convergence, if it is happening, is conditional on a specific factor or event, such as the passing of a lottery with funds earmarked for education.
Chart 1 gives a more analytical presentation of the data which will more formally indicate if the convergence hypothesis is credible. Chart 1 plots the relative (to the U.S. average) growth in per capita education spending for the 50 states with the relative (again to the U.S. average) 1977 spending. If convergence was indeed happening, one should see a negative relationship between the initial value of spending and the growth of spending. Chart 1 reveals such a relationship. The correlation between initial spending and growth was -0.68. A simple regression represented by the trend line in Chart 1 revealed that the negative slope is significantly less than zero.
EMPIRICAL ESTIMATION
The next step was to test if the apparent convergence was conditional on a state passing a lottery for education. To do this, a procedure inspired by Becsi (1996) was followed.
Yi = β0 + β1Initial Spendingi + β2Lotteryi + β3Growth in Incomei + β4Growth in Incomei + β5Growth in Tax
Collectionsi + εi (1)
where Yi= average annual differential (from the U.S.) growth rate of per capita state and local direct education
spending from 1977 to 2006.
Initial Spendingi= relative (to the U.S. average) per capita state and local direct education spending in 1977
Lotteryi= an indicator variable equaling 1 if a state passed a lottery with funds earmarked for education (or decided
to redirect funds to education from an existing lottery dedicated to another purpose) between 1977 and 2006, 0 otherwise
-10 -8 -6 -4 -2 0 2 4 6
-50 0 50 100
Rela
tiv
e
G
ro
w
th in P
er
Ca
pita
E
du
ca
tio
n Spend
ing
(1
9
7
7
-2006)
Relative Education Spending (1977)
Interactioni= lotteryimultiplied by initial spendingi
Growth in Incomei= average annual differential (from the U.S.) growth rate of per capita state personal income
Growth in Tax Collectionsi= average annual differential (from the U.S.) growth rate of per capita state and local tax
collections
i = 50 states
Equation (1) is a Barro equation for conditional convergence. As described above, a Barro equation is a cross-sectional regression specification that features growth on the left-hand side and an initial value of the left-hand side variable with other control variables on the right-hand side. Equation (1) tested if growth in education spending was a function of an initial level of education, the passage of an education lottery, and growth in income and taxes.
The primary variables of interest from equation (1) were the initial spending variable and the interaction
variable. A negative coefficient on initial spending implies that a low value of initial spending was associated with a high rate of growth in education spending. Likewise, if the sum of the coefficients on initial spending and
interaction is negative, then it can be concluded that states which passed lotteries for education and had low initial values of education spending were associated with high education spending growth.
The other control variables were the indicator for passing a lottery, the growth in per capital personal income, and the growth in per capita tax collections. With the inclusion of the interaction variable, the value of the coefficient on the binary indicator variable was less important than it otherwise would be; it is still a necessary component in the model since it gave insight into if a lottery is important in states that were far behind the national average or if a lottery enhanced education funding for any state that passed one (Stock and Watson, 2007). The growth in personal income and tax collections were included in the model because those two variables might have been important in determining how much education spending grew. Holding those factors constant aided in the interpretation of the “initial spending” and “interaction” variables.
In other words, the specification in equation (1) provides a direct way to infer if passing a lottery, with net revenues dedicated to education, helped low spending states “catch up” with their higher spending neighbors. The variable initial spending is the direct test for convergence of education spending across all states while the addition of the lottery indicator variable, along with the interaction variable, refines the model by separating the states that passed lotteries from the states that did not. This enables one to test the hypothesis that the convergence, if it exists in the entire sample of 50 states, was actually being driven by the states that passed lotteries.
The specification in equation (1) may be problematic for two reasons. The variable lottery might not be able to fully capture the differences that existed between the group of states that passed education lotteries in the time period and those that did not. For instance, Illinois and Ohio began their education lotteries in 1983, relatively early in the time period, while North Carolina began its lottery in 2006, which was the last year represented in the data. The fact that there was not a discrete distinction between the two groups of states separated by the lottery
indicator variable might introduce an important amount of noise into the data and cloud the regression’s ability to make inferences. Any problems caused by the lottery variable will carry also into the interaction variable.
Furthermore, many states had their lottery funds go directly into the general fund with no earmarking. Since the largest single state budget item was education, a “general purpose” lottery would increase available funds for education. This further dilutes both the interaction and lottery indicator variable.
Therefore, a second specification was used. This specification, also a Barro equation, was as follows:
Yi = β0 + β1Initial Spendingi + β2Lottery Revenue in Lottery States 2006i + β3Growth in Incomei + β4Growth in Tax
Collectionsi + εi (2)
where Lottery Revenue in Lottery Statesi = relative (to the U.S. average) per capita net lottery revenues if a state had
All other variables are defined as they were in equation (1).
This equation focuses on a slightly different problem and is perhaps a more indirect method of testing if the convergence of spending on education was conditional on the passage of a lottery for education. The important coefficients in equation (2) are the coefficients on initialspending and lottery revenue in lottery states 2006. As in (1), a negative coefficient on initial spending implies (holding all else in the model constant, of course) that convergence was happening. A positive coefficient on lottery revenue in lottery states 2006 would imply that, holding initial spending constant, higher lottery revenues that were dedicated to education in states that passed a lottery for education in the time period 1977-2006 were associated with higher rates of spending growth between 1977 and 2006. This would imply that passing an education lottery aided in convergence and, indeed, the convergence seen in education spending in the time period was conditional on the passage of a lottery for education.
RESULTS AND DISCUSSION
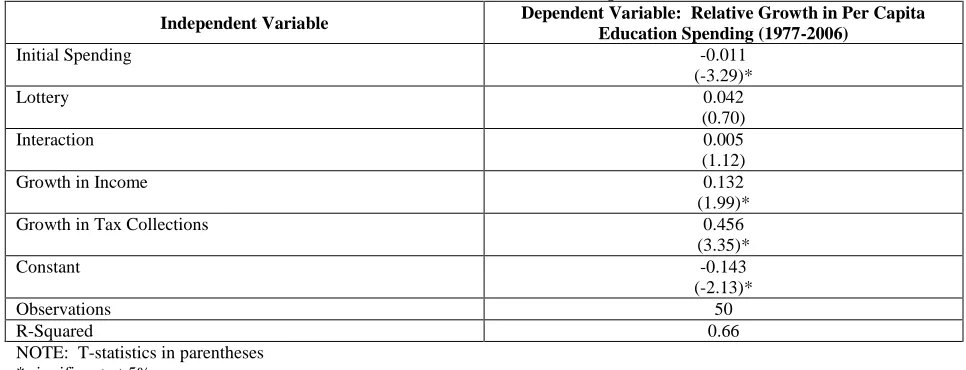
Table 2 reports the results of the estimation of equation (1). Equation (1) was estimated using ordinary least squares with robust standard errors. The coefficient on each variable was reported along with the t-statistic in parentheses and the p-value in brackets.
Table 2: Results from the Estimation of Equation (1)
Independent Variable Dependent Variable: Relative Growth in Per Capita
Education Spending (1977-2006)
Initial Spending -0.011
(-3.29)*
Lottery 0.042
(0.70)
Interaction 0.005
(1.12)
Growth in Income 0.132
(1.99)*
Growth in Tax Collections 0.456
(3.35)*
Constant -0.143
(-2.13)*
Observations 50
R-Squared 0.66
NOTE: T-statistics in parentheses * significant at 5%
The coefficient on relative per capita education spending in 1977 was -0.011 and was highly significant with a t-stat of -3.29. This provided strong evidence that convergence was happening; that is, states with low levels of per capita state and local education spending in 1977 caught up with higher spending states by increasing their spending at a higher rate.
The second coefficient of interest was the coefficient on the variable indicating if a lottery with funds earmarked for education was passed during the 1977-2006 time-period. The coefficient was positive as expected, indicating that sixteen states that passed lotteries for education had a higher growth rate in education spending, but with a t-stat of only 0.70, was not significant.
A Wald test was performed to test the hypothesis that (β1+ β3) = 0 against the alternative hypothesis that
that (β1+β3) ≠ 0. The F-stat for the test was 2.12. With (1, 44) degrees of freedom, the probability of observing that
value for F was 0.15. Therefore, one can only reject the null hypothesis with a 15% significance level.
The next control variable was growth in per capita income. The coefficient on this variable was 0.132 with a t-statistic of 1.99 and a p-value of 0.05. This meant that states with a high degree of per capita personal income growth experienced higher levels of growth in per capital education spending. This, of course, was not surprising. One would expect education spending to have increased as incomes increased.
The final control variable was relative growth in per capita tax collections. The coefficient on this independent variable was 0.456 with a t-statistic of 3.35 and a p-value of 0.00. This indicated that states with high levels of growth in tax collections also had high levels of growth in per capita education spending. Again, this was what one expected.
Taken together, one can make some inferences about the role lotteries had in education funding. First, education funding across the states converged from 1977 to 2006. Second, passing a lottery with funds earmarked for education seemed to play an important role in that convergence at only a 15% significance level. Finally, states that saw relatively large increases in incomes and tax collections saw large increases in education spending.
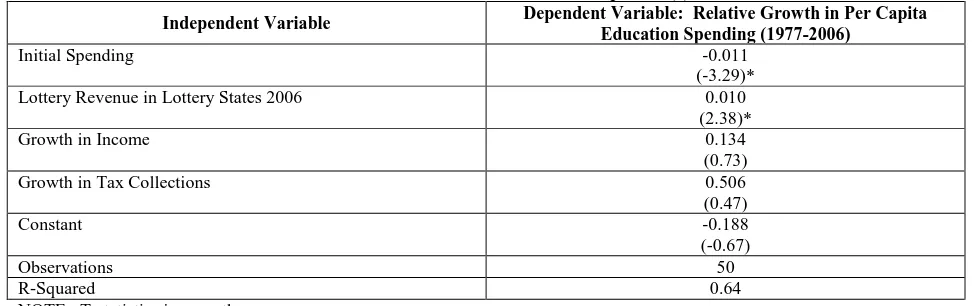
Table 3 presents the results of equation (2). The coefficient on initial is -0.011 and is strongly significant (t-stat of -3.29). The coefficient on lottery revenue in lottery states 2006 was 0.010 and was also significant (t-stat of 2.38). Not surprisingly, the coefficients on growth in both income and taxes were positive, although the coefficient on the growth in taxes was not significant.
The pattern of the coefficients on initial spending and lottery revenue imply that convergence happened from 1977 to 2006 and that states that passed education lotteries grew faster than those that did not. This provides significant evidence that states that passed lotteries for education indeed saw their education budgets grow at faster rates than those that did not.
Table 3: Results from the Estimation of Equation (2)
Independent Variable Dependent Variable: Relative Growth in Per Capita
Education Spending (1977-2006)
Initial Spending -0.011
(-3.29)*
Lottery Revenue in Lottery States 2006 0.010
(2.38)*
Growth in Income 0.134
(0.73)
Growth in Tax Collections 0.506
(0.47)
Constant -0.188
(-0.67)
Observations 50
R-Squared 0.64
NOTE: T-statistics in parentheses * significant at 5%
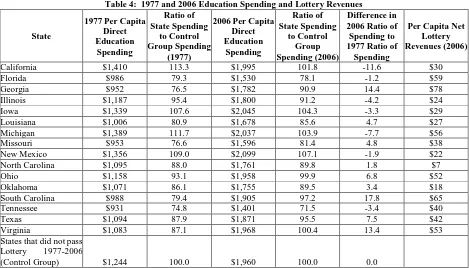
Given the results from the estimation of equations (1) and (2), one would have expected that the passage of a lottery would have been effective in states that had below average education spending. This section will explore that idea by scrutinizing the pattern of education spending in each of the sixteen states that newly diverted lottery proceeds to education between 1977 and 2006.
states. For example, California spent $1,410 per capita in 1977, which is 113.3 percent of the amount spent by the 34 states in the control group. The third and fourth columns of Table 4 report that same information for 2006.
Table 4: 1977 and 2006 Education Spending and Lottery Revenues
State
1977 Per Capita Direct Education Spending Ratio of State Spending to Control Group Spending (1977)
2006 Per Capita Direct Education Spending Ratio of State Spending to Control Group Spending (2006) Difference in 2006 Ratio of Spending to 1977 Ratio of
Spending
Per Capita Net Lottery Revenues (2006)
California $1,410 113.3 $1,995 101.8 -11.6 $30
Florida $986 79.3 $1,530 78.1 -1.2 $59
Georgia $952 76.5 $1,782 90.9 14.4 $78
Illinois $1,187 95.4 $1,800 91.2 -4.2 $24
Iowa $1,339 107.6 $2,045 104.3 -3.3 $29
Louisiana $1,006 80.9 $1,678 85.6 4.7 $27
Michigan $1,389 111.7 $2,037 103.9 -7.7 $56
Missouri $953 76.6 $1,596 81.4 4.8 $38
New Mexico $1,356 109.0 $2,099 107.1 -1.9 $22
North Carolina $1,095 88.0 $1,761 89.8 1.8 $7
Ohio $1,158 93.1 $1,958 99.9 6.8 $52
Oklahoma $1,071 86.1 $1,755 89.5 3.4 $18
South Carolina $988 79.4 $1,905 97.2 17.8 $65
Tennessee $931 74.8 $1,401 71.5 -3.4 $40
Texas $1,094 87.9 $1,871 95.5 7.5 $42
Virginia $1,083 87.1 $1,968 100.4 13.4 $53
States that did not pass Lottery 1977-2006
(Control Group) $1,244 100.0 $1,960 100.0 0.0
A careful analysis of Table 4 reveals that California, Iowa, Michigan, and New Mexico began the time period of this study with higher than average education spending and spent less (relative to other states) by 2006. California spent 113.3 percent of the control group in 1977, but in 2006, it only spent 101.8 percent of the average of the control group. Iowa’s results were similar. Its education spending fell from 107.6 percent to 104.3 percent. Michigan’s spending went from 111.7 to 103.9 of the average control group spending in 1997 and 2006, respectively. New Mexico’s spending went from 109 percent of average to 107.1 percent. Given these results, it is difficult to conclude that the passage of a new lottery had a positive impact on education funding in these states since their funding slipped relative to states that had an existing lottery for education or no lottery for education.
As calculated in Table 4, twelve of the sixteen states had spending that was less than the average of the control group. Nine of these twelve states increased their education spending relative to the control group. Only Florida, Illinois and Tennessee had spending that slipped relative to the group of 34 states that did not pass education lotteries in the 1977-2006 time period. Florida’s spending was 79.6 percent of the control groups in 1977 and fell to 78.6 percent in 2006. Illinois’ spending fell from 95.4 percent to 91.2 percent from 1977 to 2006. Likewise, Tennessee’s spending fell to 71.6 percent in 2006, from 75.1 percent in 1977. The other nine states started with relatively low education funding, passed lotteries, and experienced a relative increase in education funding in the 1977-2006 time period.
One final insight from Table 4 concerns the size of the lotteries themselves. The sixth column of Table 4 reports per capita net lottery revenues. Lottery revenues were typically a very small portion of lottery revenues. Oklahoma’s lottery in 2006, for instance, only generated $18 per person, which is approximately 1% of the $1,755 per person Oklahoma spent on education. On the other end of the spectrum is Georgia. Georgia’s lottery was very lucrative, generating $78 dollars per person, which was over 6% of its total education budget of $1,782 dollars per person.
account for all of the increase. So while lotteries have been an important tool at the disposal of state legislatures to increase relative education funding, they were not the only means employed to increase funding.
CONCLUSION
The question of education funding is a two-part question: 1) how can those who allocate education budgets do so in a manner where more spending translates to more resources and improved outcomes? and 2) how can the political process get more money for education? Both of these questions are highly debated. Jefferson (2005) summarized the literature on how money was spent was more important than how much money there was. Of course, this implies that more money well spent should make a difference.
If that is the case, how then can state and local governments marshal resources for education? One way is to raise taxes. This study suggested, not surprisingly, that states that rapidly increased their education budgets also raised taxes. Another way is to introduce new revenue sources, such as a lottery, but legislators must be careful when using either approach. The literature is far from reaching a consensus on the question of the likelihood of earmarked revenue actually reaching the line of the budget it was intended to reach. This study would seem to suggest that earmarking works since it was shown that passing a lottery for education was a key indicator of a state increasing its education budget if that state started with low education spending.
There is strong statistical evidence that education spending across the states is converging and this convergence is perhaps conditional on the passage of a lottery in states that had put poor effort into education spending. This suggests that the lotteries for education passed in states since 1977 may have had their intended impact - increase education spending relative to other states - but the increase in relative funding is larger than the lotteries themselves. Thus, this research has concluded that the passage of a lottery is likely a very important part of a larger strategy of states to increase education funding.
There are more questions, however: 1) If lotteries are not solely responsible for shrinking the gap in education funding in these states, what other specific policies were responsible?, 2) Why did the lotteries in Florida and Tennessee not seem to raise revenue for education like in other states?, and 3) If lotteries are so successful at increasing education funding, why are there still states that do not have them?
AUTHOR INFORMATION
Dr. Rex Pjesky is associate professor of economics at West Texas A&M University in Canyon, Texas. Dr. Pjesky earned a doctorate degree in economics from Oklahoma University. E-mail: rpjesky@wtamu.edu
REFERENCES
1. Barro, Robert J. 2008. Macroeconomics: A Modern Approach. Thomson South-Western, USA. 2. Barro, Robert J. and Xavier Sala-i-Martin. 1991. “Convergence across States and Regions.” Brookings
Papers on Economic Activity, 1: 107-158.
3. _____. 1992. “Convergence.” Journal of Political Economy, 100: 223-51.
4. Becsi, Zsolt. 1996. “Do State and Local Taxes Affect Relative State Growth?” Economic Review, March/April: 18-36.
5. Crampton, Faith E. 2005. “State School Finance Legislation: A 50-state Overiew and Trend Analysis.
Journal of Education Finance, 32: 470-487.
6. Evans, William N. and Ping Zhang. 2007. “The Impact of Earmarked Lottery Revenue on K-12 Educational Expenditures.” Education Finance and Policy, 2: 40-73.
7. French, P. Edward and Rodney E. Stanley. 2003. “Can Students Truly Benefit From State Lotteries: A Look at Lottery Expenditures Toward Education in the American States.” Social Science Journal, 40: 327-333.
9. Jefferson, Anne L. 2005. “Student Performance: Is More Money the Answer?” Journal of Education Finance, 31: 111-124.
10. Mikesell, John L. and Kurt Zorn. 1988. “State Lotteries for Public Revenue.” Public Budgeting and Finance, 8: 38-47. 18
11. Miller, Donald E. and Patrick A. Pierce. 1997. “Lotteries for Education: Windfall or Hoax?” State and Local Government Review, 29: 34-42.
12. Novarro, Neva K. 2005. “Earmarked Lottery Profits: A Good Bet for Education Finance?” Journal of Education Finance, 31: 23-44.