plan is an on-going project, called as TA low energy extension (TALE), to extend the sensitive energy range to 1016.5eV in order to study the second knee, the predicted galactic-extragalactic transition of
dominant sources and air shower phenomena comparing with LHC measurements. The second proposition is exchanges of FDs and SDs between TA and Pierre Auger Observatory, toward understanding systematic uncertainties of these experiments and to solve discrepancies in energy scales andXmax. The third plan is
a huge air shower array, “the world observatory”, consisting of a huge number of SDs and/or FDs for the world’s largest exposure and the finest accuracy to open a new window on astronomy with ultra high energy particles.
1. INTRODUCTION
The Telescope Array (TA) experiment has been used for measuring extensive air showers (EASs) in order to study the origin of ultra-high-energy cosmic rays (UHECRs) [1]. The site is located in the desert of Millard county, Utah, USA (39.3◦N, 112.9◦W). TA consists of two types of detectors: 507 surface detectors (SDs) arrayed with a spacing of 1.2 km between each SD in an area of approximately 680 km2, and air fluorescence detectors (FDs) in three stations located around the SDs facing inward and looking over the array. The full operation of the detectors have been started in March 2008.
In the TA experiment we have the most valuable calibration facility which is a electron linear accelerator, called “Electron Light Source (ELS)” [2]. ELS installed 100 m away from the south-east FD station (called BRM station) shoots calibrated electron beams for FDs. The typical energy per electron and the number of electrons are 40 MeV and 109, respectively. With this equipment we will achieve an end to end calibration for FDs.
After four years of very stable operations, we have successfully released our results in this conference, although some of these are still preliminary. The results are briefly summarized as follows: The energy spectrum has a clear “ankle” at 1018.7eV and a sharp cutoff above 1019.7eV. The flux is consistent with the HiRes result. The shape of the spectrum curve, it means spectral indexes and break points on the curve, are fitted to the spectrum curves by HiRes and that by Auger, However, to fit our curve with that by Auger we need to shift primary energies about 20%. Our preliminary results of mass composition analyses, which are averagedXmaxand their distributions, show that protons dominate the primary composition of observed showers. This preliminary conclusion contradicts the Auger’s results [3], which show a transition of the dominant composition from light to heavy, derived from averaged
Xmaxvalues and their distributions. From arrival direction distribution analyses, we do not observe the
ae-mail:[email protected]
bFor the full authorlist see Appendix “Collaborations” in this volume.
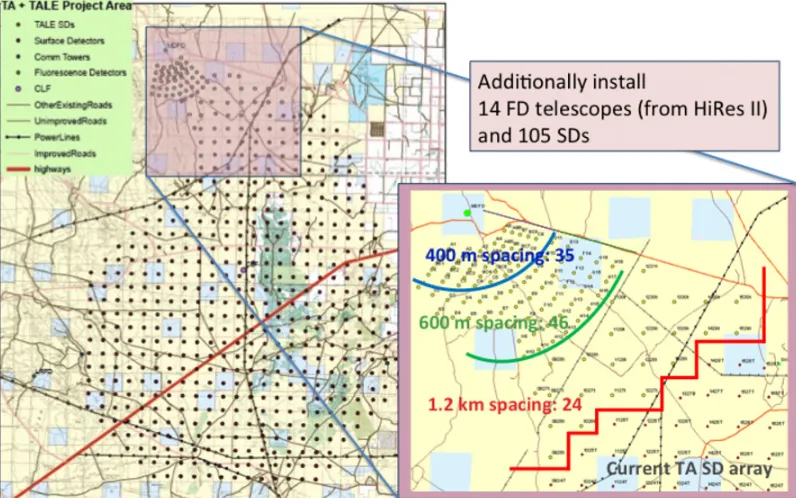
Figure 1. Left: the overall view of the TA SD array and the planed the TALE array. TALE is installed on the north-west boundary of the TA SD array. Right: the planed locations of the TALE SDs. The SD density increases toward the Middle Drum FD station.
departure from isotropic, but the arrival direction distributions are also compatible with the large scale structure of the matter distribution.
2. TA LOW ENERGY EXTENSION (TALE)
The first future plan, actually which is on-going project, is an extension of our observation efficiencies for primary energy measurements and for primary composition measurements to low energies. It is called TALE, which stands for TA Low energy Extension. The aim of this project is to search for the galactic to extra-galactic transition of the dominant cosmic ray source population, to study iron-knee which reported by HiRes-MIA experiment [4], to measure 2nd knee of energy spectra which measured at 1017.5eV by several experiments, and to confirm air shower models using hybrid techniques and calibrations by ELS, including and comparing with results from by LHCf and other accelerator experiments.
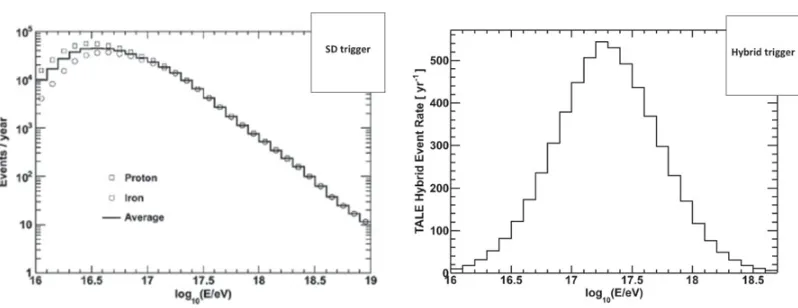
Figure 2. Left: an expected number of TALE SD triggers per year. The plots show MC results for primary protons and for primary irons, and the line is the average of the plots at each energy bin. Right: an expected number of hybrid triggers per year.
TALE FDs make the two ring configuration of the field of view to observe air showers at elevation angles from 31◦–59◦, in addition to the current Middle Drum fluorescence telescopes observing from 3◦–31◦in elevation. The TALE FD’s shed has been constructed just beside the Middle Drum station. On the other hand, the production of SDs have also started recently. The design of SD is identical with the detector used in the TA SD array.
The expected number of events by the TALE SD array is 50,000 with the mode energy of 1016.5eV, and for hybrid events the expected event rate is 5,000 per year with the mode energy of 1017.3eV. The expected energy distributions are shown in Fig.2.
3. EXCHANGE OF FDS AND SDS BETWEEN TA AND AUGER
As many reports and discussions have been shown in this symposium, the TA’s preliminary results and the results reported by Auger have serious discrepancies in the energy scale and in longitudinal development measurements, such as averagedXmax andXmaxdistributions. The working groups were organized and will continue to make effort to solve these problems. For example, exchanging data or exchanging calibration devices will be discussed, but I would like to propose exchange of experimental equipment between TA and Auger. The minimum requirement for this plan is an exchange of two TA’s FD telescopes with one Auger’s FD telescope. It is equivalent to the exchange of 20◦–30◦ FOVs, and its cost can be estimated very roughly at about one million dollars. On larger scale, if we can exchange one FD station plus 100 SDs with each other, it will provide valuable results to solve various problems, and it will enhance our knowledge about air shower phenomena. The estimated cost is about ten million dollars.
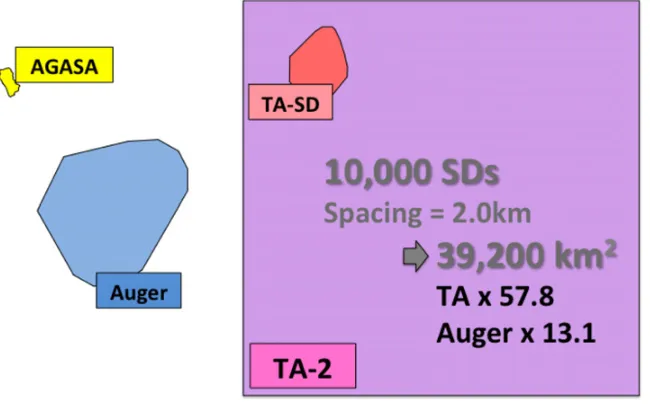
4. A HUGE AIR SHOWER ARRAY AS THE WORLD OBSERVATORY
In this calculation, the galactic magnetic field strength is taken into account. Right: the product of the number of sources and the solid angle of the source resolutions. At the energies for the products<4UHECR sources can be resolved as point sources.
A particularly good strategy for searching point sources is to concentrate on observations of UHECRs in the highest energies. This restriction of the energy range brings in a limitation of the number of sources which contribute to the observed events, and as a result it provides easy source identifications. If we assume primary protons, the mean free path of the cosmic rays decreases with increasing energies with the GZK mechanism. Thus, the volume of the GZK sphere and then the number of sources also decrease with increasing energies. For example, based on the mean free path calculated by Takami et al. [5] with assuming the source density is 10−4Mpc−3, atE=1019.6eV, the GZK sphere radius,RGZK, is about 200 Mpc and the number of sources, NS, is about 4000. AtE=1019.8eV,RGZK ∼60 Mpc andNS∼100. At higher energy, for example atE=1020.0eV, the number of contributing sources is reduced to 10 withRGZK ∼30 Mpc.
To enable us to resolve sources on the sky map the product of the number of sources and the solid angle of a resolution is needed to be less than 4steradians. The source resolutions depend on blurs, RMS of cosmic ray’s deflection angles by magnetic fields, and detector’s angular resolutions. The RMS of deflection angles calculated with a formula used by Auger group [6] is shown in Fig.3(left). On the other hand, here we assume the detector’s angular resolution of 2.1◦, which is slightly larger than the TA SD array’s resolution. As a result, the product of the number of sources and the solid angle of the source resolution is obtained as shown in Fig.3(right) for the several source density assumptions. Setting the upper limit of 4, the target threshold energy is determined to 1019.8eV.
Once we determined the threshold energy, we obtain an optimum value for the detector spacing. Assuming the square grid alignment of the current TA SD, which has the sensitive area of 3 m2, a simple Monte Carlo calculation, shows the optimum spacing is 2.0 km, and this spacing gives 95% detection efficiency at 1019.8eV, as shown in Fig.4.
Figure 4. The vertical axis shows threshold energy, E95, of air shower arrays. The threshold energy is defined as the triggering efficiency is 95% at E95. The horizontal axis shows array spacing distances. Theses relations were calculated with very simple MC calculations based on empirically modified Gaisser-Hillas function and empirically modified NKG function.
Figure 5. Comparison of the coverage area of the proposed huge array, tentatively called “TA-2” here, with the others.
i.e., whether scintillators or water tanks is better, DAQ communication system between detectors, etc. And also we need careful studies and discussions about the importance of the sensitivity for neutrino with this array.
Finally, the plan secondly mentioned, exchange of FDs and SDs, to study systematic differences between TA and Auger with observations and analyses for same showers, same laser beams and same accelerator beams, will provide us solutions for the discrepancies. In addition, this project with enhancement of the cooperative relationship between TA and Auger is a critically important step for further extensions of UHECR researches.
The author thanks Mr. Shogo Kobayashi for his MC calculations and analyses. He made large and quite important contributions on studies for the huge air shower array. The author also thanks all the members of Telescope Array collaboration. The Telescope Array experiment is supported by the Japan Society for the Promotion of Science through the Grants-in-Aid for Scientific Research on Specially Promoted Research (21000002) entitled
˛
aÈExtreme Phenomena in the Universe Explored by Highest Energy Cosmic Rays ˛aÉ and the Inter-University Research Program of the Institute for Cosmic Ray Research; by the U.S. National Science Foundation awards PHY-0307098, PHY-0601915, PHY-0703893, PHY-0758342, PHY-0848320 (Utah) and PHY-0649681 (Rutgers); by the National Research Foundation of Korea (2006-0050031, 2007-0056005, 2007-0093860, 2010-0011378, 2010-0028071, R32-10130); by the Russian Academy of Sciences, RFBR grants 10-02-01406a and 11-02-01528a (INR), IISN project No. 4.4509.10 and the Belgian Science Policy under IUAP VI/11 (ULB). The foundations of Dr. Ezekiel R. and Edna Wattis Dumke, Willard L. Eccles, and George S. and Dolores Dore Eccles all assisted with generous donations. The State of Utah supported the project through its Economic Development Board, and the University of Utah through the Office of the Vice President for Research. The experimental site became available through the cooperation of the Utah School and Institutional Trust Lands Administration (SITLA), the U.S. Bureau of Land Management, and the U.S. Air Force. We also wish to thank the people and the officials of Millard County, Utah, for their steadfast and warm support. We gratefully acknowledge the contributions from the technical staff of our home institutions and the University of Utah Center for High Performance Computing (CHPC).
References
[1] Kawai H, et al., Nucl. Phys. B Proc. Suppl. 175-176 (2008) 221 [2] Shibata T, et al., Nucl. Instr. Meth. A 597 (2008) 61
[3] Abraham J, et al., Phys. Rev. Lett. 104 (2010) 091101 [4] Abu-Zayyad T, et al., Ap. J. 557 (2001) 686
[5] Takami H, et al., Astropart. Phys. 31 (2009) 201 [6] Abreu P, et al., arXiv:1107.4805, (2011) [7] Kido E, private communication
![Figure 3. Leftsources and the solid angle of the source resolutions. At the energies for the products: the blur, i.e., the RMS of deflection angles, calculated with a formula used by Auger group [6].In this calculation, the galactic magnetic field strength i](https://thumb-us.123doks.com/thumbv2/123dok_us/8744276.1434583/4.595.118.478.126.261/leftsources-resolutions-deection-calculated-calculation-galactic-magnetic-strength.webp)