IJEDR1703149
International Journal of Engineering Development and Research (
www.ijedr.org
)
1056
Spatial Estimation of Soil Erosion Using RUSLE, RS,
and GIS Techniques: A Case Study of T.G. Halli
Watershed, Karnataka, India
Y A Narayana Swamy
1, Dr. M. Inayathulla
2, Dr. Shashishankar.A
3Research Scholar, Civil Engineering Department, SET-Jain University, Bangaluru, Karnataka, India1
Prof. Civil Engineering Department, U.V.C.E, Bangalore University, Bangaluru, Karnataka, India2
Prof. & Head, Civil Engineering Department, AMC Engineering College, Bangaluru, Karnataka, India3
________________________________________________________________________________________________________ Abstract:- Soil erosion causes depletion of fertile agricultural land and the resulting sediment deposited at the river networks creates river morphological change and reservoir sedimentation problems. In the present study, the soil loss model, Revised Universal Soil Loss Equation (RUSLE) integrated with GIS has been used to estimate soil loss in T.G. Halli Watershed, Karnataka, India. Remote Sensing provided the base information’s such as, land use/land cover, soil, hydro-geomorphology, slope and other aspects. GIS was used for database creation and analysis purposes. Morphometric analysis was carried out for the entire watershed and also at the sub-watershed level. Drainage density was estimated to be 1.39 Km/Sq.km for the entire watershed. Soil loss was estimated using Universal Soil Loss Equation (RUSLE). The weighted soil erosion for the entire subwatershed was estimated to be 16.40t/ha/year. In GIS platform, the overlay of rainfall-runoff erosivity factor, soil erodibility factor, slope length factor, slope steepness factor, cover and management factor, support and conservation practices factor results that the high amount of soil loss is significantly low and occupies 0.11% of the entire study area. High soil loss in upstream of the basin has a close relation to LS and K factor and drainage density. As a result of soil loss in the upper catchment areas, reservoir capacity has been depleted both in dead and live storage space.
Index Terms—RUSLE, Soil erodibility factor, slope length factor, slope steepness factor, GIS
________________________________________________________________________________________________________
1 INTRODUCTION
Erosion removes organic matter from soil and contributes to breakdown of the soil structure that will in turn affect soil fertility and the crop yields. Soil erosion causes siltation of reservoirs, which ultimately reduces the life of the project and affects generation of hydroelectric power. It also affects the flora and fauna of the earth. Eroded sediment can carry nutrients particularly phosphates to waterways, and contribute to eutrophication of lakes and streams. Adsorbed pesticides carried with eroded sediments, adversely affect surface water quality. Soil erosion occurs as a result of changes in agricultural practices, agricultural intensification, land degradation and global climate change [1]. Inter-rill and gully erosion are the results of the removal of soil particle from its parent place of origin by the raindrops. These detached particles of soil are then transported ultimately to the river basin that enrich the suspended sediment yield, bed load and sediment delivery ratio of the river basin [2]. The total land area subjected to human-induced soil degradation is estimated at about 2 billion hectares. By this, the land area affected by soil degradation due to erosion is estimated at 1100 Mha by water erosion and 550 Mha by wind erosion [3]. Soil erosion in India has a major effect on the agricultural sector, siltation of reservoirs and degradation of soils. In India, almost 130 million hectares of land [4], i.e., 45% of the total geographical surface area, is affected by soil erosion. Soil erosion estimated by Narayan and Babu [5] in India is 16.4 t ha-1
(5334 m-tonnes) of soil detaches annually due to various reasons, 29% of soil loss is carried away by the river into the sea and 10% into the reservoirs that lead to reservoir sedimentation. Soil is detached mainly by rainwater erosion (56 %) and wind erosion (28 %), physical deterioration (12 %) and chemical deterioration (4 %) [6].
The soil erosion process is modified by biophysical environment comprising soil, climate, terrain, ground cover and interactions between them. Important terrain characteristics influencing the mechanism of soil erosion are slope, length, aspect and shape. Impact of slope and aspect would play a major role in runoff mechanism. More the slope, more the runoff and thus infiltration reduces. The runoff generated from slope will find a path nearby and this would lead to erosion of soil as the velocity of the runoff increases. The amount of soil erosion and sediment yield is measured quantitatively and consistently with the help of two types of models: physical based models and empirical models. The physical based models illustrate the mechanism of the controlling of the erosion processes by solving corresponding various equations, while the empirical models are widely used for measurement of the surface soil loss and sediment yield from the catchment areas [7]. In the present study an attempt is made to focus on the estimation of soil erosion in the T.G. Halli Watershed and its impact on the T.G Halli reservoir sedimentation.
2 LOCATION OF THE STUDY AREA
IJEDR1703149
International Journal of Engineering Development and Research (
www.ijedr.org
)
1057
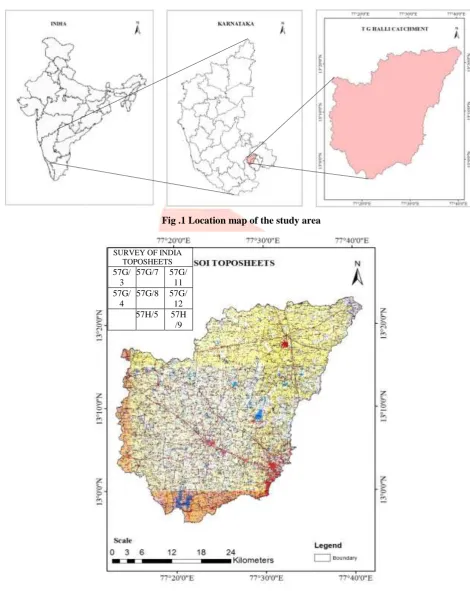
of the catchment were approximately 61.3 km and 36.8 km respectively. The study area is characterized by the presence of large number of irrigation tanks, which intercept the flow from their receptive command area. Most of these tanks are old and partially silted up and the status of the bunds, sluice and channels are in deliberated condition, some sluice are not functioning. The state capital Bangalore city is situated at the south eastern boundary of the catchment. National highways (NH 4, 48) and Bangalore-Hubli, Bangalore - Hyderabad railway line passes through the catchment. The Location map and Topo sheet of the study area are shown in Fig 1 and fig.2 respectively.Fig .1 Location map of the study area
Fig .2: SOI Topo Sheet of the study area SURVEY OF INDIA
TOPOSHEETS 57G/
3
57G/7 57G/ 11 57G/
4
IJEDR1703149
International Journal of Engineering Development and Research (
www.ijedr.org
)
1058
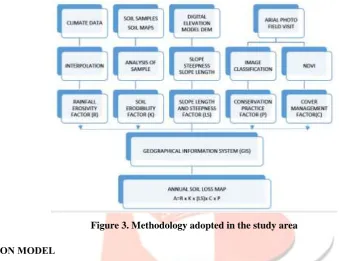
3 METHODOLOGYMany techniques and studies realized worldwide were done about the evaluation of soil loss. Most of them are using the Universal Soil Loss Equation (USLE) and its revised version (RUSLE) [8]. Others had modified part of the equation to adapt in every country’s situation. In this study RUSLE model was selected and applied in study area as it requires land use land cover map that can be generated by remote sensing images, management practices, soil types and properties. The parameters of this model can be easily integrated with GIS for better analysis. The main aim of present study is to integrate RUSLE model with remote sensing and GIS techniques for assessing the erosion in T.G.Halli watershed. The methodology describes the basic concepts, the procedure of the RUSLE model to estimate parameters and parameter prediction of RUSLE model. The parameters of RUSLE model have been estimated based on the rainfall events, DEM, soil type, and land cover. The overall methodology used in the present study is schematically represented in Fig.3.
Figure 3. Methodology adopted in the study area
4 SOIL EROSION MODEL
When the sediment load reaches the carrying capacity of the flow, detachment can no longer occur. Sedimentation must also occur during the receding portion of the hydrograph as the flow rate decreases [9]. The basic form of RUSLE equation has remained the same, but modifications in several of the factors have changed. The disadvantage of RUSLE is that it does not have the capability for routing sediment through channels, hence its application is limited to small areas and the model is not applied to the very large watershed [10]. In this study, RUSLE was used for the assessment of annual soil loss. RUSLE was designed to predict long-term annual averages of soil loss. RUSLE [11] compute the average annual erosion expected on field slopes using in Eq. (1).
A = R. K. L. S. C. P Eqn.( 1)
where, A - computed spatial average soil loss and temporal average soil loss per unit of area, R - rainfall-runoff erosivity factor, K- soil erodibility factor, L - slope length factor, S - slope steepness factor, C - cover management factor, P - support practice factor. The magnitude of soil erosion depends on two forces-the detachment of soil particles by the impact of rainfall energy called the erosivity of rain, and the ability of the soil to resist the detachment of its particles by this force called the erodibility of soil. This relation is expressed as shown below
Soil erosion = [(erosivity of rain) × (erodibility of soil)] Eqn.(2) The RUSLE is also based on similar principles. The erosivity of rain is represented by the factor R and the erodibility of soil surface system by the multiples of the factors KLSCP. In systems terminology considering the watershed as a system represented by the multiples of the factors KLSCP, the input force is represented by the rainfall erosivity factor R and the output (the response to the input), which is the soil erosion is represented by the letter A.
4.1 RAINFALL EROSIVITY FACTOR (R)
The soil erosivity factor is quantified by the term ‘R’ in the USLE equation. The R factor is determined by both rainfall and the energy imparted to the land surface by the rain-drop impact. For a given storm the rainfall and RUNOFF EROSIVITY INDEX (REI) is determined by multiplying the kinetic energy of the storm to the maximum 30-minute for that storm. The REI values for all the storms occurring in a given year for location are added to obtain an annual erosivity index. The REI30 can be expressed as;
10030 30
I KE
REI Eqn.(3)
Where, REI30 - erosion index, KE- Kinetic energy of storm, I30= maximum 30 minute rainfall intensity of the storm, kinetic energy
IJEDR1703149
International Journal of Engineering Development and Research (
www.ijedr.org
)
1059
The rainfall factor (R) for the present study has been taken from published isopleth map of India (Raghunath B. et. al., 1982). This map has prepared, based on 50 years of weather cycles, provides information on erosive forces of rainfall. For the present study, rainfall factor is taken 40 directly from the published isopleth map of India.4.2 SOIL ERODIBILITY FACTOR (K)
The soil erodibility factor (K) relates the rate at which different soils erode under the conditions of equal slope, rainfall. Some soils erode more easily than others due to inherent soil characteristics such as texture, structure, permeability and organic matter content. The soil erodibility factor (K) can be calculated from the following equation [12]
12
3.25
2
2.5
3
101 . 2
100 4 1 21.14
P S OM N N K Eqn.(4)
Where, K - soil erodibility factor, N1, N2 - particle size parameter (% silt + % very fined sand), OM - percent organic matter content,
S - soil structure code (very fine granular 1; fine granular 2; medium or coarse granular 3; blocky, platy, or massive 4), P - profile permeability class (rapid: 1; moderate to rapid: 2; moderate: 3; slow to moderate: 4; slow: 5; very slow: 6)
The particle size distribution of soils to evaluate ‘K’ values uses the grain sizes as (0.1-2.0) mm for sand, (0.05-0.10) for very fine sand and (0.002-0.05) mm for silt. In order to use the above Wischmeier’s equation, it is necessary that the grain size of the soils in the watershed area brought down to above sizes. This can be obtained by plotting cumulative percentage of silt, very fine sand and coarse sand along log scale versus percentage finer. The soil in the watershed consists of coarse (medium angular), blocky platy or massive type of soil structure for the calculation of K factor. The soil properties of the watershed are shown in Table .1. The soil erodibility factor K for different soils and K-factor estimated for all sub watershed is shown in Table .2
Table .1: Soil properties of T G Halli Watershed
Soil Texture Sand (%) Silt (%) Clay (%)
Organic
Matter (%) K
Clay 37.33 8.50 51.50 0.54 0.29
Clay Loam 42.20 22.60 35.20 35.20 0.46
Dyke ridge 0.00 0.00 0.00 0.00 0.00
Gravelly Clay 54.00 6.00 40.00 40.00 0.38
Gravelly Loam 76.51 14.87 10.25 10.25 0.68
Gravelly Sandy
loam 83.29 4.19 12.16 12.16 0.63
Habitation Mask 0.00 0.00 0.00 0.00 0.00
Loamy Sand 85.70 4.40 9.90 9.90 0.65
Rock Outcrops 0.00 0.00 0.00 0.00 0.00
Sandy Clay 52.93 4.50 41.50 41.50 0.34
Sandy Clay Loam 50.60 14.00 35.40 35.40 0.41
Sandy Loam 75.81 3.75 19.00 19.00 0.52
Water Body Mask 0.00 0.00 0.00 0.00 0.00
Table .2: Soil erodibility factor K for different soils and sub-watershed in T G Halli Catchment
Soil Texture Structure Permeability
Sub-watershed No
Area of Sub-watershed (Sq.km)
K-factor
Clay Blocky, platty,
massive Very slow 1 147.68 0.35
Clay loam Blocky, platty,
massive Slow 2 136.65 0.37
Gravelly clay Medium Slow to moderate 3 173.06 0.39
Gravelly loam Medium Moderate 4 142.62 0.36
Gravelly sandy
loam Coarse granular Moderate 5 161.89 0.41
Loamy sand Medium Moderate 6 211.52 0.41
Sandy clay Coarse granular Slow to moderate 7 281.2 0.35
Sandy clay loam Coarse granular Slow to moderate 8 192.44 0.41
Sandy loam Medium Moderate
IJEDR1703149
International Journal of Engineering Development and Research (
www.ijedr.org
)
1060
of silt, sand plus very fine sand. Therefore particle size distribution curve is not plotted, and K factor is calculated using the available equation, Weighted Average of K was calculated using the following equation
8 1 8 1 i i i i i A K A K Eqn.(5)Where, Ai-area of subwatershed Ki- K-factor for subwatershed
4.3 SLOPE LENGTH FACTOR (L)
The slope length and gradient are represented in the USLE as L and S respectively. However they are often evaluated as a single topographic factor as LS. Slope length is defined as the distance from the point of origin of overland flow to the point where the slope decreases sufficiently for deposition to occur or to the point where runoff enters a defined channel [12]. However, slope length has been considered as average length of overland flow. Runoff from cropland generally increases with increased slope gradient but the relationship is influenced by such factor as type of crop surface roughness and profile saturation soil loss increases much more rapidly than runoff as slope steepens. Slope length factor, can be computed from the following equation;
Eqn.(6) Where, L - slope length factor, l - slope length in m, m - dimensionless exponent,
m = 0.5 for slopes > 4 %; 0.4 for 4% slope; 0.3 for slopes < 3% 4.4 SLOPE STEEPNESS FACTOR (S)
Slope gradient is the field or segment slope usually expressed as percentage. Table 3 shows the LS values calculated for all subwatersheds. The topographic factors are computed using equations.
Eqn.(7) where S - slope steepness factor, - field slope in percent
Table 3:- Topographical factors ‘LS’ for Hesarghatta subwatersheds
4.5 CROP MANAGEMENT FACTOR (C)
This term ‘C’ represents the combined effect of cover crop sequence, productivity level, length of growing season, tillage practices, residue management and the expected time distribution of erosive rainstorm with respect to planting and harvesting date. Crop management factor is most complex and there are many number of methods for managing the growing crops.
To calculate crop management factor C the whole crop duration is divided into four stages. Therefore the cover and management effects can be considered approximately uniform within each period as;
Period 1: Seeding to one month after seeding Period 2: From one to two months after seeding
Period 3: From two months after seeding to crop harvest Period 4: From crop harvest onwards
As rainfall pattern changes from year to year, average rainfall factor (R) for 50 years and percent ‘R’ were worked for above and crop stage periods. Ratios of soil loss from cropped plots to corresponding loss from cultivated fallow plots were worked out for these periods as under. C = REI % x soil loss x 100. Thus the total C value for 4 periods will give crop management factor C.
Sub Water - Shed No.
Area of sub - watershed (Km2)
Length (m) (x) Difference in elevation (m) (y) Slope (%)
tan-1(y/x)
S factor LS factor
1 147.68 23098 577 1.161 0.144 1.161
2 173.06 16076 331 0.924 0.128 0.924
3 136.65 14049 310 0.937 0.135 0.937
4 142.62 26465 162 0.688 0..082 0.688
5 161.89 15403 452 1.141 0.16 1.141
6 211.52 21410 166 0.686 0.087 0.686
7 281.2 21943 124 0.643 0.081 0.643
IJEDR1703149
International Journal of Engineering Development and Research (
www.ijedr.org
)
1061
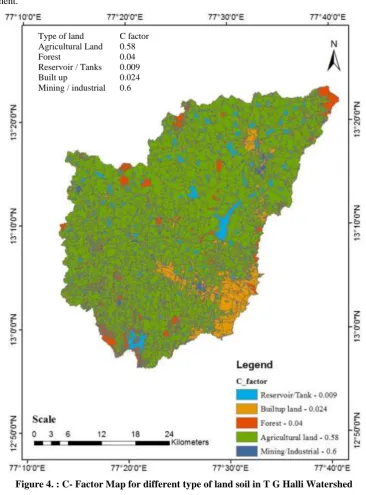
The major crops in the study area include ragi, paddy, Jowar, vegetables and mixed plantations. However, for the present study C factor is taken from the literature (Wishmeir and Smith, 1978). Figure 4 shows the C- Factor values for different type of land soil in T G Halli catchment.Figure 4. : C- Factor Map for different type of land soil in T G Halli Watershed
4.6 CONSERVATION PRACTICE FACTOR (P)
Conservation practice factor is the ratio of soil loss with a specific supporting practice to the corresponding loss with up and down cultivation. In general, when ever sloping land is to be cultivated and exposed to erosive rain, the protection offered by soil or close growing crops in the system needs to be supported by practices that will slow runoff and thus reduce the amount of soil it carries. The most important support practices are contour cultivation; strip cropping, terrace system and waterways for the disposal of excess rainfall. The values are selected based on the recommendations of Wischmeier and Smith [14]. Since the study area comprised of only field bund conservation P factor was taken as unity. The RUSLE Parameters for T G Halli catchment is shown in Table 5.
Table 5: RUSLE Parameters for T G Halli Watershed
Sl no Type of land R K LS CP A(t/ha/year)
1 Agricultural Land 40 0.38 1.038 0.58 9.15
2 Forest 40 0.38 1.038 0.04 0.63
3 Reservoir / Tanks 40 0.38 1.038 0.009 0.14
4 Built up 40 0.38 1.038 0.024 0.38
5 Mining / industrial 40 0.38 1.038 0.6 9.47
IJEDR1703149
International Journal of Engineering Development and Research (
www.ijedr.org
)
1062
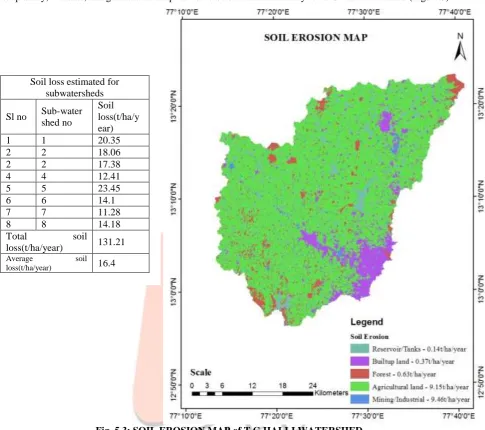
5 SUMMARY AND CONCLUSIONThe data layers (maps) extracted for K, LS, R, C, and P factors of the RUSLE model were integrated using ArcGIS spatial analyst in order to quantify, evaluate, and generate the maps of soil erosion risk and severity for T.G. Halli watershed (Figure.5).
Fig. 5.3: SOIL EROSION MAP of T G HALLI WATERSHED
GIS allows rational management of various types of data, in relation to various factors responsible for the deterioration of soil. In this study it allows us to conclude that the primary factor responsible for the decline of TG Halli Watershed is sloping morphology, soil moisture and vegetation coverage. Changes in soil use in different areas increase soil deficiency. Ground surface is difficult to prevent soil loss, but it may be less suitable for proper use of land and support methods. Rooting rotation and cutting cuts is an important role in fighting against soil loss. The weighted soil loss for the study area is estimated to be 16.40 t/ha/year, which is a moderate loss. To protect conservatives and planners from water, more specifically the management strategy should be implemented to protect the environment and to increase life of T G Halli reservoir.
6 BIBLIOGRAPHY 7
[1] Yang D, Kanae S, Oki T, Koikel T, Musiake K, "Global potential soil erosion with reference to land use and climate changes.," Hydrol Process 17(14):2913–2928, 2003.
[2] Beskow S, Mello CR, Norton LD, Cur N, Viola MN, Avanzi JC, "Soil erosion prediction in the Grande River Basin, Brazil using distributed modeling.," Catena 79:49–59, 2009.
[3] S. Saha, "Water and Wind Induced Soil Erosion Assessment and Monitoring Using Remote Sensing and GIS.," Satellite Remote Sensing and GIS Applications in Agricultural Meteorology,, p. pp. 315e330, 2003.
[4] U. Kothyari, "Erosion and sediment problems in India," in Proc. of the Exeter Symposium on Erosion and Sediment Yield: Global and Regional Perspectives pp. 531e540. IAHS Publ. No. 236., July 1996. .
[5] Narayan DV, Babu R , " Estimation of soil erosion in India.," J Irrig Drain Eng , vol. 109, no. 4, p. 419–431, 1983. [6] Brady NC, Weil RC, The nature and properties of soils., New Delhi: Pearson education, , 2012.
[7] hattarai R, Duttta D B, "Estimation of soil erosion and sediment yield using GIS at catchment scale," ater Resour Manage, vol. 21, no. 10, p. 1635–1647, 2007.
Soil loss estimated for subwatersheds Sl no Sub-water
shed no
Soil loss(t/ha/y ear)
1 1 20.35
2 2 18.06
2 2 17.38
4 4 12.41
5 5 23.45
6 6 14.1
7 7 11.28
8 8 14.18
Total soil
loss(t/ha/year) 131.21 Average soil
IJEDR1703149
International Journal of Engineering Development and Research (
www.ijedr.org
)
1063
[8] Renard, K.G., Foster, G.R., Weesies, G.A., McCool, D.K. and Yoder, D.C., Predicting Soil Erosion by Water: A Guide to Conservation Planning with the Revised Universal Soil Loss Equation (RUSLE)., USDA Agricultural Handbook No. 703, 126-131., 1997.
[9] H. Kim, Soil Erosion Modeling Using RUSLE and GIS on the IMHA Watershed,, Doctoral dissertation. Colorado State University, USA., 2006.
[10] Nearing, M.A., Jetten, V., Baffaut, C., Cerdan, O., Couturier, A., Hernandez, M., Le, Modeling response of soil erosion and runoff to changes in, Catena 61, 131e154., 2005.
[11] Wischmeier, W.H. and D.D. Smith., "Predicting rainfall erosion losses: A guide to conservation planning," in Agriculture Handbook No. 537,, US Dept. of Agric., Washington, DC., 1978.
[12] Wischmeier, W.H., Smith, D.D.,, Predicting Rainfall Erosion Losses: a Guide to, Agriculture Handbook 282. USDA-ARS, USA., 1958.
[13] National Bureau of Soil Survey and Land Use Planning, " Soils of Karnataka for optimizing land use," Executive summary in co-operation with Government of Karnataka, , Bangalore., 1998.