Vascular Health and Risk Management
S H O RT R E P O RT
Dove
press
open access to scientific and medical research
Open Access Full Text Article
HbA
1c
is associated with severity of obstructive
sleep apnea hypopnea syndrome in nondiabetic men
Nikolaos Papanas1
Paschalis Steiropoulos2
Evangelia Nena2
Argyris Tzouvelekis2
Efstratios Maltezos1
Georgia Trakada2
Demosthenes Bouros2
1Outpatient Clinic of Obesity,
Diabetes and Metabolism at the 2nd Department of Internal Medicine,
2Department of Pneumonology,
Democritus University of Thrace, Alexandroupolis, Greece
Correspondence: Nikolaos Papanas Democritus University of Thrace, G Kondyli 22, Alexandroupolis 68100, Greece
Tel +30 69 7754 4337 Fax +30 25 5107 4723 Email papanasnikos@yahoo.gr
Abstract: The aim of this study was to examine the potential correlation of sleep characteristics with glucose metabolism in nondiabetic men with obstructive sleep apnea syndrome (OSAS). Included were 31 male patients (mean age 46.7 ± 11 years), recently diagnosed with OSAS by full polysomnography. There was a significant correlation of fasting glucose and glycosylated hemoglobin (HbA1c) levels with arousal index (P = 0.047 and P = 0.014, respectively). Moreover, HbA1c levels were correlated with apnea hypopnea index (P = 0.009), a widely accepted marker of the severity of OSAS, and with percentage of sleep time with saturation of hemoglobin with oxygen as measured by pulse oximetry (SpO2) 90% (t 90%) (P = 0.010). Finally, glucose and HbA1c levels showed a significant negative correlation with average SpO2 (P = 0.013 and
P = 0.012, respectively) and, additionally, glucose levels with minimum SpO2 (P = 0.027) during sleep. In conclusion, severity of OSAS among nondiabetic men is associated with increased HbA1c levels and increased fasting glucose. Thus, severity of OSAS may be an additional marker of cardiovascular risk, as well as of future diabetes, in these subjects. However, further work is needed to confirm the clinical significance of these observations.
Keywords: obstructive sleep apnea syndrome, glucose metabolism, glycated hemoglobin, sleep disordered breathing
Introduction
Obstructive sleep apnea syndrome (OSAS), a common disorder, affecting approximately 3%–7% of adult men and 2%–5% of adult women in the general population,1 is being increasingly recognized as an important cause of morbidity and
mortality.2 This clinical condition is characterized by repeated episodes of complete
or partial obstruction of the upper airway during sleep, associated with increased respiratory efforts, intermittent arterial oxygen desaturation, systemic and pulmonary arterial blood pressure alterations and sleep fragmentation. The cardinal symptoms of OSAS are nocturnal respiratory pauses, interrupted by loud snoring, and excessive daytime sleepiness.2
OSAS and type 2 diabetes mellitus (DM) are common comorbid conditions. Indeed, the prevalence of OSAS is estimated to be between 18% and 36% in subjects with type 2 DM.3,4 Vice versa, the prevalence of type 2 DM is approximately 30% in OSAS
patients.5 Several lines of evidence suggest an independent association of OSAS with
insulin resistance and DM.6–9
Ip and colleagues reported that markers of OSAS severity (Apnea Hypopnea Index [AHI] and minimum oxygen saturation) were associated with insulin resistance,6
while Punjabi and colleagues found that sleep-disordered breathing (SDB) was
Vascular Health and Risk Management downloaded from https://www.dovepress.com/ by 118.70.13.36 on 27-Aug-2020
For personal use only.
Number of times this article has been viewed
This article was published in the following Dove Press journal: Vascular Health and Risk Management
Papanas et al Dovepress
associated with insulin resistance in mildly obese but otherwise healthy males from the general population.7
Cross-sectional data from the Sleep Heart Health Study and the Wisconsin Sleep Cohort found similar results in population cohorts.8,9 However, the longitudinal data
from the Wisconsin Cohort could not demonstrate a clear relationship between SDB and the subsequent develop-ment of DM.9 Other studies in snorers have confirmed the
association of SDB and insulin resistance or diabetes in nonobese Korean and Indian males,10,11 and similar results
were found in subjects with suspected OSAS.5,12,13 In all
reports, the association was independent of obesity, even though obesity is known to increase the risk for impaired glucose tolerance. In normal subjects, hypoxia appears to be an important contributor to glucose intolerance.14 Recent
state-of-the art reviews have emphasized the need for fur-ther clinical research in this direction.15,16
Little is known so far on the association between glycemic profile and severity of OSAS in patients that do not meet the criteria for the diagnosis of diabetes. Thus, the aim of the present study was to examine the potential correlation of sleep characteristics with glucose metabolism in nondiabetic men with OSAS.
Materials and methods
Study group
Thirty one consecutive male patients, with recently diagnosed OSAS (AHI 15/hour) by polysomnography between January and June 2009, comprised the study group. Each participant was evaluated by full clinical examination and completed a detailed questionnaire about sleep habits. Exclusion criteria were: known diabetes mellitus or fast-ing glycemia (fastfast-ing glucose 126 mg/dl or glycosylated hemoglobin [HbA1c] 6.5%),17 current smoking,
cardio-vascular or cerebrocardio-vascular disease, hypertension or other chronic disease, systemic medication use, as well as previous diagnosis/treatment for OSAS. The study was approved by the Institutional Ethics Committee and all subjects gave written informed consent.
Polysomnography
Each subject underwent standard full night polysomnography (PSG). Sleep records were manually scored, according to standardized criteria.18 AHI was defined as the total number
of apneas and hypopneas per hour of electroencephalographic sleep. Arousal Index (AI) was the total number of arousals per hour of recorded sleep. OSAS was defined as an AHI of 15/hour.
Blood assays
Fasting venous blood samples were collected the day after PSG, between 8 and 9 AM, after an overnight fast. Bio-chemical analyses were performed in an ILAB 600 analyzer (Biochem, Tokyo, Japan) with enzymatic method for glucose (mg/dL) while HbA1c was measured by high-performance liquid chromatography (Adams A1c HA-8160; Arkray, Kyoto, Japan).
Statistical analysis
Analysis was performed with SPSS for Windows, version 15.0 (SPSS, Chicago, IL, USA). Normality was examined by the Kolmogorov-Smirnoff test. Descriptive results for continuous variables are expressed as mean ± SD. Regres-sion analysis was applied to explore relationships between glucose or HbA1c values and apnea-related characteristics, independently of body mass index (BMI). Statistical signifi-cance was defined at a level of 5% (P 0.05).
Results
Mean age was 46.7 ± 11 years (ranging between 28–71 years) and mean BMI was 34.8 ± 6.6 kg/m2 (ranging between 28 and
54.9 Kg/m2). Neck circumference was 44.5 ± 2.8 cm while
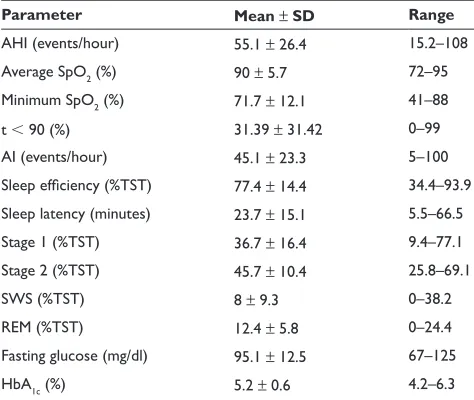
waist circumference was 119.9 ± 18.6 cm. Sleep and meta-bolic characteristics of patients are presented in Table 1.
A significant correlation between HbA1c levels and apnea-related parameters (AHI, average saturation of hemo-globin with oxygen as measured by pulse oximetry [SpO2],
Table 1 Sleep and metabolic characteristics of OSAS patients Parameter Mean ± SD Range AHI (events/hour) 55.1 ± 26.4 15.2–108
Average SpO2 (%) 90 ± 5.7 72–95
Minimum SpO2 (%) 71.7 ± 12.1 41–88
t 90 (%) 31.39 ± 31.42 0–99
AI (events/hour) 45.1 ± 23.3 5–100
Sleep efficiency (%TST) 77.4 ± 14.4 34.4–93.9 Sleep latency (minutes) 23.7 ± 15.1 5.5–66.5
Stage 1 (%TST) 36.7 ± 16.4 9.4–77.1
Stage 2 (%TST) 45.7 ± 10.4 25.8–69.1
SWS (%TST) 8 ± 9.3 0–38.2
REM (%TST) 12.4 ± 5.8 0–24.4
Fasting glucose (mg/dl) 95.1 ± 12.5 67–125
HbA1c (%) 5.2 ± 0.6 4.2–6.3
Abbreviations: AHI, Apnea Hypopnea Index; AI, Arousal Index; HbA1c, glycosylated
hemoglobin; OSAS, obstructive sleep apnea syndrome; REM, rapid eye motion; SD, standard deviation; SpO2, saturation of hemoglobin with oxygen as measured by
pulse oximetry; SWS, slow-wave sleep; TST, total sleep time.
Vascular Health and Risk Management downloaded from https://www.dovepress.com/ by 118.70.13.36 on 27-Aug-2020
HbA1c and obstructive sleep apnea hypopnea syndrome
Dovepress
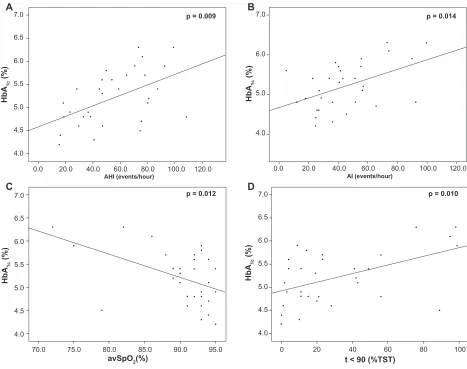
percentage of sleep time with SpO2 90%, ie, t 90, and AI) was revealed (Figure 1). Moreover, fasting glucose levels were significantly correlated with AI and average and minimum SpO2 (Figure 2). As shown in Table 2, correlations were independent of BMI.
Discussion
The present study examined the potential correlation of sleep characteristics with glucose metabolism in nondiabetic men with OSAS. Our results suggest that in nondiabetic male OSAS patients without comorbidities, the severity of OSAS (evaluated by the number of respiratory cessa-tion events, the indices of hypoxemia during sleep and the arousal index) is associated with increased fasting glucose and HbA1c levels.
The novel association of HbA1c with severity of OSAS appears interesting, and may have important implica-tions in clinical practice. Essentially, not only is HbA1c the major target for the prevention of complications in
type 2 DM,19 but it also represents a significant risk marker
for cardiovascular disease in the general population.20–22
It is, therefore, tempting to consider whether the severity of OSAS may be viewed as a risk marker for cardiovascular disease. This assumption enhances the increasing aware-ness that OSAS itself is a risk factor for cardiovascular morbidity.23 Equally importantly, HbA
1c is being
increas-ingly appreciated as a risk marker for the development of DM in the general population.24,25 Hence, the severity
of OSAS may be associated with increased risk for the development of DM. The utility of HbA1c in the prediction of diabetes in subjects with OSAS is plausible, given the association between these two conditions. However, the number of our patients is small, and further research is required to confirm our findings.
Similarly, a significant correlation was observed between fasting glucose levels and severity of nocturnal hypoxemia (evaluated by the average SpO2 and the minimum SpO2 dur-ing sleep). In view of the fact that the level of hyperglycemia
A
p = 0.009
C
B
D
p = 0.012
AHI (events/hour) AI (events/hour)
p = 0.010 p = 0.014
avSpO2(%)
HbA
1c
(%)
t < 90 (%TST)
0.0 4.0 4.5 5.0 5.5 6.0 6.5 7.0
4.0 4.5 5.0 5.5 6.0 6.5 7.0
20.0 40.0 60.0 80.0 100.0 120.0 0.0 20.0 40.0 60.0 80.0 100.0 120.0
4.0 4.5 5.0 5.5 6.0 6.5 7.0 4.0 5.0 6.0 7.0
70.0 75.0 80.0 85.0 90.0 95.0 0 20 40 60 80 100
HbA
1c
(%)
HbA
1c
(%)
HbA
1c
(%)
Figure 1 Correlations of HbA1c levels with AHI (A), AI (B), average SpO2 (C), and percentage of sleep time with SpO2 90% (D).
Abbreviations: AHI, Apnea Hypopnea Index; AI, Arousal Index; HbA1c, glycosylated hemoglobin; SpO2, saturation of hemoglobin with oxygen as measured by pulse oximetry.
Vascular Health and Risk Management downloaded from https://www.dovepress.com/ by 118.70.13.36 on 27-Aug-2020
Papanas et al Dovepress
is an established risk factor for both diabetes20,25 and
cardiovascular morbidity and mortality,20,26–28 this association
enhances the significance of the severity of OSAS as a risk factor for diabetes and vascular disease. While it is known that OSAS and impaired glucose homeostasis are inter-related,6–11 our dataset emphasizes the role of OSAS severity
in putting otherwise healthy male patients at increased car-diovascular risk.
Both fasting glucose and HbA1c exhibited a significant correlation with AI. This finding indicates that the effect of OSAS on glycemic profile was, partly at least, mediated by sympathetic nervous system activation.1,5 The latter is
a recognized mechanism underlying the pathogenesis of insulin resistance and impaired glucose metabolism in OSAS patients.2,5–8 Our data provide additional evidence for the
potential role of sympathetic overactivity in the modifica-tion of hyperglycemia in otherwise healthy individuals with OSAS.
Finally, BMI did not correlate with HbA1c levels or glu-cose levels. Hence, OSAS severity was directly associated
Table 2 Results of regression analysis Glucose levels
B ± SD Beta P
BMI 0.640 ± 0.336 0.339 0.223
AHI 0.092 ± 0.095 0.195 0.340
AI 0.196 ± 0.094 0.365 0.047
t 90 12.405 ± 7.176 0.312 0.095
Average SpO2 -0.973 ± 0.366 -0.442 0.013
Minimum SpO2 -0.419 ± 0.179 -0.410 0.027 HbA1c levels
BMI 0.000 ± 0.016 0.006 0.976
AHI 0.011 ± 0.004 0.511 0.009
AI 0.011 ± 0.004 0.448 0.014
t 90 0.877 ± 0.319 0.470 0.010
Average SpO2 -0.470 ± 0.017 -0.456 0.012
Minimum SpO2 -0.015 ± 0.09 -0.305 0.112
Abbreviations: AHI, Apnea Hypopnea Index; AI, Arousal Index; BMI, body mass index; SD, standard deviation; SpO2, saturation of hemoglobin with oxygen as
measured by pulse oximetry.
A
p = 0.340
C
B
D
p = 0.013 p = 0.027
p = 0.047
60
0.0 20.0 40.0 60.0 80.0 100.0 120.0
80 100 120
Glucose (mg/dl)
Glucose (mg/dl) Glucose (mg/dl)
Glucose (mg/dl)
60 80 100 120
AHI (events/hour)
Minimum SpO2 (%) Average SpO2 (%)
AI (events/hour)
63.0 72.0 76.0 80.0 84.0 88.0 92.0 96.0 100.0 40.0 45.0 50.0 55.0 60.0 65.0 70.0 75.0 80.0 85.0 90.0
60 80 100 120 140
60 80 100 120 140
0.0 20.0 40.0 60.0 80.0 100.0 120.0
Figure 2 Correlations of fasting glucose levels with AHI (A), AI (B), average SpO2 (C), and minimum SpO2 (D).
Abbreviations: AHI, Apnea Hypopnea Index; AI, Arousal Index; SpO2, saturation of hemoglobin with oxygen as measured by pulse oximetry.
Vascular Health and Risk Management downloaded from https://www.dovepress.com/ by 118.70.13.36 on 27-Aug-2020
HbA1c and obstructive sleep apnea hypopnea syndrome
Dovepress
with impaired glucose metabolism independently of obesity. This result agrees with studies showing that SDB is associated with glucose intolerance and insulin resistance independently of BMI.8,9,12,13 The role of SDB is enhanced by evidence
showing that experimental hypoxia directly causes glucose intolerance.14 However, other workers advocate an important
role for central obesity in impaired glucose metabolism, and so recent state-of-the art reviews highlight the need for further clarification.15,16 In the type of subjects herein
examined, OSAS severity appears to outweigh obesity, as demonstrated by its direct association with impaired glucose metabolism.
Notably, this study excluded women, in order to avoid potential discrepancies between the two genders. Indeed, there is evidence of a different effect of sleep apnea on metabolic profile and on inflammatory response in women, partly at least due to different hormonal regulation.1,29 For
this reason, the correlations found need to be investigated in women as well.
The limitations of the present report include the small number of patients and the cross-sectional design. Based on our findings, it is plausible to propose that risk factors for diabetes and vascular disease in otherwise healthy OSAS patients may be identified in association with OSAS severity. Nonetheless, there is no prospective data to confirm that this risk translates into worse outcome in actual clinical practice. Such follow-up was beyond the scope of this study, and further prospective research is needed to provide a definite answer.
In conclusion, among nondiabetic men with OSAS, the severity of this condition is associated with increased HbA1c levels and increased fasting glucose. Thus, the severity of OSAS may be an additional marker of cardiovascular risk as well as of future diabetes in these subjects. Nevertheless, the clinical significance of our observations remains to be confirmed by prospective studies.
Disclosures
The authors report no conflicts of interest in this work.
References
1. Punjabi NM. The epidemiology of adult obstructive sleep apnea. Proc
Am Thorac Soc. 2008;15(2):136–143.
2. McNicholas WT, Bonsigore MR. Sleep apnoea as an independent risk factor for cardiovascular disease: current evidence, basic mechanisms and research priorities. Eur Respir J. 2007;29(1):156–178.
3. West SD, Nicoll DJ, Stradling JR. Prevalence of obstructive sleep apnoea in men with type 2 diabetes. Thorax. 2006;61(11):945–950. 4. Einhorn D, Stewart DA, Erman MK, Gordon N, Philis-Tsimikas A,
Casal E. Prevalence of sleep apnea in a population of adults with type 2 diabetes mellitus. Endocr Pract. 2007;13(4):355–362.
5. Meslier N, Gagnadoux F, Giraud P, et al. Impaired glucose-insulin metabolism in males with obstructive sleep apnoea syndrome. Eur
Respir J. 2003;22(1):156–160.
6. Ip MS, Lam B, Ng MM, Lam WK, Tsang KW, Lam KS. Obstructive sleep apnea is independently associated with insulin resistance. Am J
Respir Crit Care Med. 2002;165(5):670–676.
7. Punjabi NM, Sorkin JD, Katzel LI, Goldberg AP, Schwartz AR, Smith PL. Sleep-disordered breathing and insulin resistance in middle-aged and overweight men. Am J Respir Crit Care Med. 2002;165(5):677–682.
8. Punjabi NM, Shahar E, Redline S, Gottlieb DJ, Givelber R, Resnick HE. Sleep-disordered breathing, glucose intolerance, and insulin resis-tance: the Sleep Heart Health Study. Am J Epidemiol. 2004;160(6): 521–530.
9. Reichmuth KJ, Austin D, Skatrud JB, Young T. Association of sleep apnea and type II diabetes: a population-based study. Am J Respir Crit
Care Med. 2005;172(12):1590–1595.
10. Shin C, Kim J, Lee S, et al. Association of habitual snoring with glucose and insulin metabolism in nonobese Korean adult men. Am J Respir
Crit Care Med. 2005;171(3):287–291.
11. Udwadia ZF, Doshi AV, Lonkar SG, Singh CI. Prevalence of sleep-disordered breathing and sleep apnea in middle-aged urban Indian men. Am J Respir Crit Care Med. 2004;169(2):168–173.
12. Tassone F, Lanfranco F, Gianotti L, et al. Obstructive sleep apnoea syndrome impairs insulin sensitivity independently of anthropometric variables. Clin Endocrinol (Oxf). 2003;59(3):374–379.
13. Makino S, Handa H, Suzukawa K, et al. Obstructive sleep apnoea syndrome, plasma adiponectin levels, and insulin resistance. Clin
Endocrinol (Oxf). 2006;64(1):12–19.
14. Oltmanns KM, Gehring H, Rudolf S, et al. Hypoxia causes glucose intolerance in humans. Am J Respir Crit Care Med. 2004;169(11): 1231–1237.
15. Tasali E, Mokhlesi B, Van Cauter E. Obstructive sleep apnea and type 2 diabetes: interacting epidemics. Chest. 2008;133(2):496–506. 16. Shaw JE, Punjabi NM, Wilding JP, et al. Sleep-disordered breathing
and type 2 diabetes: a report from the International Diabetes Federation Taskforce on Epidemiology and Prevention. Diabetes Res Clin Pract. 2008;81(1):2–12.
17. International Expert Committee. International Expert Committee report on the role of the A1C assay in the diagnosis of diabetes. Diabetes Care. 2009;32(7):1327–1334.
18. American Academy of Sleep Medicine (AASM). International
Clas-sification of Sleep Disorders. Westchester, IL: AASM; 2005.
19. Stratton IM, Adler AI, Neil HA, et al. Association of glycaemia with mac-rovascular and micmac-rovascular complications of type 2 diabetes (UKPDS 35): prospective observational study. BMJ. 2000;321(7258):405–412. 20. De Vegt F, Dekker JM, Ruhe HG, et al. Hyperglycaemia is associated
with all-cause and cardiovascular mortality in the Hoorn population: the Hoorn Study. Diabetologia. 1999;42(8):926–931.
21. Khaw KT, Wareham N, Bingham S, Luben R, Welch A, Day N. Asso-ciation of hemoglobin A1c with cardiovascular disease and mortality in adults: the European prospective investigation into cancer in Norfolk.
Ann Intern Med. 2004;141(6):413–420.
22. Khaw KT, Wareham N. Glycated hemoglobin as a marker of cardio-vascular risk. Curr Opin Lipidol. 2006;17(6):637–643.
23. Thurnheer R. Obstructive sleep apnea and cardiovascular disease – time to act! Swiss Med Wkly. 2007;137(15–16):217–222.
24. Edelman D, Olsen MK, Dudley TK, Harris AC, Oddone EZ. Utility of hemoglobin A1c in predicting diabetes risk. J Gen Intern Med. 2004;19(12):1175–1180.
25. Inoue K, Matsumoto M, Kobayashi Y. The combination of fasting plasma glucose and glycosylated hemoglobin predicts type 2 diabetes in Japanese workers. Diabetes Res Clin Pract. 2007;77(3):451–458. 26. Beks PH, Mackaay AJ, de Vries H, de Neeling JN, Bouter LM,
Heine RJ. Carotid artery stenosis is related to blood glucose level in an elderly Caucasian population: the Hoorn Study. Diabetologia. 1997;40(3):290–298.
Vascular Health and Risk Management downloaded from https://www.dovepress.com/ by 118.70.13.36 on 27-Aug-2020
Vascular Health and Risk Management
Publish your work in this journal
Submit your manuscript here: http://www.dovepress.com/vascular-health-and-risk-management-journal
Vascular Health and Risk Management is an international, peer-reviewed journal of therapeutics and risk management, focusing on concise rapid reporting of clinical studies on the processes involved in the maintenance of vascular health; the monitoring, prevention and treatment of vascular disease and its sequelae; and the involvement of
metabolic disorders, particularly diabetes. This journal is indexed on PubMed Central and MedLine. The manuscript management system is completely online and includes a very quick and fair peer-review system, which is all easy to use. Visit http://www.dovepress.com/ testimonials.php to read real quotes from published authors.
Papanas et al Dovepress
Dove
press
27. Beks PJ, Mackaay AJ, de Neeling JN, de Vries H, Bouter LM, Heine RJ. Peripheral arterial disease in relation to glycaemic level in an elderly Caucasian population: the Hoorn study. Diabetologia. 1995;38(1): 86–96.
28. Premalatha G, Shanthirani S, Deepa R, Markovitz J, Mohan V. Preva-lence and risk factors of peripheral vascular disease in a selected South Indian population: the Chennai Urban Population Study. Diabetes Care. 2000;23(9):1295–1300.
29. Miller MA, Kandala NB, Kivimaki J, et al. Gender differences in the cross-sectional relationships between sleep duration and markers of inflammation: Whitehall II Study. Sleep. 2009;32(7):857–864.
Vascular Health and Risk Management downloaded from https://www.dovepress.com/ by 118.70.13.36 on 27-Aug-2020