Top properties in
t
t
¯
events at CMS (includes mass)
V. Adler1,a b
1Universiteit Gent, Department of Physics and Astronomy, Proeftuinstraat 86, B-9000 Gent, Belgium
Abstract.Selected results from the following topics are presented: Measurements of several top quark proper-ties are obtained from the CMS data collected in 2011 at a center-of-mass energy of 7 TeV. The results include measurements of the top quark mass, the W helicity in top decays, the top quark charge, and of thett¯spin correlation and the search for anomalous couplings.
1 Introduction
As the heaviest particle in the Standard Model, the top quark is a unique probe for the model’s validity. Due to its very high massmtit decays rapidly before hadronization
and thus allows for precise measurements of its proper-ties. Possible deviations from Standard Model predictions can give rise to new physics beyond the Standard Model (BSM) like e.g. anomalous couplings or the existence of Supersymmetry (SUSY).
The Large Hadron Collider (LHC) at CERN [1] col-lides protons at center-of-mass energies of several TeV, which increases the production rate of heavy particles sig-nificantly compared to former colliders. In particular, the cross sections for top quark pair production [2] together with the collision rate allow to refer to the LHC as “top quark factory”.
The CMS detector [3] is a multi-purpose detector at the LHC. All analyses described here have been performed using data collected with the CMS detector during the 2011 data taking period with proton-proton collisions at a center-of-mass energy of 7 TeV, which amounts to an in-tegrated luminosity of 5 fb−1in total.
2 The Mass of the Top Quark
Measurements ofmt are performed using various decay
channels of tt¯ pairs with different analysis techniques, which are presented in Sects. 2.1–2.4, followed by the CMS top quark mass combination in Sect. 2.5. A mea-surement of the mass difference between top and anti-top quarks is described in Sect. 2.6.
2.1 Measurement intt¯Events with Dilepton Final States
A measurement of mt is performed with events in the
dileptonic decay channelsee,µµandeµ[4]. Candidatett¯
aSpeaker, on behalf of the CMS Collaboration. be-mail: volker.adler@cern.ch
events are selected with two isolated, oppositely charged leptons with high transverse momentum pt and two or
more jets, where at least one has to be identified as origi-nating from ab-quark (b-tagged).
Including constraints on the W-boson mass and the equality of the masses of top and anti-top quark, still one parameter in the reconstruction oftt¯events remains free in these decay channels. This parameter needs to be con-strained by imposing an additional hypothesis. In this analysis, the mass of the top quarks is reconstructed using an improved Matrix Weighting Technique [5], the Analyti-cal Matrix Weighting Technique (AMWT). Instead of sim-ply using the two leading jets in the reconstruction, leading b-tagged jets are considered first and supplemented by the leading untagged jets then if necessary. This increases the fraction of correct jet assignments significantly. As addi-tional constraint a hypothesis onmtitself is used. The
re-constructed massmAMWT per event is then the hypothetical
mass giving the highest event weight, which is computed from a probability density and takes resolution effects into account.
Finally, likelihoods for values ofmtbetween 161.5 and
184.5 GeV are computed from the distributions ofmAMWT,
and the mass value maximizing the likelihood is fitted. The top quark mass is measured to be
mt=172.5±0.4 (stat.)±1.5 (syst.) GeV
with the dominant systematic effects coming from the jet energy scales (JES). This is the most precise measurement ofmtin the dilepton channel to date.
2.2 Measurement intt¯Events with Lepton+Jets Final States
The presented analysis measures mt in the semileptonic
decay channels with an electron or muon in the final state [6]. Events with exactly one isolated lepton with high pt
and at least four or more jets are selected, where at least two have to beb-tagged.
C
Owned by the authors, published by EDP Sciences, 2013
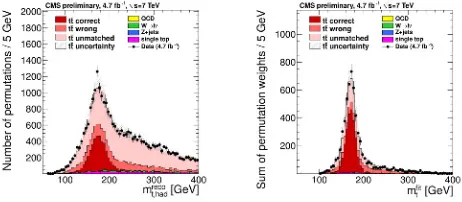
Figure 1.Reconstructed top quark masses, prior to kinematic fit-ting(left)and after fitting, goodness-of-fit selection and weight-ing by Pgo f (right). Top quarks are simulated with mt =
172.5 GeV.
Figure 2.The 2D likelihood (−2δlog(L)) measured for thel+jets final state. The ellipses correspond to statistical uncertainties onmt
and JES of one, two and three standard deviations.
Using constraints on theW-boson mass and the equal-ity of the masses of top and anti-top quark, it is gener-ally possible to fully reconstruct the tt¯system for each event. This is done here by a kinematic fit, which is spe-cialized for the semileptonic event topology [7]. The mea-surement is then performed using the ideogram method, where the results from the kinematic fits of all possible jet combinations are considered, weighted by the goodness-of-fit probabilityPgo f. Only fit results withPgo f ≥0.2 are
taken into account. The effect of the kinematic fit and the weighting is illustrated in Fig. 1.
Likelihoods for the reconstructed W-boson and top quark masses are evaluated from analytic expressions ob-tained using simulation. This is done in a two-dimensional (2D) grid of hypotheses formtand JES, which provides a
simultaneous measurement of the JES forlightjets from the well known mass of theW-boson. The 2D likelihood distribution is show in Fig. 2. Its minimization yields a top quark mass of
mt=173.49±0.43 (stat.+JES)±0.98 (syst.) GeV
and a JES of
JES =0.994±0.003 (stat.)±0.008 (syst.).
This is the most precise single measurement of the top quark mass to date. After the elimination of the JES for light jets as dominant systematic uncertainty, the JES for b-jets and color reconnection effects become most impor-tant.
2.3 Measurement intt¯Events with All-Jets Final States
The measurement ofmt in the all-hadronic final state [8]
uses a similar combination of kinematic fit and ideogram method as in the semi-leptonic channel in Sect. 2.2. Events with at least six jets are selected, where at least two jets are required to be b-tagged. Compared to the semi-leptonic channel, a different fitting technique is utilized [9], and jet combinations with Pgo f ≥ 0.09 are accepted. In this
case, the simultaneous determination of the JES does not improve the precision of the measurement due to the in-creased influence of other effects. Using a JES fixed at unity, the one-dimensional (1D) likelihood is minimized for a top quark mass of
mt=173.49±0.69 (stat.)±1.25 (syst.) GeV,
with the JES as dominant systematic uncertainty.
2.4 Measurement intt¯Events with Kinematic Endpoints
In the presence of invisible particles in a decay chain, the mass of the decaying particle cannot be reconstructed di-rectly, but assumptions have to be added as constraints to the kinematic equations to substitute the missing observ-ables. However, using only the visible kinematics in the reconstruction still would result in the correct mass in the extreme case of the invisible particles carrying zero mo-mentum. At collider experiments, transverse mass distri-butions can be extrapolated to this extreme case, the kine-matic endpoint.
The analysis presented here is performed in the dilep-ton channel [10], selecting events with two isolated, oppo-sitely charged leptons with highpT, twob-tagged jets and
high missing transverse energyEmissT . Two specially de-signed transverse mass expressionsMT2⊥and the invariant mass of a lepton and ab-jetMblare evaluated, where the
endpoints of the distributions depend onmt. An unbinned
likelihood fit to the endpoint regions of the correspond-ing distributions in data with predefined signal and back-ground shapes determines the mass value. The best pre-cision is achieved with the neutrino andW-boson masses constrained, where only one of the MT2⊥ is used. Fig. 3 shows the fitted distributions. With this technique, the top quark mass is measured as
mt=173.9±0.9 (stat.)+−11..28(syst.) GeV.
2.5 Mass Combination
The combination of various measurements ofmtpresented
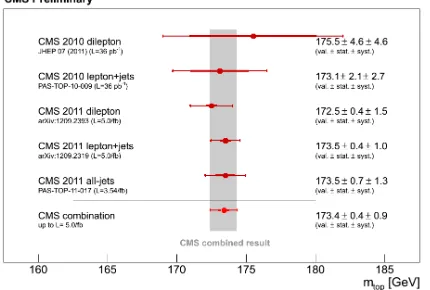
here [11] uses the measurements described in Sects. 2.1– 2.3 and measurements performed with data collected in 2010 [12]. The individual measurements are combined us-ing the Best Linear Unbiased Estimator (BLUE) method [13]. The combination yields
mt=173.36±0.38 (stat.)±0.91 (syst.) GeV.
Figure 3.Doubly constrained simultaneous fits ofmt, using one MT2⊥ (left)and Mbl (right). The red lines are the full fit, and
the blue and green curves represent the background and signal shapes, respectively. The inset shows a zoom of the tail region of the right distribution.
Figure 4.Summary of CMSmtmeasurements and their
combi-nation.
2.6 Measurement of the Mass Difference between Top and Anti-Top Quarks
In order to determine a possible mass difference between top and anti-top quark∆mt = mt −mt¯, semileptonic tt¯
events are selected similarly to the mt measurement
de-scribed in Sect. 2.2 [14]. A kinematic fit constrained by the W-boson mass is applied only to the hadronic part of each jet combination, and the masses are determined with the ideogram method, but separately for each recon-structed lepton charge. Masses from events with positively (negatively) charged lepton are assigned to the top (anti-top) quark. The difference between the two mass values is found to be
∆mt=−0.44±0.46 (stat.)±0.27 (syst.),
which is consistent with 0. The systematic uncertainty re-mains small, since many significant uncertainties cancel in the measurement of a massdifference.
3 Properties of the Top Quark
3.1 First Measurement ofB(t→Wb)/B(t→Wq)in the Dilepton Channel
In the Standard Model, the magnitude of the Cabibbo-Kobayashi-Maskawa (CKM) matrix element |Vtb| is
ex-Figure 5.Variation of the profile likelihood used to extractRfrom data. The variation observed in the exclusive dilepton channels is depicted by the dashed lines. The inset shows the inclusiveb-tag multiplicity distribution and the result of the fit.
pected to be close to unity, so that the top quark should decay into aW-boson and ab-quark almost exclusively. A deviation from this prediction could be a hint for a fourth quark generation.
A measurement of the branching fraction ratio R = B(t → Wb)/B(t → Wq) is performed in the dileptonic channel [15]. The number of expectedb-tags per event is modeled as a function of R for different event cate-gories, and its most likely value is found after maximizing a binned likelihood function using that model and the ob-servation from data. The inclusive likelihood is shown in Fig. 5. In this analysis, a branching fraction ratio of
Robs=0.98±0.04 (stat.+syst.)
is observed, which is in agreement with Standard Model predictions. The systematic uncertainties are dominated by theb-tagging efficiency uncertainty and the uncertainty on the fraction of correct jet assignments.
With the constraint R ≤ 1, a 95% C.L. interval of 0.85≤R≤1.0 is determined.
3.2 Search for Flavor Changing Neutral Currents in Top Quark Decays
The branching fraction for flavor changing neutral current (FCNC) decays of the top quark (t → Zq) is expected to be extremely small. However, some BSM scenarios like e.g. R-parity violating SUSY predict measurable enhance-ments.
A search for FCNC in top quark decays is presented, which is performed using an event topology with three lep-tons from the decay chaintt¯→Zq+Wb→llq+lνb, where lcan beeorµ[16]. Events with three isolated leptons with highpT, at least two jets and a highEmissT are selected. In
addition, the scalarpTsumSTis required to be larger than
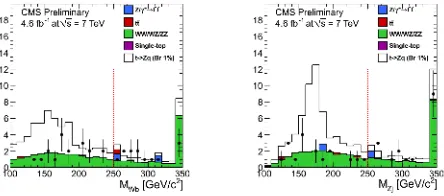
250 GeV, and the reconstructed top quark masses have to be within 100 and 250 GeV. The corresponding mass dis-tributions are shown in Fig. 6. No deviation from the Stan-dard Model is found and an observed upper limit at 95% C.L. onB(t→Zq) of 0.21% is determined, where 0.40% have been expected. A more stringent event selection us-ingb-tags instead ofST confirms this result.
3.3 Constraints on the Top Quark Charge fromtt¯ Events
Figure 6. Comparison between data and simulation of themWb (left)andmZ j(right)distributions after the basic event selection.
The open histogram shows the expected signal forB(t→Zq)=
1%. The red dotted lines show the boundaries of the allowed mass region.
Figure 7.Left: Charge assigned to the top quark in the selectedt¯t
events. Data are compared to the Standard Model prediction with its statistical uncertainty represented by the shaded area.Right: Probability function of the asymmetry obtained from pseudo-experiments for the Standard Model and the exotic hypothesis.
Semileptonic events with muons are selected, with two of the four jets beingb-tagged. Using the best approx-imation to the top quark mass, the taggedb-jets are as-signed to either the leptonically or hadronically decaying top quark. In the presence of a soft muon in at least on of theb-jets, the charge of bothb-quark can be determined. The charge of the leptonically decaying top quark is calcu-lated asqt=qµ+qb, whereqµis the reconstructed charge of the isolated muon andqbthe charge determined for the b-jet assigned to this decay branch. The resulting charge distribution is shown in Fig. 7 on the left.
The agreement with the Standard Model is tested with a normalized asymmetry, which is expected to be+1(-1) for the Standard Model (exotic model) hypothesis. The measured asymmetry
A=0.97±0.12 (stat.)±0.31 (syst.)
is in agreement with the Standard Model. The measure-ment is compared to pseudo-experimeasure-ments in Fig. 7 on the right.
3.4 WHelicity intt¯Events
The Standard Model predicts helicity fractions for left-handed, right-handed and longitudinalW-bosons from top quark decays,FL,FR andF0. Deviations from these
pre-dictions can be interpreted in terms of anomalousWtb cou-plings.
Figure 8. Left: Thecos(θ∗) distribution, from where theW
he-licity fractions are obtained. Thett¯sample is additionally scaled by a factor of about 10%. Right: Limits on the real components of the anomalous couplingsgLandgR.
A measurement of the helicity fractions is performed in the semileptonic decay channel with muons [18]. Thett¯ system is fully reconstructed with a kinematic fit and the helicity angleθ∗is extracted. This angle is defined as the angle between the muon three-momentum in the rest frame of its parentW-boson and theW-boson’s three-momentum in the rest frame of its parent top quark. The resulting distribution is shown in Fig. 8 on the left.
The dependency
1 Γ
dΓ dcosθ∗ =
3
8(1−cosθ ∗
)2FL+
3
8(1+cosθ ∗
)2FR+
3 4sin
2θ∗F
0
allows to determine the helicity fractions by minimizing a Poisson likelihood. All results are in agreement with the Standard Model, and limits on the anomalous coupling constantsgL andgR can be set, as illustrated in Fig. 8 on
the right.
3.5 Measurement of Spin Correlations intt¯ Production
Since the top quark decays before hadronization, its spin is transferred to its decay products and thus become exper-imentally accessible. Measuring the spin correlations intt¯ events probes perturbative QCD at the production vertex.
The analysis presented here uses events in the dilep-tonic decay channelsee,µµandeµ[19]. In this topology, the angular difference in the azimuthal plane between the two leptons∆φl+l−=|φl+−φl−|is sensitive to the spin
cor-relations.
The spin correlation coefficient is determined by a simultaneous template fit to the ∆φl+l− distributions in
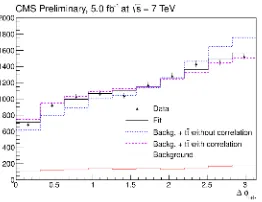
each decay mode. Templates are considered fortt¯events with and without spin correlations at next-to-leading or-der (NLO) and background events, individually for each channel. The combined fit result is depicted in Fig. 9. The measurement obtains a spin correlation coefficient in the helicity basis of
Ameashel =0.24±0.02 (stat.)±0.08 (syst.),
which is in agreement with the Standard Model expecta-tion ofAS M
hel =0.31 from NLO calculations. This
Figure 9. Result of the fit performed on data after the combi-nation of the three channels. The hypotheses with and without spin correlations are also shown, including the background com-ponent.
Figure 10.
Background-subtracted and unfoldedcos(θ)+
l distribution
compared to the parton level distribution from the used Monte Carlo generator. The error bars represent the statistical uncertainties. The bin values are correlated due to unfolding.
3.6 Measurement of the Top Quark Polarization in the Dilepton Final State
The dileptonic final states withee,µµandeµare also used to measure the polarization of the top quark [20]. The top quark’s polarization along a given axis ˆncan be extracted from the asymmetry
Pn=
N(cos(θ+l)>0)−N(cos(θ+l)<0)
N(cos(θ+
l)>0)+N(cos(θ
+
l)<0)
,
whereθ+
l is the production angle of the positively charged
lepton in the rest frame of its parent top quark with respect to the direction of the parent top quark in the rest frame of thett¯system. In this measurement, the background-subtracted data distribution is corrected to parton level us-ing a regularized unfoldus-ing procedure. The result of the unfolding is shown in Fig. 10. The extracted polarization of
Pn=−0.009±0.029 (stat.)±0.041 (syst.)
is in agreement with the Standard Model prediction as im-plemented in the used Monte Carlo event generator.
4 Conclusions
The high production rate of top quarks at the LHC al-lows for precision measurements of the quark’s properties.
The CMS experiment has performed measurements of top quark properties, using data from proton-proton collisions at a center-of-mass energy of 7 TeV.
The top quark mass is measured to high precision as
mt=173.36±0.38 (stat.)±0.91 (syst.),
and the mass difference between top and anti-top quark is compatible with 0.
All measurements of couplings, charge or spin related properties are in agreement with Standard Model predic-tions.
References
[1] L. Evans, (ed.) and P. Bryant, (ed.), JINST3 (2008) S08001.
[2] N. Kidonakis, Phys. Rev. D 82 (2010) 114030 [arXiv:1009.4935 [hep-ph]].
[3] CMS Collaboration, JINST3(2008) S08004. [4] CMS Collaboration, Eur. Phys. J. C 72(2012) 2202
[arXiv:1209.2393 [hep-ex]].
[5] D0 Collaboration, Phys. Rev. Lett. 80 (1998) 2063 [hep-ex/9706014]; CDF Collaboration, Phys. Rev. Lett.
80(1998) 2779 [hep-ex/9802017].
[6] CMS Collaboration, JHEP 1212 (2012) 105 [arXiv:1209.2319 [hep-ex]].
[7] D0 Collaboration, Phys. Rev. D 58 (1998) 052001 [hep-ex/9801025].
[8] CMS Collaboration, CMS-PAS-TOP-11-017. [9] J. D’Hondt, S. Lowette, O. L. Buchmuller, S.
Cuccia-relli, F. P. Schilling, M. Spiropulu, S. Paktinat Mehdia-badi and D. Benedettiet al., CERN-CMS-NOTE-2006-023.
[10] CMS Collaboration, CMS-PAS-TOP-11-027. [11] CMS Collaboration, CMS-PAS-TOP-11-018. [12] CMS Collaboration, JHEP 1107 (2011) 049
[arXiv:1105.5661 [hep-ex]]; [CMS Collaboration], CMS-PAS-TOP-10-009.
[13] L. Lyons, D. Gibaut and P. Clifford, Nucl. Instrum. Meth. A270(1988) 110.
[14] CMS Collaboration, JHEP 1206 (2012) 109 [arXiv:1204.2807 [hep-ex]].
[15] CMS Collaboration, CMS-PAS-TOP-11-029. [16] CMS Collaboration, Phys. Lett. B718(2013) 1252
[arXiv:1208.0957 [hep-ex]].