Helgol~inder wiss. Meeresunters. 30, 582-597 (1977)
The structure of the plankton community of the
Oregrundsgrepen (southwest Bothnian Sea)
S. ER~KSSON, C. S~LLEI & K. WALLSTR6M
Institute of Zoology, Uppsala University; Uppsala, SwedenABSTRACT: Taxonomic composition and variations in density and biomass of the plankton community in the Oregrundsgrepen, a shallow coastal area, were investigated from June 1972 to November 1973. The phytoplankton biomass was large in spring but small during the rest of the year. The spring bloom was dominated by diatoms and dinoflagellates, especially by Thalassiosira spp. which were also important during other seasons. Small forms, such as Cryptornonas spp., Rhodomonas spp. and monads, dominated during summer. Blue-green algae were never of any major importance. During the summer, the trophogenic layer exceeded 10 m in thickness. The metazoan fauna was of lower diversity than the plankton flora. The domi- nating species, the eopepods Acartia bifilosa and Eurytemora affinis, constituted on the average 83 % of the standing crop. The low salinities, 5-6 ~ S, were regarded as the principal perti- nent limiting factor. The metazoan fauna reached large biomass values from July to October. The protozoan fauna (in the case of ciliates), obtained biomass maxima during the spring bloom. It is suggested that the Oregrundsgrepen represents an area of elevated productivity within a region of low overall production, presumably due to local upwelling. From June 1972 to May 1973, the average biomasses were: phytoplankton 0.464 g C m -~, ciliates 0.040 g C m -2, copepod nauplii 0.010 g C m -~, micro-rotifers 0.004 g C m -2, and mesozooplankton (larger than 0.2 ram) 0.312 g C m -~. It is estimated that about than 60 ~ of the phytoplankton pro- duction is consumed by the microzooplankton ( < 0.2 mm).
I N T R O D U C T I O N
Much interest is being placed on studies of the energy flow through different parts of the marine ecosystem. Of great significance are the dynamics of the earlier steps in the food chains, i.e. within the phyto- and zooplankton. This paper deals with the structure of the plankton community from June 1972 to November 1973 in a shallow coastal area in the southwest Bothnian Sea, the ~regrundsgrepen (Fig. 1). Special emphasis has been placed on long series of intensive sampling at one easily accessible station, several samples on every sampling occasion, and a thorough taxonomical analysis of the biocoenosis. The relative importance of micro- and mesozooplankton was regarded of particular interest. It is hoped that this study will provide useful information for future modelling work on the Baltic ecosystem.
Plankton community 583
Fig. 1: The Uregrundsgrepen. Sampling Station 128 is located in the channel coming from the Bothnian Sea over a depth of 45 m. Inset: Subvivisions of the Baltic, (1) Bothnian Bay, (2) Bothnian Sea, (3) Gulf of Finland, (4) Baltic proper. The rectangle denotes the investigation
a r e a
lin (1934), and Lindquist (1959). Data on primary production and/or phytoplankton biomass may also be obtained from Schnese (1969), Bagge & Lehmusluoto (1971), Fonselius (1972), and Ackefors & Lindahl (1975a, 1975b). Separate zooplankton taxa have been dealt with by some authors;
Limnocalanus grimaldi
De Guerne ( = L.macrurus)
has been investigated by Lindquist (1961) andEurytemora
sp.(= E. affinis)
by Hernroth. Pejler (1972) reported on the rotifer fauna of sheltered bays.STUDY AREA
584 S. Eriksson et al.
The lJregrundsgrepen is influenced by a main system of currents of brackish water giving a stable salinity of 5 to 6 0/00 S. However, winds may modify the situation. The predominant winds are SE and NW. The former wind direction causes lower temperature and the latter higher temperature and somewhat less saline water. Winds from the SW give rise to upwellings along the mainland. During the summer, rapid temperature change indicates mobility of the water mass. During the investigation period there was a temperature stratification at Station 128 from May to September (Fig. 2). The surface temperature may exceed 18 ~ C in July and August. The coldest month was March with 1~ C in the whole water column. As a result of the mild winter 1972-1973, the area was only occasionally covered by thin ice from December to March.
I97Z 20-
I
0
J I A I O I I D 1973
I F I I A I
9 , | 0 r n
x IZ5rn
I j I i A I I 0 1
Fig. 2. Temperature curves for Station 128, June 1972-November 1973
The bottom topography of the investigation area is rather complicated with a depth less than 10 m (Fig. 1). A deeper channel stretches in along Gr~is~5 Island from the Bothnian Sea which is here about 50 m deep. The channel becomes increasingly shallow and is only 20 m deep off the town of Dregrund. The sampling station (Station 128) is located in this channel over a depth of 45 m.
The field samplings were usually made twice a month during 1972 and three times a month during 1973. All samples were collected at full daylight.
Plankton community 585
Metazoan plankton was sampled with a Nansen net with a mouth diameter of 50 cm, mesh size .09 mm, and a Tsurumi flow meter mounted at tt~e centre of the mouth. The filtering efficiency of the net was 40 + 9
%
(x + s). On each sampling occasion 4 vertical hauls were made from a depth of 40 m to the surface. In the laboratory, they were diluted to 1500 ml and 5 subsamples of 15 ml were examined. For samples with small numbers of metazoan plankton the dilution was only 250 to 500 ml.Biovolumes were calculated by multiplying the numerical density of each taxon by standard figures on volume of the whole organism. No corrections were made for vacuoles, empty volumes in thecae etc. Phytoplankton values were obtained from Melvasalo (unpublished) and Hobro (unpublished) and metazoan plankton from the Water Conservation Laboratory, Helsinki, Finland (unpublished). Supplementary measurements were made on some phytoplankton taxa and all protozoan plankton t a x a .
RESULTS
C o m p o s i t i o n o f t h e p l a n k t o n c o m m u n i t y
The separate taxa into which the biocoenosis have been divided are listed in Table 1. Small flagellated algae which were impossible to diagnose in preserved con- dition have been collected under the heading "monads". For taxonomical remarks on the plankton fauna reference should be made to Eriksson (1973b). Two subspecies of
KeratelIa quadrata
have been recorded, viz.K. quadrata quadrata
in cold water from January to May andK. quadrata platei
in warmer water during the rest of the year. Since many authors regard as significant the occurrence of these two subspecies, a special study is needed to find out whether they are true subspecies or only an example of cyclomorphosis.Tables 1 and 2 illustrate that the diversity of the plankton flora is considerably larger than that of the plankton fauna.
S e a s o n a l d i s t r i b u t i o n s
The density is given as the number of cells m -a for all phytoplankton and protozoan plankton taxa except for the filamentous species
Aphanizornenon flos-
aquae.
The metazoan plankton taxa are presented as the number of specimens m -3.Aphanizornenon flos-aquae
reached its highest density during September-Octo- ber in 1972 (Fig. 3). During 1973 the species appeared earlier and reached its peak densities somewhat earlier. The figures were considerably higher in 1973.586 S. Eriksson et al. Table 1
Composition of the plankton community
Phytoplankton
C y a n o p h y t a
Aphanizomenon flos-aquae (L.) Ralfs. C h l o r o p h y t a
Pyramimonas sp. Oocystis lacustris Chod. O. subrnarina Lagerh. Ankistrodesmus spp. Scenedesmus sp. C h r y s o p h y t a Chrysomonadales
Ebria tripartita (Schum.) Lemm. Diatomae
Thalassiosira baltica (Grun.) Ostenf. Thalassiosira spp.
Chaetoceros danicus Cleve C. holsaticus Sch~itt C. miitlerii Lemm. C. wighamii Brig. Chaetoeeros spp.
Seeletonema costatum Grey. Melosira attica Ehrenb. M. jiirgensii Agh. Melosira spp. Achnantes sp. Synedm spp. Epithemia spp.
Rhizosolenia minima Lev. Diatoma elongatum (Lyngb.) Agh. Lichmophora gracilis (E.) Grun. Rhoicosphaenia eurvata (Kiitz) Grun. TabelIaria fenestrata (Lyngb.) Kiitz. T. flocculosa (Roth.) Ktitz.
P y r r h o p h y t a Cryptophycales Cryptomonas spp. Rhodomonas spp. Dinophycales Katodinium sp.
Dinophysis acuminata Chap. et Lachm. D. battica Ko~:. et Skbg.
D. norvegica Chap. et Lachm.
Phalacroma rotundatum (Chap. et Lachm.) Kof. et Mich.
Prorocentrum micans Ehrenb. Gonyaulax Catenata (Lev.) Kof.
Peridinium triquetrum Stein P. minusculum Pavil. Peridinium spp. Glenodinium spp.
Gymnodinium fungiforme Assim. Gymnodinium spp.
Amphidinium longum Lohm. Amphidinium spp.
Monads
Zooplankton
T i n t i n n i d a
Codonella cratera Leidy Leprotintinnus bottnicus Nordqv. Tintinnopsis beroidea Stein T. brandti Nordqv. T. tubulosa Lev.
" N o n - l o r i c a t e C i l i a t a " Strombidium spp.
LohmannieUa spp. Mesodinium sp. Cothurnia spp. Ciliata spp.
Metazoan plankton
R o t a t o r i a
Keratella eochlearis recurvispina (J~.gersk~51d) K. quadrata quadrata (Mi]ller)
K. quadrata platei (J~igersk61d) K. cruciform# eichwaldi (Lev.) Synchaeta spp.
C r u s t a c e a
Limnocalanus macrurus (Sars) Eurytemora affinis Poppe Acartia bililosa Giesbrecht Cyclopoida spp.
Harpacticoida spp.
Bosmina coregoni maritima (P. E. Mi~ller) Podon intermedius (Lilljeborg)
Pleopis polyphemoides (Leuckart) Evadne nordmanni (Lov6n) Ostraeoda spp.
Balanus improvisus Darwin Bivalvia spp.
Gastropoda spp. Polychaeta spp.
Ebria tripartita may reach peak densities from June to September. The species did not reach high abundance levels.
Plankton community 587
spp. were found during the whole investigation period although the former genus was considerably more numerous. S. costatum was scarce or non-existent after the spring bloom. Other diatoms appeared only in low densities.
Cryptornonas spp. and Rhodornonas spp. occurred in high densities during the whole investigation period. Abundance peaks were reached between July and Novem- ber. The density was highest during 1973.
CelLskl06x m~3 ~i[S xlO6 K m-3
11972 1973
DinophysEs spp+ Phcllacroma rolundatum
~ r , A , , O . , D , , F , , A , , j , , A , ~ O ' ~
' J ' ' A ' ' O ' ' D ' ' F ' A ' ' J ' ' A ' ' O ' ' J ' ' A ' ~ D F A J A ' ~
Fig. 3: Phytoplanktom Seasonal distributions of important taxa, June 1972-November 1973. Density, cells • 106 m -3 (~:tm m -3 for Aphanizomenon flos-aquae) in the upper 25 m water
column
588 S. Eriksson et al.
Monads occurred in large numbers during the whole investigation period. Peak figures were recorded from June to August. The density was highest in 1972.
The protozoan plankton is here represented by various ciliate taxa (Fig. 4). Tintinnida spp. reached their highest densities in March and May with a secondary peak in August-September. Non-loricate ciliates always appeared in high densities.
CelisxIO3x
rn-3
197~
I
~
Tintinn~da
spp.
400
5000
20DO
i
M.esodinium sp.
Non-toricate ciliates
J A 0 D F A
Fig. 4: Protozoan plankton. Seasonal distributions of important taxa, June 1972-May 1973. Density in the upper 25 m water column
The most abundant species was Mesodinium sp. which reached a considerable first peak in March-April and a second peak in June. Other non-loricate forms were most abundant in May and July.
L#nnocalanus rnacrurus occurred in an irregular pattern and the ranges of var- iation were large (Fig. 5). However, abundance peaks were not usually recorded during the summer. Acartia bifilosa and Eurytemora affinis, which were the most abundant metazoan plankters, occurred in low densites during the first half of the year. From June the figures started to rise. E. affinis reached two considerable peaks in August and October while A. bifilosa produced a more even curve. Al~ October the values diminished.
P l a n k t o n community 589
Specimensxm-3
1972 1973
Limnocalanus macrurus
4OO-
E u r y t e m o r a a f f i n i s
30000-
tl A c a r t i a b i f i l o s a
30000
o
I1000 Bosmina coregoni moritima I I
o ~
4OO
g.
120
1972 1973
Balanus improvisus larvae
Bivalve larvae
Synchaeta spp.
~
tella qu idrata 35CI KerateUa cochlearis
J' 'A' '0' 'D I 'F' 'A' 'J' 'A' '0' T
'J 'A' '0 '
590 S. Eriksson et al.
Podon intermedius was more numerous than Pleopis polTphernoides on all sampling
occasions during 1973.
Larvae, mainly nauplii, of Balanus improvisus reached density peaks in July and October 1973. The figures were much lower in 1972. Bivalve veligers had a consid- erable density peak in April.
Synchaeta spp. mainly occurred from March to October and reached considerable
density peaks in April, May, June, and October. Keratella quadrata was very abun- dant in August. K. cochlearis was less numerous than the above-mentioned species. Its main occurrence was during August and September.
A 1972 19?3
- - T
Aphanizomenon flos-oquae
P y r a m i m o n a s ~ s p .
60- Oocystis spp. 40- Ebria 20- Thato~sslosira spp.
aetoceros spp.
$celetonemQ costatum
Diatomae spp. > < ; >
Cryptomonas sp.* Rhodo
Katodiniurn sp, Dinophysis spp.* Pha[ac: Gonyau[ax caLen~la
Gymnodinium spp.
Dinophyc~tes spp.
~on~ds
nonas sp.
om-~r'~ rotundat um ~
1972 1973 LimnocalQnus macrurus
Eurytemora affinis
Acarti~ bifitosa
Bosrnina c. mariUrna
Evadne nordmennl
Pieopis poLyphemoides
Biv~.lve larvae
Synchaeta spp.
~ ' ' A ' ' 0 ' ' 197Z 1973
- - Phytoplankton Protozoan plankton Metazoan plankton
P l a n k t o n c o m m u n i t y 591
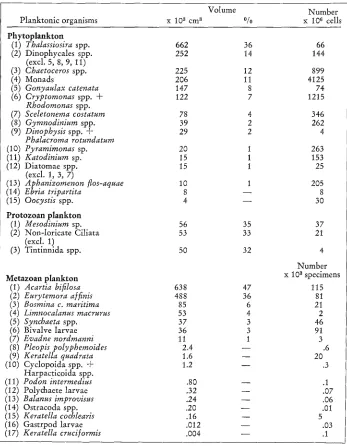
V o l u m e d o m i n a n c e
T h e p l a n k t o n f l o r a w a s d o m i n a n t e d b y d i a t o m s (53 % o f t h e t o t a l p h y t o p l a n k t o n s t a n d i n g c r o p ) ( T a b l e 2). Thalassiosira spp. w a s t h e m o s t i m p o r t a n t t a x o n . W i t h i n
Table 2
Dominance of phytoplankton, protozoan and metazoan p l a n k t o n during June 1972-May 1973. Accumulated values m -~
Volume N u m b e r
Planktonic organisms x 103 cm 3 % x 106 cells
Phytoplankton
(1) Thalassiosira spp. 662 36 66
(2) Dinophycales spp. 252 14 144
(excl. 5, 8, 9, 11)
(3) Chaetoceros spp. 225 12 899
(4) Monads 206 11 4125
(5) Gonyaulax catenata 147 8 74
(6) Cryptornonas spp. + 122 7 1215
Rhodomonas spp.
(7) Sceletonerna costatum 78 4 346
(8) Gyrnnodinium spp. 39 2 262
(9) Dinophysis spp. + 29 2 4
Phalacrorna rotundaturn
(10) Pyramimonas sp. 20 1 263
(11) Katodiniurn sp. 15 1 153
(12) Diatomae spp. 15 1 25
(excl. 1, 3, 7)
(13) Aphanizomenon flos-aquae 10 I 205
(14) Ebria tripartita 8 - - 8
(15) Oocystis spp. 4 - - 30
Protozoan plankton
(1) Mesodiniurn sp. 56 35 37
(2) Non-loricate Ciliata 53 33 21
(excl. 1)
(3) Tintinnida spp. 50 32 4
N u m b e r
Metazoan plankton x 103 specimens
(l) Acartia bifilosa 638 47 115
(2) Euryternora a/finis 488 36 81
(3) Bosmina c. maritima 85 6 21
(4) Limnocalanus macrurus 53 4 2
(5) Synchaeta spp. 37 3 46
(6) Bivalve larvae 36 3 91
(7) Evadne nordmanni 11 1 3
(8) Pleopis polyphemoides 2.4 - - .6
(9) Keratella quadrata 1.6 - - 20
(10) Cyclopoida spp. + 1.2 - - .3
Harpacficoida spp.
(11) Podon interrnedius .80 - - .1
(12) Polychaete larvae .32 - - .07
(13) Balanus irnprovisus .24 - - .06
(14) Ostracoda spp. .20 - - .01
(15) Keratella cochlearis .16 - - 5
(16) Gastrpod larvae .012 - - .03
592 S. Eriksson et al.
the protozoan plankton the most important species was Mesodiniurn sp. which con- stituted 35 ~ of the total protozoan standing crop. The metazoan plankton was strongly dominated by the copepods which constituted 87 ~ of the total metazoan standing crop.
The spring bloom occurred during March-April with a maximum value of 45.0 cm-~m -2 (Fig. 6). During this period the diatoms Thalassiosira spp., Chaeto- ceros spp., and Sceletonerna costaturn and the dinoflagellate Gonyaulax catenata dom- inated. A~er the spring bloom the general trend of the phytoplankton volume was towards diminishing figures (range 1.0-12.0 cm-~m-2). During May-June Thalas- siosira spp. were still dominating but were later succeeded by small forms such as Cryptomonas spp., Rhodornonas spp., and monads. However, Thalassiosira spp. were always of relatively great importance because of their large size and numerical density. Blue-green algae were never of any major importance.
The protozoan plankton reached fairly large volumes during March-May (max. value 2.5 cm-3m -2) but during the rest of the year the figures were low (range .004-.033 cm-~m-2).
The metazoan plankton volume was relatively low from November to June (range of means .2-9.8 cm-~m -2) but from July to October the figures were high (range of means 10.2-29.2 cm-Sm-2). During most of the year the copepods Acartia bifilosa and Euryternora affinis dominated. Other taxa such as bivalve veligers and the rotifers Synchaeta spp. were occasionally of importance.
DISCUSSION
C o m p o s i t i o n o f t h e p l a n k t o n c o m m u n i t y
Bagge & Lehmusluoto (1971) and Niemi (1972a) have discussed phytoplankton and primary production in relation to eutrophication in Finnish coastal waters. These papers offer an excellent opportunity for comparison with the present results. The 13regrundsgrepen may thus be classified as an oligotrophic area according'to the following criteria: (a) the diversity is comparably large, (b) the phytoplankton biomass is large in spring but small in summer, (c)-the spring bloom is dominated by diatoms and dinoflagellates, and (d) the trophogenic layer is considerably thicker than 10 m during the summer.
Plankton community 593 B i o m a s s
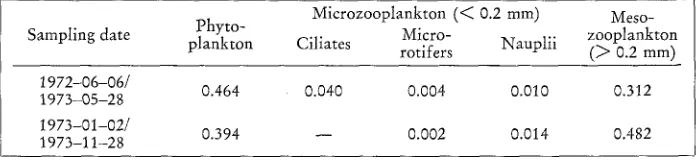
Estimation of biomass was done according to 1 cm8 = 1 gwwt = 0.05 g C (cf. Mullin, 1969). The average phytoplankton biomass in the Uregrundsgrepen is 0.5 g C m -~ based on data from June 1972 to May 1973 and 0.4 g C m -2 based o~
Table 3
Estimation of biomass (g C m -z) of phytoplankton, microzooplankton, and mesozooplankton in the Uregrundsgrepen during June 1972-November 1973. Average per sampling occasion
Microzooplankton (< 0.2 mm) Meso- Sampling date Phyto- M i c r o - Nauplii zooplankton
plankton C i l i a t e s rotifers (> 0.2 mm)
1972-06-06/ 0.464 0.040 0.004 0.010 0.312
1973-05-28 1973-01-02/
0.394 - - 0.002 0.014 0.482
1973-11-28
data from January to November 1973 (Table 3). Preliminary reports from the western Aland Sea and nothern Bothnian Sea suggest lower figures, viz. 0.2 to 0.3 g C m -2 (calculated from wet weight by the authors; Ackefors & Lindahl, 1975a, b). Unfortu- nately, data on primary production are not available for the Uregrundsgrepen. How- ever, Niemi (1972b) reported an annual phytoplankton production of 48-66 g C m -~ for inshore and offshore waters at Tv~irminne (northwest Gulf of Finland) during 1967-1971. Fonselius (1972) gave 57 g C m -e year -1 for central Bothnian Sea during 1961-1968 and Ackefors & Lindahl (1975a, b) 70-94 g C m -~ year -1 for western Aland Sea and northern Bothnian Sea during 1973-1974. However, these data are not directly comparable owing to differences in methods and sampling inten- sities but the general tendency seems to be towards lower values than suggested by Ryther (1970) for neritic waters, i.e. 100 g C m -~ year-~. Although it is clear that there is poor correlation between standing crop and primary production (cf. Paasche, 1960; Bagge & Niemi, 1971), indication is obtained that the Uregrundsgrepen is a somewhat more productive coastal area in a region of low primary production. Up- wellings along the mainland may be responsible for this situation.
594 S. Eriksson et al.
T h e r e l a t i v e i m p o r t a n c e o f m i c r o - a n d m e s o z o o p l a n k t o n
In a series of papers, Beers & Stewart (cf. 1971) reported on the occurrence of microzooplankton of the upper waters of eastern Pacific. These authors repeatedly emphasized the significance of microzooplankton in the marine food web. However, the nutritional demands of microzooplankton are by no means clearly defined. Zeitz- schel (1967) e.g., suggested that tintinnids feed on detritus, bacteria, and algae, while Hedin (1975) showed that tintinnid cytoplasm usually contains considerable amount of algal remains, e.g. the dinoflagellates Prorocentrum and Katodinium. During many years of rearing experiments with this taxon, Gold (1973) fed them various algal species. An indication of the trophic relationship between phytoplankton and micro- zooplankton is the fact that large standing crops tend to co-occur in time. Similar observations were made on a spatial basis by Beers & Stewart (1971) and Margalef (1973). However, it seems doubtful that all size groups of algae are suitable as food for microzooplankton. Certain microzooplankton species may also partly be auto- trophic. These questions are presently lett open.
For the investigation area, an attempt is made in Table 4 to elucidate the relative importance of micro- and mesozooplankton in the energy flow. This estimate implies that (a) 100 % of the phytoplankton production is consumed by zooplankton, (b) microzooplankton only feeds on phytoplankton, and (c) the biomass figures are reliable. In this case about 60 0/0 of the primary production is consumed by microzoo- plankton. However, neither assumption (a) nor (b) are altogether correct. The accuracy of the microzooplankton figures is probably less than that of the mesozooplankton. Furthermore, the turn-over time of the ciliates is based on laboratory experiments and only on guesses concerning micro-rotifers. Bearing this in mind, it may nevertheless be suggested that this crude calculation indicates the correct magnitude of the energy flow through these size groups of the plankton fauna. It is interesting that Beers & Ste- wart (1971) estimated the corresponding value to 70 0/0 in a transect across the Cali- fornia current during February-March 1968. In the present study, the microzoo- plankton constitutes 15 % of the total zooplankton biomass calculated on an annual basis. The corresponding figure for the waters off La Jolla, California, was 17-21 ~ during April to September (Beers & Stewart, 1970) which is of the same magnitude as the figures from investigations of shorter duration in the eastern Pacific by these authors (cf. e.g. Beers & Stewart, 1971). Table 4 also shows that ciliates are the dominating group of the microzooplankton in the brackish water of the Oregrunds- grepen. A parallel may be drawn with coastal waters of full salinity in the western Mediterranean where Margalef (1967) suggested that ciliates contribute as much or even more to the organic production as does net zooplankton. In summary, it seems that microzooplankton, and especially ciliates, play a decisive role within the pelagic biocoenosis.
Plankton community 5 9 5
$
.6
B
8
#
0
~S
0 ~ 0
0 b ~
~'~
0 ~ 0 N
0 t~
B 0
o.,u
~ 8
o
.o U
o~..=I
. o ~ ~
~ . ~
~ 0
<~'~
"B
0
m m.
I;~ b , u ' ~ t - ,
o o ~
o ' ~ -
~ II II ]1
o~-~
X X X
u'h ur~ e,I
0 '~'~1 0 ,,,,'h
II I/ /I II
o~-o~
m X X X X
0
t'-I t'-.I u ~
m t,"~ ,....~ m X X X ~
X
m
v
~
P-.
o ' ,
v
~ o
o ~ t , .
596 S. Eriksson et al.
Acknowledgements. This investigation was financed by the Swedish Natural Environment
Protection Board and working facilities were supplied by the Institute of Zoology at Uppsala University. The authors express their warmest gratitude to Professor K.-G. Nyholm, Institute of Zoology, Uppsala, and to the project leader Associate Professor U. Grimes, the Swedish Natural Environment Protection Board, for valuable support and advice. The discussion on phytoplankton with Assistant Professor K. Thomasson, Institute of Ecological Botany, Uppsala, and on microzooplankton with Dr. H. Hedin, Institute of Zoology, Uppsala, are gratefully acknowledged. The data on salinity, winds, and currents were kindly submitted by the Swedish Meteorological and Hydrological Institute.
L I T E R A T U R E C I T E D
Ackefors, H., 1975. Production studies of zooplankton in relation to the primary production in the Baltic proper. Merentutkimuslait. Julk. 239, 123-130.
- - & Lindahl, O., 1975a. Investigation on primary phytoplankton production in the Baltic in 1973. Meddn Havsfiskelab. Lysekil 179, 1-14.
- - - - 1975b. Investigations on primary phytoplankton production in the Baltic in 1974. Meddn Havsfiskelab. Lysekil 195, 1-13.
Anonymous, 1912. Bull. plankt. 1908-1911, 1-62.
Bagge, P. & Lehmusluoto, P. O., 1971. Phytoplankton primary production in some Finnish coastal areas in relation to pollution. Merentutkimuslait. Julk. 235, 3-18.
- - & Niemi, .~., 1971. Dynamics of phytoplankton primary production and biomass in Loviisa archipelago (Gulf of Finland). Merentutsimuslait. Julk. 233, 19-41.
Beers, J. R. & Stewart, G. L., 1970. Numerical abundance and estimated biomass of micro- zooplankton. Bull. Scripps Insm Oceanogr. Tech. Set. 17, 67-87.
- - 1971. Micro-zooplankters in the plankton communities of the upper waters of the eastern
tropical Pacific. Deep Sea Res. 18, 861-883.
Digby, P. S. B., 1950. ~I~e biology of small planktonic copepods of Plymouth. J. mar. biol. Ass. U. K. 29, 393-438.
Elbr~ichter, M., 1970. Phytoplankton und Ciliaten. Kieler Meeresforsch. 26, 193-203.
Eriksson, S., 1973a. The biology of marine planktonic Copepoda on the west coast of Sweden. Zoon 1, 37-68.
- - 1973b. Preliminary zooplankton investigations in the Uregrund archipelago (southwestern Bothanian Sea) during the summer 1970. Zoon 1, 95-111.
- - On the ecology of the copepods Eurytemora affinis Poppe and Acartia bifilosa Giesbrecht in the EIregrundsgrepen (southwest Bothnian Sea). (In prep.).
Fonselius, S. H., 1972. On primary production in the Baltic. Meddn Havsfiskelab. Lysekil 134, 1-3.
Gold, K., 1971. Growth characteristics of the mass-reared tintinnid Tintinnopsis beroidea. Mar. Biol. 8, 105-108.
- - 1973. Methods for growing tintinnids in continuous culture. Am. Zool. 13, 203-208. - - & Pollingher, U., 1971. Microgamete formation and the growth rate of Tintinnopsis be-
roidea. Mar. Biol. 11, 324-329.
Hedin, H., 1975. On the ecology of tintinnids on the Swedish west coast. Zoon 3, 125-140. Hernroth, L. Studies on the population dynamics of Eurytemora sp. in the Bothnian Sea.
(Paper read at the meeting of the Baltic Marine Biologists at Gdynia, Poland, 1975.) Hessle, C. & Vallin, S., 1934. Investigations of plankton and its fluctuations in the Baltic
during the years 1925-1927. Svenska hydrogr.-biol. Kommn Skr. (Biol.) 1 (5), 1-132. Lindquist, A., 1959. Studien fiber das Zooplankton der Bottensee. II: Zur Verbreitung und Zu-
sammensetzung des Zooplanktons. Rep. Inst. mar. Res. Lysekil (Biol.) 11, 1-136.
- - 1 9 6 1 . Untersuchungen an Limnocalanus (Copepoda, Calanoida). Rep. Inst. mar. Res.
P l a n k t o n community 597 Margalef, R., 1967. E1 ecosistema. In: Ecologia marina. Fundati6n la salle de ciencias naturales,
Caracas 14, 377-453.
- - 1973. Distribucidn de los ciliados planctdnicos en la regi6n de afloramiento del noroeste de Africa. Resultados exp. cient. B/O Cornide (Suppl. to Investigacidn pesq.) 2, 109-124 Mullin, M. M., 1969. Production of zooplankton in the ocean: The present status and problems.
Oceanogr. mar. Biol. 7, 293-314.
Niemi, A., 1972a. Observations on phytoplankton in eutrophied and noneutrophied waters of the southern coast of Finland. Memo. Soc. Fauna Flor. fenn. 48, 63-74.
- - 1972b. Annual phytoplankton primary producation in the archipelago and sea zones at Tv~irminne, Gulf of Finland. IBP Norden 10, 17-21.
Paasche, E., 1960. On the relationship between primary production and standing stock of phytoplankton. J. Cons. int. Explor. Met 26, 33-47.
Pejler, B., 1972. Rotifer plankton in brackish and freshwater localities in central Sweden. Oikos 23, 416-419.
Remane, A., 1940. Einfiihrung in die Zoologische 121kologie der Nord- und Ostsee. Tierwelt Nord~ und Ostsee, la, 1-238.
Ryther, J. H., 1970. Photosynthesis and fish production in the sea. Science, N. Y. 166, 72-76. Schnese, W., 1969. Untersuchungen iiber die Produktivit~it der Ostsee. II. Das Phytoplankton
in der mittleren Ostsee und in der Bottensee im April/Mai 1967. Beitr. Meeresk. 26, 11-20. Uterm/Shl, H., 1958. Zur Vervollkommung der quantitativen Phytoplankton-Methodik. Mitt.
int. Verein. theor, angew. Limnol. 11 (9), 1-38.
Zeitschel, B., 1967. Die Bedeutung der Tintinniden als Glied der Nahrungskette. Helgol~inder wiss. Meeresunters. 15, 589-601.
First author's address: Dr. S. Eriksson Zoologiska instltutionen Box 561