R E S E A R C H
Open Access
The Rice Oligonucleotide Array Database: an atlas
of rice gene expression
Peijian Cao
1, Ki-Hong Jung
2, Daeseok Choi
3, Daehee Hwang
3, Jun Zhu
1*and Pamela C Ronald
2,4,5*Abstract
Background:Microarray technologies facilitate high-throughput gene expression analysis. However, the diversity of platforms for rice gene expression analysis hinders efficient analysis. Tools to broadly integrate microarray data from different platforms are needed.
Results:In this study, we developed the Rice Oligonucleotide Array Database (ROAD, http://www.ricearray.org) to explore gene expression across 1,867 publicly available rice microarray hybridizations. The ROAD’s user-friendly web interface and variety of visualization tools facilitate the extraction of gene expression profiles using gene and microarray element identifications. The ROAD supports meta-analysis of genes expressed in different tissues and at developmental stages. Co-expression analysis tool provides information on co-regulation between genes under general, abiotic and biotic stress conditions. Additionally, functional analysis tools, such as Gene Ontology and KEGG (Kyoto Encyclopedia of Genes and Genomes) Orthology, are embedded in the ROAD. These tools facilitate the identification of meaningful biological patterns in a list of query genes.
Conclusions:The Rice Oligonucleotide Array Database provides comprehensive gene expression profiles for all rice genes, and will be a useful resource for researchers of rice and other grass species.
Keywords:Rice oligonucleotide array database, Gene expression analysis, Meta-analysis, Co-expression, GO enrichment analysis
Background
Rice (Oryza sativa) is a staple food for more than 50% of the human population. Because of the high level of gen-omic colinearity and conservation of gene function among grass species, rice serves as a useful research model in other grass studies (Devos and Gale 2000; Jung et al. 2008a). The complete sequencing of rice genome achieved in year 2005 (International Rice Genome Sequencing Project 2005), has brought biological research to the genome scale and post-genome era, while assigning function to every rice gene is still an enormous challenge. Comprehensive annotations of rice genome sequence have revealed that more than half of the predicted genes do not have assigned biological func-tions (Yuan et al. 2005; Itoh et al. 2007; Tanaka et al. 2008). Despite extensive efforts to characterize the function of rice genes, only a handful of biological functions have been
identified, mostly through the laborious process of map-based cloning (Jung et al. 2008a).
Microarray technologies are an important strategy for genome-wide expression pattern analysis and is becoming increasingly important for gene functional analysis (Schmid et al. 2005). Several rice array platforms for the two rice subspecies (ssp. japonicaand indica) have been reported and their characteristics are summarized in Table 1. The GeneChip rice genome array, designed by Affymetrix and produced using a direct synthesis method, contains 57,381 probesets covering approximately 48,564 and 1,260 tran-scripts from thejaponicaandindicacultivars, respectively. Agilent has constructed a 22K Rice Oligo Microarray Kit based on rice FLcDNAs and recently announced a 44K
version (Shimono et al. 2007). TheOryza sativa Genome
Oligo Set (Version 1.0; 61K) was designed by the Beijing Genomics Institute and Yale University (BGI/Yale) and
based on the draft indica and japonica sequences. The
University of California, Davis, led a National Science Foundation (NSF) supported effort to design, print and * Correspondence:jzhu@zju.edu.cn;pcronald@ucdavis.edu
1
Institute of Bioinformatics, Zhejiang University, Hangzhou 310058, China 4Department of Plant Pathology, University of California, Davis 95616, USA
Full list of author information is available at the end of the article
validate 22K and 45K oligonucleotide arrays based on gene model predictions from TIGR’s osa1 version 3.0 release.
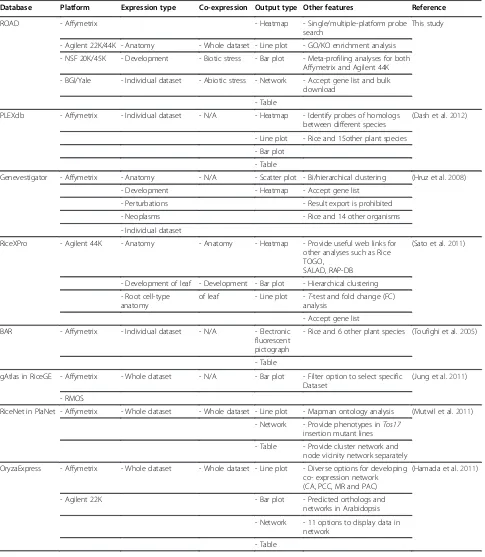
These rice microarray platforms have been successfully used in characterizing gene expression profiles from dif-ferent tissues and organs (Wang et al. 2010), difdif-ferent cell types (Jiao et al. 2009), under biotic and abiotic treatment conditions (Jung et al. 2008b; Swarbrick et al. 2008; Jung et al. 2010), identification of alternative splice (Jung et al. 2009) and mutants (Bruce et al. 2009). As a result, an increasing number of rice microarray datasets are being deposited in public repositories such as the Gene Expression Omnibus (GEO) at the National Center for Biotechnology Information (NCBI) (Barrett et al. 2009), the ArrayExpress at the European Bioinformatics Institute (EBI) (Parkinson et al. 2007) and the Center for Information Biology gene EXpression database (CIBEX) at the DNA Data Bank of Japan (DDBJ) (Ikeo et al. 2003). There are also several databases that allow for ef-ficient access and data mining of collections of micro-array data for rice (Table 2). For example, the Rice Expression Profile Database (RiceXPro, http://ricexpro. dna.affrc.go.jp/), which is based on the Agilent 44K microarray, provides an overview of the spatiotemporal gene expression profiles of various organs and tissues (Sato et al. 2011). Genevestigator (https://www.geneves-tigator.ethz.ch/) provides a meta-analysis toolbox to ex-plore gene expressions across a wide variety of biological contexts for rice and other species, but it is commercial and not completely publicly available (Hruz et al. 2008). Other databases including OryzaExpress (Hamada et al. 2011), RicePLEX within the Plant Expression Database (PLEXdb) (Dash et al. 2012), Bio-Array Resource for Plant Biology (BAR) (Toufighi et al. 2005) and Yale Vir-tual Center for Cellular Expression Profiling of Rice (Jiao et al. 2009) are useful for expression pattern analysis of rice genes. Although general agreement between different
microarray platforms has been shown to be low, data derived from high signal intensities can correlate between different platforms as well as in replicates of the same plat-form, and that overlap between significant gene lists from different platforms was as high as 67% when low intensity
values were removed from an Arabidopsisstudy (Pylatuik
and Fobert 2005). This suggests the potential application for the broad integration of microarray data from different platforms. Here we describe the Rice Oligonucleotide Array Database (ROAD, http://www.ricearray.org), which integrates the most comprehensive public microarray data-sets and provides several functional analysis tools. With a user-friendly web interface, the ROAD is a useful reference for elucidating rice gene expression and function.
Results and discussion
Microarray element search for multiple array platforms in rice
We collected information from six rice microarray plat-forms, including the Affymetrix, Agilent 22K and 44K, BGI/ Yale, and the NSF 20K and 45K, to construct the ROAD. Probe sequences from each platform were extracted and mapped onto cDNAs to match the probes to the expressed genes; the cDNAs were drawn from the Rice Genome An-notation Project (RGAP, previously TIGR) V6 (Ouyang et al. 2007), Rice Annotation Project (RAP) V3 (Tanaka et al. 2008) and the Knowledge-based Oryza Molecular bio-logical Encyclopedia (KOME) (Kikuchi et al. 2003) (Table 1). Because microarray platforms use their own element IDs ra-ther than common gene IDs, two search tools were devel-oped to determine the relationship between microarray elements and rice genes. The ‘Single-platform Microarray
Element Search’ and the ‘Multiple-platform Microarray
Element’ search tools allow users to identify the specific platform probes that map to a common gene target. Users may choose between entering a list of IDs (genes or
Table 1 Summary of rice microarray platforms available in ROAD
Platform No. of probes
(oligo length, nt)
MSU RGAP V6 RAP V3 KOME cDNA No. of
experiments/ samples in ROAD No. of
matched probes
No. of matched loci/gene models
No. of
matched probes
No. of matched loci/gene models
No. of matched probes
No. of matched cDNAs
Affymetrix 57,381 (25)
44,399 37,993/47,652 33,070 27,778/34,559 30,690 34,438 62/1,155
Agilent 22K 22,575 (60)
16,864 15,974/22,774 18,853 18,010/20,883 21,393 24,284 19/104
Agilent 44K 45,220 (60)
35,287 24,259/33,301 35,928 24,467/31,643 34,512 32,092 12/77
BGI/Yale 60,727 (70)
35,269 31,949/40,904 29,042 25,182/30,581 26,645 30,076 6/322
NSF 20K 21,120 (50-70)
18,156 18,150/23,489 12,697 13,040/15,879 10,982 15,311 2/120
NSF 45K 43,311 (50-70)
Table 2 Summary of databases for expression analysis of rice genes
Database Platform Expression type Co-expression Output type Other features Reference
ROAD - Affymetrix - Heatmap - Single/multiple-platform probe
search
This study
- Agilent 22K/44K - Anatomy - Whole dataset - Line plot - GO/KO enrichment analysis
- NSF 20K/45K - Development - Biotic stress - Bar plot - Meta-profiling analyses for both Affymetrix and Agilent 44K
- BGI/Yale - Individual dataset - Abiotic stress - Network - Accept gene list and bulk download
- Table
PLEXdb - Affymetrix - Individual dataset - N/A - Heatmap - Identify probes of homologs between different species
(Dash et al.2012)
- Line plot - Rice and 15other plant species
- Bar plot
- Table
Genevestigator - Affymetrix - Anatomy - N/A - Scatter plot - Bi/hierarchical clustering (Hruz et al.2008)
- Development - Heatmap - Accept gene list
- Perturbations - Result export is prohibited
- Neoplasms - Rice and 14 other organisms
- Individual dataset
RiceXPro - Agilent 44K - Anatomy - Anatomy - Heatmap - Provide useful web links for other analyses such as Rice TOGO,
SALAD, RAP-DB
(Sato et al.2011)
- Development of leaf - Development - Bar plot - Hierarchical clustering
- Root cell-type anatomy
of leaf - Line plot -T-test and fold change (FC) analysis
- Accept gene list
BAR - Affymetrix - Individual dataset - N/A - Electronic fluorescent pictograph
- Rice and 6 other plant species (Toufighi et al.2005)
- Table
gAtlas in RiceGE - Affymetrix - Whole dataset - N/A - Bar plot - Filter option to select specific Dataset
(Jung et al.2011)
- RMOS
RiceNet in PlaNet - Affymetrix - Whole dataset - Whole dataset - Line plot - Mapman ontology analysis (Mutwil et al.2011)
- Network - Provide phenotypes inTos17 insertion mutant lines
- Table - Provide cluster network and node vicinity network separately
OryzaExpress - Affymetrix - Whole dataset - Whole dataset - Line plot - Diverse options for developing co- expression network (CA, PCC, MR and PAC)
(Hamada et al.2011)
- Agilent 22K - Bar plot - Predicted orthologs and
networks in Arabidopsis
- Network - 11 options to display data in network
microarray elements) of interest and uploading a file to use these search tools. The search result can be returned as HTML format for browsing or txt format for download. The entire probe mapping matrix table is also available for download.‘Single-platform Microarray Element Search’tool in ROAD is similar with ID converter tool in OryzaExpress which provides the RAGP IDs, RAP IDs and Affymetrixp-robe IDs for querying and cross-linking (Hamada et al. 2011), while probe IDs from six array platforms correspond-ing to RAGP, RAP and KOME IDs are provided in ROAD.
Gene expression analysis
Raw rice microarray data from six platforms (including 105 experiments and 1,867 hybridizations from March 2012, electronic Additional file 1: Table S1) were down-loaded from public repositories and were normalized using the same method. One-channel and two-channel platforms were normalized separately because of differences in form features or designs (MAS 5.0 for one-channel plat-form, Lowess and MAD for two-channel platforms). For two-channel platforms, the normalized expression ratios (log2(Cy3/Cy5)) were used and the color-swap
hybridiza-tions were manually corrected to make them comparable among other samples. Normalized data were integrated into the ROAD, thus simplifying the retrieval process of their gene expression profiles. After entering a list of genes or microarray element IDs into the ROAD, the user can then select the microarray platform and specific experi-ment to search against (Figure 1a). The“Gene Expression Search”tool in ROAD provides a tabular list of microarray element IDs and of matching gene IDs from RGAP, RAP and KOME (Figure 1b). Clicking on the gene IDs will re-direct users to RGAP and RAP-DB databases to obtain detailed information on gene annotation. The expression profiles for query genes can be shown either as a heatmap (Figure 1c) or a classic line plot (Figure 1d). For one-channel platform Affymetrix, heatmap representation is generated by Blue-Black-Yellow color scheme, while Green-Black-Red for two-channel platforms (Agilent 22K
and 44K, BGI/Yale, NSF 20K and 45K). The scale bar for the heatmap output can be adjusted using several options. Because there are multiple microarray elements matched for some genes, the heatmap and line plot are displayed according to microarray element IDs. Besides displaying expression profile from multiple biological or technical replicates within an experiment, the average expression of
replicates can also be generated when checking “Show
Average” checkbox. The download option allows users to
easily transfer expression data into other databases or soft-ware for further analysis. The experiments integrated into
ROAD can be searched by the “Experiment Search” tool
and the “Highly Expressed Genes” tool allows users to
quickly identify a set of genes that are highly expressed under a selected expression threshold in a specific tissue.
Meta-analysis on anatomy and development from Affymetrix and Agilent 44K platforms
Because many factors such as RNA isolation, labeling and hybridization methods affect the quality of microarray data, pooling data from different experiments does not allow for a rigorous expression profiling analysis. Genevestigator developed a novel approach (meta-analysis) to assemble microarray data from different experiments into context-related profiles (meta-profiles). This large-scale combin-ation and analysis of expression data from a single organ-ism using a single platform allows the identification of biologically meaningful expression patterns of individual genes (Hruz et al. 2008). One drawback to Genevestigator, however, is that the public has limited access to the plat-form’s functions. As the open access version only supports the meta-analysis of a maximum of 50 genes at one time and does not allow data downloading, further analysis of the gene expression data is hindered. Therefore, we con-structed a meta-analysis tool based on the 1,155 Affymetrix hybridizations and 209 Agilent 44K hybridizations found in the ROAD. This construction was possible because both the Affymetrix and Agilent 44K platforms provide standar-dized systems with a high degree of reproducibility. We Table 2 Summary of databases for expression analysis of rice genes(Continued)
Gene Co-expression Network Browser
- Affymetrix - N/A - Whole dataset - Network - 45 gene modules (Ficklin et al.2010)
- 76 enriched co-functional clusters
- GO/KO/IPR enrichment analysis
- 6 options to display data in network
- Rice and maize
Note: Hyperlinks for the mentioned databases are as followings: ROAD (Rice Oligonucleotide Array Database),http://www.ricearray.org/; PLEXdb (Plant Expression Database),http://www.plexdb.org/; Genevestigator,https://www.genevestigator.com/gv/; RiceXPro,http://ricexpro.dna.affrc.go.jp/; BAR (The Bio-Array Resource for Plant Biology),http://bar.utoronto.ca/; gAtlas in RiceGE (Rice Functional Genomic Express Database),http://signal.salk.edu/cgi-bin/RiceGE?
have also developed four meta-profiles for genes expressed in different tissues and at different developmental stages for each of the two platforms. In case of the meta-profiles for the developmental stages, the Affymetrix meta-profile provides the average gene expression levels in all tissues during one developmental stage. The Agilent 44K provides the average gene expression levels in leaf blades during 17 developmental stages. Through analyzing Affymetrix and Agilent 44K anatomic meta-profiles, 19 root-preferential genes were identified and their anatomic (Figure 2a and 2c; Electronic Additional file 2: Figure S1a and c) and develop-mental expression patterns (Figure 2b; Electronic Additional file 2: Figure S1b, d and e) on both platforms are shown in Figure 2 and electronic Additional file 2: Figure S1. This meta-analysis allowed us to evaluate root-preferential expres-sion patterns. The meta-profile developmental stage analysis from the Affymetrix array platform indicates that these 19 genes were preferentially expressed during seedling stages (Figure 2b and electronic Additional file 2: Figure S1b). Using the Agilent 44K platform, we found that expression levels in leaf blades were lower than those in the root (Electronic Additional file 2: Figure S1d and e). These
results show that by integrating data for different anatomic tissues and developmental stages, the meta-analysis tool provides straightforward information about where and when genes of interest are expressed.
Co-expression analysis
Similarity of gene expression profiles (co-expression) can provide powerful information to identify new genes func-tionally related. The rapid accumulation of microarray data in past decade allows the creation of co-expression net-works by examining the co-expression patterns of genes over a large number of experimental conditions. Several online co-expression analysis tools have been developed for rice, including OryzaExpress (Hamada et al. 2011), RiceArrayNet (Lee et al. 2009) and ATTED-II (Obayashi et al. 2011). During co-expression analysis, more micro-array data will generate better reliability. Based on the col-lection of the most comprehensive microarray data in ROAD (Table 2), we also developed co-expression analysis tools in ROAD. After filtering out of 74 outliers and select-ing hybridizations involved in abiotic and biotic stresses, three kinds of co-expression relationships between rice
Figure 1Process of gene expression profiling analysis in ROAD.(a) A snap shot of the web interface for gene expression search in ROAD. Gene expression search can be initiated by entering one (or multiple) gene(s) or microarray element ID(s), such as RGAP ID, RAP ID, KOME ID, Affymetrixprobeset ID, or by uploading a file containing them. Then select the microarray platform and specific experiment to search against and the display format. (b) Tabular list of microarray elements mapped onto the example gene IDs when selecting Affymetrix platform. (c) Heatmap representation of expression profiles retrieved by the example genes from Affymetrix experiment GSE6737. (d) The classical line plot
genes were calculated, including general co-expression, abiotic and biotic stress co-expression, based on 1,081, 329 and 181 Affymetrix microarray hybridizations individually. The widely used Pearson correlation coefficient (PCC) index was selected to evaluate the similarities of expression profiles for gene pairs. We selected default values of the PCC cutoff as 0.75 and 0.8, for general and abiotic and bi-otic stresses, respectively. At this relatively stringent cutoff value, the general or abiotic and biotic stress co-expression
networks can be constructed by using online network draw-ing tool. After enterdraw-ing a list of guide-genes and selectdraw-ing the network type, a co-expression network will be generated by Cytoscape Web, an interactive web-based network browser (Lopes et al. 2010). The network can be easily zoomed in/ out and external RGAP database link is provided for each node. The download option allows users to export the net-work into local file with SIF format which can be used in local Cytoscape or other network analysis software. Lower
co-expression under the selected PCC cutoff values and negative co-expression may still be meaningful for some genes, so we developed another tool to extract positively and negatively co-expressed genes with query gene under a user entered PCC cutoff, not limited to the cutoff values used in network construction. All the current rice co-expression ana-lysis tools in Table 2 use the whole microarray dataset to construct the network except ROAD and RiceXPro. Of them, RiceXPro provides two co-expression profiles such as anatomy (spatiotemporal gene expression of various tissues/ organs across entire life cycle) and development of leaves (Sato et al. 2011). The abiotic and biotic co-expression net-work tools in ROAD will provide useful information for elu-cidating the relationship of stress related genes. It has been proven to be reasonable to calculate the co-expression for each set of diverse experiment conditions with a clear bio-logical meaning in ATTED-II (Obayashi et al. 2011), sup-porting the possible functionality of rice abiotic and biotic co-expression network tools.
Functional analysis using gene ontology or KEGG orthology
Gene Ontologies (GO) provide controlled vocabulary to describe the biological process, molecular function, and component of the cell to which a gene product putatively contributes (Ashburner et al. 2000; Berardini et al. 2004; The Gene Ontology Consortium 2008). KEGG Orthology (KO) consisting of manually defined ortholog groups that correspond to KEGG pathway nodes and BRITE hierarchy nodes, is the basis for the representation of KEGG refer-ence pathway maps and BRITE functional hierarchies (Kanehisa et al. 2010). GO and KO analyses are useful for identifying biological patterns in a list of genes, microarray datasets, or cDNA collection. For example, GO enrichment analysis has been successfully applied to assessment of rice light-responsive genes (Jung et al. 2008b). To facilitate GO and KO analyses of query genes, we developed online tools to identify the enriched or depleted GO/KO terms within a query gene list based on a hypergeometric distribution. These tools provide a tabular list of GO/KO terms mapped onto the query genes with detailed information for each term. Next, a hypergeometricpvalue is calculated for each GO/KO term, whose value is based on comparisons of the observed number from the queried gene list and the expected number from the genome scale.
Conclusions
The Rice Oligonucleotide Array Database is designed to provide a comprehensive gene expression profile for all rice genes. Our current meta-analysis tool focuses on expres-sions specific to tissue and developmental stages. This ana-lysis will be expanded to include meta-profiles of genes expressed during the rice response to abiotic and biotic stresses and to hormone treatment. New microarray data
will be normalized and imported into ROAD semi-automatically on a regular. We anticipate that this database will be useful to researchers of rice and other grass species and that it will accelerate the identification of gene func-tion in monocotyledonous species.
Methods
Microarray data and database construction
As of March 2012, microarray data from 105 rice micro-array experiments (1,867 hybridizations) were collected from NCBI GEO (Barrett et al. 2009), EBI ArrayExpress (Parkinson et al. 2007) and PLEXdb (Dash et al. 2012). The raw data was downloaded and experiments without raw data were discarded. For one-channel array (Affymetrix), MAS 5.0 method provided by the R package, affy, for the Affymetrix rice array was used to conduct background cor-rection, normalization, probe specific background correc-tion, probe summarization and convert probe level data to expression values (Affymetrix 2012). The trimmed mean target intensity of each array was arbitrarily set to 500. The data were then log2 transformed. For two-channel arrays
(Agilent 22K and 44K, BGI/Yale, NSF 20K and 45K), R package marray in Bioconductor was used to do the normalization with within-array Lowess and between-array MAD scale normalization methods (Cleveland 1979; Wang et al. 2002). The color-swap hybridizations were manually corrected to make them comparable among other samples. In case of Agilent 44K array data used for meta-profiling analyses, we converted the median signal intensities of Cy3 to log2median intensities and then normalized the log2
in-tensities using the quantile normalization method (Bolstad et al. 2003). The sequences of probes were extracted from each platform website and then mapped onto RGAP V6, RAP V3 and KOME cDNAs using NCBI Blast with 100% identity over 100% coverage (Altschul et al. 1990). Regard-ing Affymetrixprobeset which have 11 probe pairs, the pro-beset with at least half perfect-match (PM) probes matched onto cDNA sequence was considered as mapped.
The ROAD database was constructed with PHP (Hyper-text Preprocessor) and MySQL, run on a Windows 2003 server. The http address is http://www.ricearray.org. Heat-map and classic line plots were generated by the PHP li-brary JpGraph (http://jpgraph.net/).
Co-expression analysis
highest expression profile was used. There are several kinds of methods to evaluate the strength of co-expression, such as Pearson correlation coefficient (PCC), mutual rank (MR) based on rank transformations of the weighted PCC (Obayashi and Kinoshita 2009) and correspondence analysis (CA) (Yano et al. 2006). Although PCC takes a long-calculation time and was considered to contain many false-positives (Hamada et al. 2011; Obayashi et al. 2011), it has been widely used as an index in the co-expression analysis, such as RiceArrayNet (Lee et al. 2009), RiceXPro (Sato et al. 2011) and Gene Co-expression Network Browser (Ficklin et al. 2010). The success in functional study of plant genes using PCC has also been reported (Fujii et al. 2010; Matsuura et al. 2010; Soeno et al. 2010). Therefore, we adopted PCC to measure tendency of co-expression between genes based on these 1,081 Affymetrix samples. To choose an appropriate PCC cutoff value to construct co-expression network, we examined the changes in the node number, edge number, and network density as a function of PCC cutoff values. As the cutoff value increased, both the node number and edge number decreased; however, as the cutoff reached a relatively high value, the decreasing rate of edges became slower than that of nodes, which might lead to an increase in the net-work density. Indeed, the netnet-work density showed minima around 0.75 (general) and 0.8 (abiotic and biotic stresses) PCC cutoff values and increased thereafter. Therefore, we selected default values of the PCC cutoff as 0.75 and 0.8, for general and abiotic and biotic stresses, respectively. Cytoscape Web, an interactive web-based network browser, was used as the network viewer (Lopes et al. 2010).
GO and KO enrichment analysis
The GO terms and assignments for rice genes were down-loaded from Gramene database (http://www.gramene.org/) (Jaiswal 2011) and KO from KEGG database (http://www. genome.jp/kegg/) (Kanehisa et al. 2010). The RAP rice gene locus IDs in KEGG database were converted to RGAP IDs using RAP-DB ID converter tool (http://rapdb.dna. affrc.go.jp/tools/converter) (Tanaka et al. 2008). Then hypergeometric distribution was used to calculate the
p value for GO and KO enrichment analyses.
Additional files
Additional file 1:Table S1.Detailed information of rice microarray experiments available in ROAD.
Additional file 2:Figure S1.Screenshots of meta-analysis in ROAD queried with 19 root-preferential genes for anatomy (a) and developmental stages (b) of Affymetrix array platform, and anatomy (c) and developmental stages (d, e) of Agilent 44K array platform.
Competing interests
The authors declare that they have no competing interests.
Authors’contributions
PC and KJ did the microarray data analysis and developed ROAD. DC and DH wrote script for microarray data normalization. JZ and PCR proposed the project idea, evaluated the database, pointing out errors and improvements. All authors read and approved the final manuscript.
The authors wish it to be known that, in their opinion, the first two authors should be regarded as joint First Authors.
Acknowledgments
This research was supported in part by National Basic Research Program of China (2011CB109306), Next-Generation BioGreen 21 Program (PJ008079 and PJ008173) and BioGreen 21 Program (20080401) of Korea. This work was also supported by the US Department of Energy, Office of Science, Office of Biological and Environmental Research, through contract DE-AC02-05CH11231 between Lawrence Berkeley National Laboratory and the US Department of Energy.
Author details
1Institute of Bioinformatics, Zhejiang University, Hangzhou 310058, China. 2Department of Plant Molecular Systems Biotechnology & Crop Biotech
Institute, Kyung Hee University, Yongin 446-701, Korea.3School of
Interdisciplinary Bioscience and Bioengineering & Integrative Biosciences and Biotechnology, POSTECH, Pohang 790-784, Korea.4Department of Plant Pathology and the Genome Center, University of California, Davis 95616, USA.5Joint Bioenergy Institute, Emeryville 94710, USA.
Received: 11 June 2012 Accepted: 13 June 2012 Published: 19 July 2012
References
Affymetrix (2012) Affymetrix Expression Console Software 1.2 User Manual., Technote. http://media.affymetrix.com/support/downloads/manuals/ expression_console_userguide.pdf
Altschul SF, Gish W, Miller W, Myers EW, Lipman DJ (1990) Basic local alignment search tool. J Mol Biol 215(3):403–410
Ashburner M, Ball CA, Blake JA, Botstein D, Butler H, Cherry JM et al (2000) Gene ontology: tool for the unification of biology. The Gene Ontology Consortium. Nat Genet 25(1):25–29
Barrett T, Troup DB, Wilhite SE, Ledoux P, Rudnev D, Evangelista C et al (2009) NCBI GEO: archive for high-throughput functional genomic data. Nucleic Acids Res 37(Database issue):D885–D890
Berardini TZ, Mundodi S, Reiser L, Huala E, Garcia-Hernandez M, Zhang PF et al (2004) Functional annotation of theArabidopsisgenome using controlled vocabularies. Plant Physiol 135(2):745–755
Bolstad BM, Irizarry RA, Astrand M, Speed TP (2003) A comparison of
normalization methods for high density oligonucleotide array data based on variance and bias. Bioinformatics 19(2):185–193
Bruce M, Hess A, Bai JF, Mauleon R, Diaz MG, Sugiyama N et al (2009) Detection of genomic deletions in rice using oligonucleotide microarrays. BMC Genomics 10(129). doi:10.1186/1471-2164-10-129
Cleveland W (1979) Robust Locally Weighted Regression and Smoothing Scatterplots. J Am Stat Assoc 74(368):829–836
Dash S, Van Hemert J, Hong L, Wise RP, Dickerson JA (2012) PLEXdb: gene expression resources for plants and plant pathogens. Nucleic Acids Res 40 (Database issue):D1194–D1201
Devos KM, Gale MD (2000) Genome relationships: the grass model in current research. Plant Cell 12(5):637–646
Ficklin SP, Luo F, Feltus FA (2010) The association of multiple interacting genes with specific phenotypes in rice using gene coexpression networks. Plant Physiol 154(1):13–24
Fujii S, Yamada M, Fujita M, Itabashi E, Hamada K, Yano K et al (2010) Cytoplasmic-nuclear genomic barriers in rice pollen development revealed by comparison of global gene expression profiles among five independent cytoplasmic male sterile lines. Plant Cell Physiol 51(4):610–620
Gentleman RC, Carey VJ, Bates DM, Bolstad B, Dettling M, Dudoit S et al (2004) Bioconductor: open software development for computational biology and bioinformatics. Genome Biol 5(10):R80
Hruz T, Laule O, Szabo G, Wessendorp F, Bleuler S, Oertle L et al (2008) Genevestigator v3: a reference expression database for the meta-analysis of transcriptomes. Adv Bioinformatics 2008(420747). doi:10.1155/2008/420747 Ikeo K, Ishi-i J, Tamura T, Gojobori T, Tateno Y (2003) CIBEX: center for information
biology gene expression database. C R Biol 326(10–11):1079–1082
International Rice Genome Sequencing Project (2005) The map-based sequence of the rice genome. Nature 436(7052):793–800
Itoh T, Tanaka T, Barrero RA, Yamasaki C, Fujii Y, Hilton PB et al (2007) Curated genome annotation ofOryza sativassp.japonicaand comparative genome analysis withArabidopsis thaliana. Genome Res 17(2):175–183
Jaiswal P (2011) Gramene database: a hub for comparative plant genomics. Methods Mol Biol 678:247–275
Jiao Y, Tausta SL, Gandotra N, Sun N, Liu T, Clay NK et al (2009) A transcriptome atlas of rice cell types uncovers cellular, functional and developmental hierarchies. Nat Genet 41(2):258–263
Jung KH, An G, Ronald PC (2008a) Towards a better bowl of rice: assigning function to tens of thousands of rice genes. Nat Rev Genet 9(2):91–101 Jung KH, Dardick C, Bartley LE, Cao P, Phetsom J, Canlas P et al (2008b)
Refinement of light-responsive transcript lists using rice oligonucleotide arrays: evaluation of gene-redundancy. PLoS One 3(10):e3337
Jung KH, Bartley LE, Cao PJ, Canlas PE, Ronald PC (2009) Analysis of Alternatively Spliced Rice Transcripts Using Microarray Data. Rice 2(1):44–55
Jung KH, Seo YS, Walia H, Cao P, Fukao T, Canlas PE et al (2010) The submergence tolerance regulatorSub1Amediates stress-responsive expression ofAP2/ERFtranscription factors. Plant Physiol 152(3):1674–1692 Jung KH, Jeon JS, An G (2011) Web Tools for Rice Transcriptome Analyses.
Journal of Plant Biology 54(2):65–80
Kanehisa M, Goto S, Furumichi M, Tanabe M, Hirakawa M (2010) KEGG for representation and analysis of molecular networks involving diseases and drugs. Nucleic Acids Res 38(Database issue):D355–D360
Kauffmann A, Gentleman R, Huber W (2009) arrayQualityMetrics–a bioconductor package for quality assessment of microarray data. Bioinformatics 25(3):415–416 Kikuchi S, Satoh K, Nagata T, Kawagashira N, Doi K, Kishimoto N et al (2003)
Collection, mapping, and annotation of over 28,000 cDNA clones from japonicarice. Science 301(5631):376–379
Lee TH, Kim YK, Pham TT, Song SI, Kim JK, Kang KY et al (2009) RiceArrayNet: a database for correlating gene expression from transcriptome profiling, and its application to the analysis of coexpressed genes in rice. Plant Physiol 151 (1):16–33
Lopes CT, Franz M, Kazi F, Donaldson SL, Morris Q, Bader GD (2010) Cytoscape Web: an interactive web-based network browser. Bioinformatics 26(18):2347–2348 Matsuura H, Ishibashi Y, Shinmyo A, Kanaya S, Kato K (2010) Genome-wide
analyses of early translational responses to elevated temperature and high salinity inArabidopsis thaliana. Plant Cell Physiol 51(3):448–462
Mutwil M, Klie S, Tohge T, Giorgi FM, Wilkins O, Campbell MM et al (2011) PlaNet: combined sequence and expression comparisons across plant networks derived from seven species. Plant Cell 23(3):895–910
Obayashi T, Kinoshita K (2009) Rank of correlation coefficient as a comparable measure for biological significance of gene coexpression. DNA Res 16(5):249–260 Obayashi T, Nishida K, Kasahara K, Kinoshita K (2011) ATTED-II updates: condition-specific gene coexpression to extend coexpression analyses and applications to a broad range of flowering plants. Plant Cell Physiol 52(2):213–219 Ouyang S, Zhu W, Hamilton J, Lin H, Campbell M, Childs K et al (2007) The TIGR
Rice Genome Annotation Resource: improvements and new features. Nucleic Acids Res 35(Database issue):D883–D887
Parkinson H, Kapushesky M, Shojatalab M, Abeygunawardena N, Coulson R, Farne A et al (2007) ArrayExpress--a public database of microarray experiments and gene expression profiles. Nucleic Acids Res 35(Database issue):D747–D750 Pylatuik JD, Fobert PR (2005) Comparison of transcript profiling onArabidopsis
microarray platform technologies. Plant Mol Biol 58(5):609–624 Sato Y, Antonio BA, Namiki N, Takehisa H, Minami H, Kamatsuki K et al (2011)
RiceXPro: a platform for monitoring gene expression injaponicarice grown under natural field conditions. Nucleic Acids Res 39(Database issue):D1141–D1148 Schmid M, Davison TS, Henz SR, Pape UJ, Demar M, Vingron M et al (2005) A
gene expression map ofArabidopsis thalianadevelopment. Nat Genet 37 (5):501–506
Shimono M, Sugano S, Nakayama A, Jiang CJ, Ono K, Toki S et al (2007) Rice WRKY45plays a crucial role in benzothiadiazole-inducible blast resistance. Plant Cell 19(6):2064–2076
Soeno K, Goda H, Ishii T, Ogura T, Tachikawa T, Sasaki E et al (2010) Auxin biosynthesis inhibitors, identified by a genomics-based approach, provide insights into auxin biosynthesis. Plant Cell Physiol 51(4):524–536
Swarbrick PJ, Huang K, Liu G, Slate J, Press MC, Scholes JD (2008) Global patterns of gene expression in rice cultivars undergoing a susceptible or resistant interaction with the parasitic plantStrigahermonthica. New Phytol 179 (2):515–529
Tanaka T, Antonio BA, Kikuchi S, Matsumoto T, Nagamura Y, Numa H et al (2008) The Rice Annotation Project Database (RAP-DB): 2008 update. Nucleic Acids Res 36(Database issue):D1028–D1033
The Gene Ontology Consortium (2008) The Gene Ontology project in 2008. Nucleic Acids Res 36(Database issue):D440–D444
Toufighi K, Brady SM, Austin R, Ly E, Provart NJ (2005) The Botany Array Resource: e-Northerns, Expression Angling, and promoter analyses. Plant J 43(1):153–163 Wang J, Nygaard V, Smith-Sorensen B, Hovig E, Myklebost O (2002) MArray:
analysing single, replicated or reversed microarray experiments. Bioinformatics 18(8):1139–1140
Wang L, Xie W, Chen Y, Tang W, Yang J, Ye R et al (2010) A dynamic gene expression atlas covering the entire life cycle of rice. Plant J 61(5):752–766 Yano K, Imai K, Shimizu A, Hanashita T (2006) A new method for gene discovery
in large-scale microarray data. Nucleic Acids Res 34(5):1532–1539 Yuan Q, Ouyang S, Wang A, Zhu W, Maiti R, Lin H et al (2005) The Institute for
Genomic Research Osa1 Rice Genome Annotation Database. Plant Physiol 138(1):18–26
doi:10.1186/1939-8433-5-17
Cite this article as:Caoet al.:The Rice Oligonucleotide Array Database: an atlas of rice gene expression.Rice20125:17.
Submit your manuscript to a
journal and benefi t from:
7Convenient online submission
7Rigorous peer review
7Immediate publication on acceptance
7Open access: articles freely available online
7High visibility within the fi eld
7Retaining the copyright to your article