S a k a e H o r i s a w a 9 Y o h S a k u m a 9 Y u t a k a T a m a i S h u i c h i D o i 9 M i n o r u T e r a z a w a
Effect of environmental temperature on a small-scale biodegradation system
for organic solid waste
Received: October 20, 1999 / Accepted: March 22, 2000
A b s t r a c t T h e o p t i m u m e n v i r o n m e n t a l t e m p e r a t u r e for a b i o d e g r a d i n g m a c h i n e using w o o d particles as a m a t r i x was investigated using a small-scale d e g r a d a t i o n r e a c t o r and m o d e l waste. T h e b i o d e g r a d a t i o n rate was e v a l u a t e d by weight loss of waste and CO2 evolution. The d e g r a d a t i o n r e a c t i o n was restricted only by adjusting the e n v i r o n m e n t a l t e m p e r a t u r e while sufficient oxygen and substrates were supplied. Results suggested that the o p t i m u m t e m p e r a t u r e for d e g r a d a t i o n was 30~176 for exploiting biological ac- tivity effectively with the lowest use of energy. B a c t e r i a from the e n v i r o n m e n t p r o p a g a t e d in the r e a c t o r with no inoculum added. T h e m i c r o b i a l flora c h a n g e d during the o p e r a t i o n time b u t h a d no effect on the b i o d e g r a d a t i o n rate. K e y words B i o d e g r a d a t i o n 9 F o o d waste 9 O p t i m u m tem- p e r a t u r e 9 W o o d particles 9 M i c r o o r g a n i s m
Introduction
A g a r b a g e a u t o m a t i c d e c o m p o s e r - e x t i n g u i s h e r ( G A D E ) m a c h i n e that processes organic waste, especially f o o d waste, at a site w h e r e it is p r o d u c e d has b e e n d e v e l o p e d . 14
S. Horisawa ([]) 9 S. Doi
Institute of Wood Technology, Akita Prefectural University, Noshiro, Akita 016-0876, Japan
Tel. +81-185+52-6986; Fax +81-185-52-6975 e-mail: [email protected]
Y. Sakuma
Biological Resources Division, Japan International Research Center for Agricultural Sciences, Tsukuba 305-8686, Japan
Y. Tamai. M. Terazawa
Graduate School of Agriculture, Hokkaido University, Sapporo 060- 8589, Japan
Part of this report was presented at the 48th Annual Meeting of the Japan Wood Research Society, Tokyo, April 1998
M i c r o o r g a n i s m s p r o p a g a t e within a w o o d m a t r i x in a con- tainer of this machine, d e g r a d i n g g a r b a g e aerobically w h e n it is put in the machine
A e r o b i c d e g r a d a t i o n using a w o o d matrix has high per- formance, b u t the o p t i m u m o p e r a t i n g conditions m u s t be d e t e r m i n e d to use the machine effectively. W e have re- p o r t e d that the m o i s t u r e c o n t e n t of the w o o d m a t r i x has an effect on the d e g r a d a t i o n rate using a small-scale d e g r a d a - tion r e a c t o r and u n i f o r m m o d e l w a s t e ] T h e e n v i r o n m e n t a l t e m p e r a t u r e is also an i m p o r t a n t factor. S e v e r a l studies were c o n d u c t e d to d e t e r m i n e the o p t i m a l t e m p e r a t u r e for composting. K u t e r et al. r e p o r t e d that the o p t i m a l t e m p e r a - ture for c o m p o s t i n g cow m a n u r e was 40~-60~ 6 Suler and Finstein r e p o r t e d that 56~176 was o p t i m u m for c o m p o s t i n g food waste: 7 and N a k a s a k i et al. r e p o r t e d that the o p t i m a l t e m p e r a t u r e for composting sewage sludge was 60~ s T h e r e has b e e n no r e p o r t a b o u t the o p t i m a l t e m p e r a - ture for small-scale b i o d e g r a d a t i o n machines such as the G A D E . T h e t e m p e r a t u r e m e n t i o n e d a b o v e is higher t h a n that of the matrix in the G A D E . 2 In our e x p e r i m e m , the d e g r a d a t i o n rate was accurately e s t i m a t e d in a small-scale d e g r a d a t i o n reactor. W h e n using such a reactor, the tem- p e r a t u r e of the m a t r i x can b e c o n s i d e r e d equal to the envi- r o n m e n t a l t e m p e r a t u r e .
T h e n u m b e r and c o m m u n i t y of b a c t e r i a that change with the e n v i r o n m e n t a l t e m p e r a t u r e m a y influence the d e g r a d a - tion rate of the waste. M u l t i p l i c a t i o n of the m i c r o o r g a m s m was confirmed at an e n v i r o n m e n t a l t e m p e r a t u r e of 30~ in our previous report. 5 It was e x p e c t e d that m i c r o o r g a n i s m s a d a p t i n g to the e n v i r o n m e n t a l t e m p e r a t u r e p r o p a g a t e at higher or lower t e m p e r a t u r e s .
Materials and methods
Degradation experiment
The wood particles used as a matrix were prepared from
sapwood of Japanese cedar
[Cryptomeria japonica
(L. ill.)D. Don]. They were ground, and a grain size of 0.5-1.0mm was sieved. The moisture content of the wood particles was adjusted to 60% on a wet weight basis. A formula feed for rabbits, made from alfalfa, flour, delipidated soybean, and wheat germ (Hi-Pet Co., Osaka, Japan), was applied as the model waste because its content ratios of crude protein (19%), fat (2%), fiber (10%), and ash (9%) were similar to that of real food waste. 1'9-11 The carbon/nitrogen (C/N) ratio of the model waste was 13.9.
A 1000-ml Kjeldahl flask was used as a small-scale degra- dation reactor. 5 Each setup was established in a separate incubator adjusted to temperature of 10 ~ , 20 ~ , 30 ~ , 40 ~ , or
50~ The moisture content of the matrix was kept at 60%.
Model waste (3.5 g) was added to each reactor every 24h. Each of the three experiments lasted 30 days at 10 ~ , 20 ~ , 30 ~ ,
40 ~ and 50~ respectively.
Initially, 40 g of dried wood particles were placed in the reactors where the moisture contents were adjusted to 60 %. Each reactor was rotated at 30rpm for 2min every 15min. The model waste (3.5 g) was added to each of the reactors every 24h. The ratio of model waste to wood particles was greater than the ratio of the actual waste to the wood par- ticles used in the previous study. 1'2 The moisture contents of the wood matrices were checked with an infrared moisture content meter every 24h by using a 7-g sample from each treatment. The moisture contents of the matrices were then adjusted to maintain a constant level.
Weight loss, evolved CO2, p H level, and viable count of bacteria of the model waste
The total weight of the residual model waste was deter- mined by weighing the model reactor flask, including the wood matrix, and the model waste, assuming that the matrix was not degraded. The total weight loss of the degraded model waste was calculated by determining the difference between the original weight and the residual weight.
The concentration of carbon dioxide (CO2) in the ex- haust gas was monitored by a gas detector (Gastec, Kanagawa, Japan). The rate of CO2 evolution was calcu- lated by determining the difference in the concentration of CO2 in the inflowing air and the outflowing air, airflow rate, temperature, and gas constant using the equation for the ideal gas state. The p H of the supernatant, 30ml deionized water mixed with the 3 g wet matrix, was measured using a p H meter. All of these measurements were performed each day just before the new model waste was added.
The number of viable bacteria in a matrix attained from each treatment every 5 days was counted s by a serial dilu- tion method following standard methods. 12 The medium was composed of yeast extract (0.25%), peptone (0.5%), glucose (0.1%), and agar (1.5%). The plates on which about
20 colonies appeared were selected, and the dominant bac- teria were isolated. They were classified as gram positive or negative using SMA-added crystal violet (5ppm). 13 The bacteria were isolated and identified by a Biolog system, which determines the utilization pattern of 95 carbon sources. 14.15
Results and discussion
Rate of weight loss and CO2 evolution
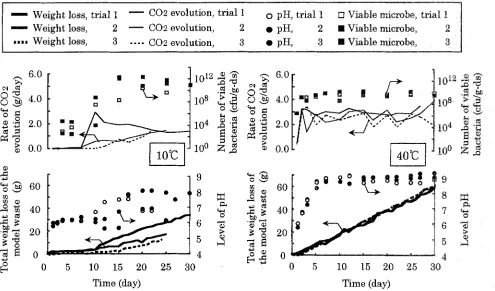
The time courses of total weight loss, CO 2 evolution, pH, and number of viable bacteria in the matrix at 10~ and 40~ are shown in Fig. 1, as an example. The variation of weight loss in the time charts was small at the examina-
tions except for the results at 10~ Degradation could be
stabilized by restricting environmental conditions such as temperature, moisture content of the matrix, and aeration rate.
A lag phase of the degradation test showed no weight loss in the waste at the various temperatures. The lag phase at higher temperatures became shorter. The relation be- tween the incubation time and weight loss was linear after the lag phase. The rates of weight loss, determined from the slopes of the lines, were 1.45, 1.77, 1.95, 2.01, and 2.15g/day at 10 ~ 20 ~ 30 ~ 40 ~ and 50~ respectively. In the range of temperatures used, the higher temperatures showed a higher rate of weight loss. From those values, the rates of weight loss (R-w) in the supplied waste weight, which were quotients of the rate of weight loss to the rate of model waste added (3.5 g/day), were calculated to be 298, 502, 556, 556, 590, and 631mg/g at environmental temperatures of
10 ~ 20 ~ 30 ~ 40 ~ and 50~ respectively (Fig. 2). The
sample at the lowest environmental temperature, 10~ showed the lowest rate of weight loss; but samples at other
temperatures, 20~176 showed nearly the same rates of
loss.
The speed of CO2 evolution increased gradually from the initial stage and became almost constant (steady state) at
each temperature condition except 10~ At 10~ the lag
phase was longer. The constant levels of CO2 evolution were determined from the average levels at steady state to be 1.12, 2.15, 2.52, 2.65, and 2.24g/day at 10 ~ 20 ~ 30 ~ 40 ~
and 50~ respectively. Based on these values, the rates of
CO2 evolution in the samples (R-co2), which were quotients of the speed of CO2 evolution to the speed of adding model waste (3.5 g/day), were determined to be 320, 565, 613,705, 745, and 626mg/g, respectively (Fig. 3). Samples at the up- per and lower ends of the temperature range showed lower rates of CO2 evolution.
The R-w value increased with an increase in environmen-
tal temperature, whereas the R-co 2 peaked at 40~ This
supposed volatilization of low-molecular-weight com- pounds compensated for the decline in CO2 evolution and
made the rate of weight loss higher at 50~ This finding
3
m W e i g h t loss, t r i a l 1 C 0 2 evolution, t r i a l 1
9 .- . . W e i g h t loss, 2 C 0 2 evolution, 2
. . . . W e i g h t loss, 3 . . . . C 0 2 evolution, 3
o p H , t r i a l 1
9 pH, 2
9 pH, 3
Viable microbe, t r i a l 1
[] V i a b l e microbe,
[ ] Viable microbe,
6.0
4.0
r 2.0
>
0.0
n 9
N 8 [] []
[]
1012 ,~ ~ ,'~ 6.0
4.0
~ o.o
10 ~ ~ . ~
a 60 9 o o 9 8 o ~ ~ 60
9 [ o o o 9 ] ~ ~
0) ~ 20 g ~ 20
0 5 10 15 20 25 30
r - ~
8
4
0 5 10 15 20 25 30
T i m e (day) T i m e (day)
110 8. "~--.
104 ~a '~
l o 0
Z .~
Fig. 1. Time course of total weight loss of the model waste, rate of CO: evolution, number of bacteria, and level of pH of matrix during the biodegradation operation of model waste at 10~ and 40~
700
600
500
400
300
2OO
100
+
,
!
I I I I I
0
10
20
30
40
50
60
Environmental temperature (~
Fig. 2. Relation between environmental temperature and the ratio of weight loss of the model waste, R-w, in the steady state. Vertical bars
show maximum and minimum values in three plots
?
900
800
700
600
500
400
300
200
100
0
0
I I
)
10
20
30
40
50
60
Environmental temperature (~
Fig. 3. Relation between environmental temperature and the rate of CO2 evolution, R-c%, in the steady state. Vertical bars show maximum and minimum values in three plots
be equipped with a heater or a heat insulator when it is used at a lower temperature.
Viable microbial concentration and p H of matrix
Bacterial growth was observed in all trials despite the fact that no inoculum was added. No bacterum was detected at the initial stage of the experiments, but the number of bac-
CD
"~ 1012
1011
101o
109 O
108
2:
I I I f I
0
10
20
30
40
50
60
Environmental temperature (~
Fig. 4. Relation between the environmental temperature and the num-
ber of viable microorganisms in the steady state. Vertical bars show
maximum and minimum values of three plots
>1
O
10
9
8
7
6
5
0
[ ]I I t I I
0
10
20
30
40
50
60
Environmental temperature (~
Fig. 5. Relation between the environmental temperature and average
pH of the matrix in the steady state. Vertical bars show standard devia-
tions in the steady state
The pH levels of the original sawdust and the raw model waste were 5.50 and 5.72, respectively. The pH of the matrix changed from acidic to alkaline at each temperature condi- tion after reaching the steady state (Fig. 1). These results are similar to those of our previous experiment. 2 The pH increased more rapidly at higher temperatures. After the pH reached 9, it maintained a constant level. It was reported that biodegradation during composting proceeds in largely alkaline conditions. 17 The average pH at a steady state in- creased from the environmental temperature of 10~ to 50~ (Fig. 5). The pH increases were due to the generation of ammonium i o n s , 18 which is believed to be more active at the higher temperature.
The results of the pH tests and the number of viable bacteria suggest that the degradation reaction equilibrates without adjusting the pH or microbial concentration, and it is restricted only by changes in the environmental tempera-
I G r a m p o s i t i v e b a c t e r i a
['--'] G r a m n e g a t i v e b a c t e r i a
0 50 100
30 20 10 5 3
50
30 20 10 5 3
30
20
150
3
30 20 10 5 3
40
30
20
~9
o
30 20 10 5 3
10
0
50 100P e r c e n t a g e of G r a m p o s i t i v e or n e g a t i v e b a c t e r i a (%)
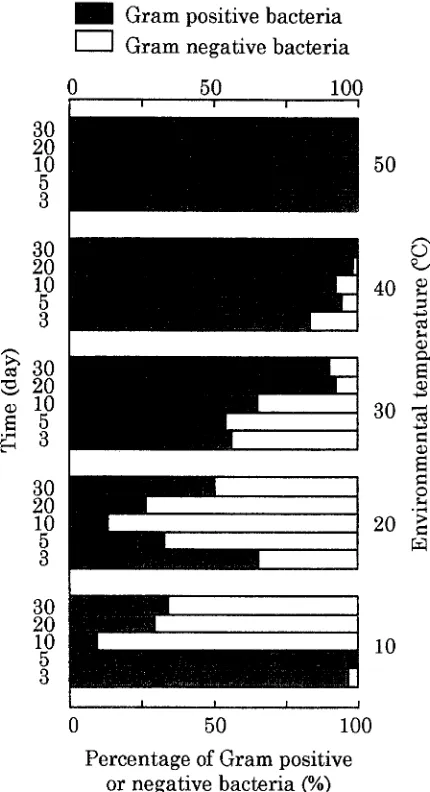
Fig. 6. Transitions of gram-stained bacteria due to temperature and elapsed time
ture when oxygen and substrate are sufficiently supplied. The pH level also changed markedly, but there was no effect on R-w. The pH level is likely to be closely related to the bacterial community.
Transition of bacterial flora
The results of the transition of the bacterial community are shown in Fig. 6. Gram-positive bacteria were dominant dur- ing the early stages, and Gram-negative bacteria appeared
during the later stages at 10~ and 20~ Gram-positive
bacteria were dominant in conditions of comparatively higher temperatures. Moreover, at 50~ all isolates were Gram-positive. Almost all of the Gram-positive bacteria
were identified as Bacillus sp. and Cellulomonas turbata
cantly influence the rate of weight loss (slopes of the total
weight loss) or the rate of CO2 evolution (constant CO2 evolution rate) (Fig. 1).
Conclusions
T h e d e g r a d a t i o n r e a c t i o n , u s i n g a s m a l l - s c a l e d e g r a d a t i o n r e a c t o r a n d m o d e l w a s t e , w a s r e s t r i c t e d o n l y b y a d j u s t i n g t h e e n v i r o n m e n t a l t e m p e r a t u r e w h i l e s u f f i c i e n t o x y g e n a n d s u b s t r a t e s w e r e s u p p l i e d . T o e x p l o i t b i o l o g i c a l a c t i v i t y ef- f e c t i v e l y w i t h t h e l o w e s t u s e o f e n e r g y , t h e o p t i m u m t e m - p e r a t u r e f o r b i o d e g r a d a t i o n o f t h e m o d e l w a s t e w a s 30~176
B a c t e r i a f r o m t h e e n v i r o n m e n t p r o p a g a t e d i n t h e r e a c t o r a t all o f t h e t e m p e r a t u r e s t e s t e d , w i t h n o i n o c u l u m s a d d e d . T h e m i c r o b i a l f l o r a c h a n g e d d u r i n g t h e o p e r a t i o n t i m e b u t d i d n o t a f f e c t t h e b i o d e g r a d a t i o n r a t e . A s a r e s u l t , i n o c u l a - t i o n w a s f o u n d t o b e u n n e c e s s a r y .
Acknowledgments The authors express their appreciation to Mr. Nobuo Nagaki, Mr. Tadashi Meguro, and Mr. Izumi Miura, Institute of Wood Technology, Akita Prefectural College of Agriculture, for providing wood particles.
References
1. Terazawa M, Tamai Y, Sunagawa M, Horisawa S, Miura T (1992) A novel system for garbage complete decomposition using sawdust and aerobic soil bacteria. In: Proceedings of the 7th European conference on biomass, energy and environment, agriculture and industry, Florence, Italy, pp 589-594
2. Terazawa M, Horisawa S, Tamai Y, Yamashita K (1999) Biodegra- dation of non-lignocellulosic substances. I. J Wood Sci 45:354- 358
3. Fujino E, Shinbo H, Minoura H, Kumada K (1994) Garbage de- composer (in Japanese). Matsushita Electric Works technical re- port, no. 48, September, pp 81-85
4. Inoue T. Kimura T, Morishita T. Kumada K. Sekiguchi 'I (1996) Changes of the state in a small scale biodegradation system. In: Proceedings of 7th ISWA international congress and exhibition. no. 2 pp 149-150
5. Horisawa S. Famai Y. Sakuma Y. Doi S. Terazawa M (2000) Effect of moisture content of a wood matrix on a small-scale biodegrada- tion system for organic of solid waste. J Wood Sci 46:317-321 6. Kuter HA. Hoitink AJ, Rossman L A (1985l Effect of aeration and
temperature on composting of municipal sludge in a full-scale ves- sel system. J Water Pollut Control Fed 57:309-315
7. Suler DJ. Finstein MS (1977/ Effect of temperature, aeration and moisture on CO2 formation in bend>scale, continuously thermo- philic composting of solid waste. Appt Environ Microbiol 33:345- 35O
8. Nakasaki K. Shoda M. Kubota H (1985) Effect of temperature on composting sewage sludge. Appl Environ Microbiol 50:~526-1530 9. Yamaguchi M (1992) Synthesis composition tables of cereal (in Japanese). In: Resources Council of Science and Technology Agency: food analysis tables. Ishiyaku. Tokyo~ pp 2-2l
10. Yamaguchi M (1992) Synthesis composition tables of fish and meat (in Japanese). In Resources Council of Science and Technology Agency: food analysis tables. Ishiyaku Tokyo, pp 56-122 11. Yamaguchi M (19921 Synthesis composition tables of fruits and
vegetables (in Japanese), In: Resources Council of Science and Technology Agency: food analysis tables. Ishiyaku, Tokyo, pp 130-
187
12. Pharmaceutical Society of Japan (1990l Standard methods of analysis for hygienic chemists (in Japanese), Kaneharm Tokyo, pp 149-150
13. Soil Microbiological Society of Japan (1992) Experimental method for soil microorganisms (in Japanese/, Yokendo, Tokyo, p 17 14. Bochner BR (19891 Sleuthing out bacterial identities. Nature
339:157-158
15. Miller JM. Rhoden DL (1991) Preliminary evaluation of biolog, a carbon source utilization method for bacterial ~dentification. J Clin Microbiol 29:1143-1147
16. Inoue T. Yamada J. Morishita T. Kumada K. Sekiguchi T (1997) Changes of the state and bacterial flora in a small scale bio- degradation system (in Japanese). In: Proceedings of 8th ISWA international congress and exhibition, no. 1. pp 287-289
17. Fujita K. Nieda Y. Kitawaki S (19851 Effect of pH level on composting (in Japanese 1. J Solid Wastes 15:31-39
18. Kitawaki S. Fujita K (1984) Inhibition by lower fatty acids in composting (in Japanese). In: Proceeding of environmental and sanitary engineering research, vol 20. pp 175-181