R E S E A R C H
Open Access
Image segmentation method based on
K-mean algorithm
Pengfei Shan
Abstract
The image is an important way for people to understand the world. How to make the computer have image
recognition function is the goal of image recognition research. In image recognition, image segmentation technology is one of the important research directions. This paper uses gray-gradient maximum entropy method to extract features from the image, uses K-mean method to classify the images, and uses average precision (AP) and intersection over union (IU) evaluation methods to evaluate the results. The results show that the method of K-mean can achieve image segmentation very well.
Keywords:Image segmentation, K-mean, Clustering, Gray-level co-occurrence matrix (GLCM), Maximum entropy
1 Introduction
With the development of human society and the ad-vancement of science and technology, people have to process a large amount of information data from meas-urement or observation every day for further manage-ment and use. At any time, images play an important role in the process of human receiving, processing, and transmitting information. This is because image infor-mation is visual, intuitive, easy to understand, and informative, so it is the most exposed in our daily pro-duction and life. One of the types of information is also the most important and effective way for people to ac-cess and communicate information. However, in the large amount of image information that humans obtain through vision, not all information content is required by us, which requires processing the obtained image to meet people’s needs in various situations. People have found that useful information exists in certain areas of the image, so we need to separate these specific areas from other areas by a certain technique to divide the in-put image into several meaningful target areas. Technol-ogy is image segmentation.
Image segmentation, feature extraction, and target recognition constitute three major tasks in the field of computer vision from low to high. Therefore, image seg-mentation is a basic computer vision technology, which
is the main problem in low-level vision in the field of computer vision. It is a key step before analyzing and understanding the processed image data. The main goal of image segmentation is to divide the image into com-ponents that have strong correlations with the real-world objects or regions contained therein. In image analysis, the target objects in the image are often the content we are interested in, and the regions occupied by these target objects in the image are often different. It is necessary to detect, extract features, and extract differ-ent target objects in the image. Classification recogni-tion, the separation of meaningful objects in the image from the background, and the separation of these objects into different meanings must be done. For example, to determine the area of forest arable land in the aerial image, you first need to separate these areas from the image; to identify certain words in the image file, you also need to sort these words; to identify and calibrate the micrographs, the chromosomes also need to use image segmentation techniques. Successful segmentation facilitates subsequent higher levels of image recognition and understanding. In the practical problem of computer vision, the quality of image segmentation will directly affect the feature extraction description, recognition, and classification of subsequent targets. Therefore, image segmentation is one of the most important and key re-search issues in the field of image processing. With the deepening of image segmentation technology, the appli-cation fields of image segmentation are becoming more Correspondence:[email protected]
School of Energy Engineering, Xi′an University of Science and Technology, Xi′ an, Shaanxi, People’s Republic of China
and more extensive, such as communication, military, remote sensing image analysis, medical diagnosis, and intelligent transportation. In the fields of agricultural modernization and industrial automation, image seg-mentation is inseparable.
Image segmentation is a cross-discipline research dir-ection, involving artificial intelligence, machine learning, pattern recognition, and other disciplines. Neurophysi-ology and psychological research results show that in the visual cognitive process, there is a visual clustering and segmentation process [1] in the brain. Exogenous areas of the brain provide an image analysis process that com-bines low-level feature expression obtained from the vis-ual cortex V1 region with attention selection and object recognition [2]. The experiments of these neural mecha-nisms confirmed the existence of the segmentation process in the cognitive process, which also provided a theoretical basis for the image segmentation technology.
With the deepening of research, image segmentation technology has made great progress. In 1997, Shi J [3] and others proposed an image segmentation method that aims at extracting global features of images and proposed a new global standard. The normalized cutting criterion measures the dissimilarity between different groups and the similarity between groups. In the static image segmentation, the results show that the segmenta-tion effect can be well achieved. Felzenszwalb P F [4] and others studied the regional problems of image seg-mentation. In their research results, predicates were used to measure the boundary between two regions and represented by images, and then a predicate-based seg-mentation method was used. The greedy algorithm per-forms the segmentation that satisfies the global attribute. The simulation results of the image segmentation show that this method can preserve the details of the low-variation image region and can ignore the details of the hyper-variable region. Cox I J [5] and others pub-lished an image segmentation algorithm in their research results. In this algorithm, the segmentation region in-cludes both the external boundary cost and the internal benefit associated with the boundary. The optimal seg-mentation of the image is achieved by minimizing the ratio between the external border cost and the internal benefit by calculating the effective image segmentation
method. Keegan M S [6] and others proposed a
multichannel-based image segmentation method, which allows users to combine their own information channels and define multiobjective functions by using the two-phase logic framework to achieve image segmentation. Pham D L [7] and others proposed a fuzzy image seg-mentation algorithm. For the effect of intensity inhomo-geneity, this algorithm deals with the inhomogeneity in image segmentation by modifying the objective function method in K-mean algorithm. So that the iterative
algorithm which minimizes the objective function is ap-plied to the fuzzy segmentation algorithm, and it is proven to be effective on multiple sets of image test sets. Image segmentation technology has been applied in many fields and has achieved a lot of achievements in recent years [8–12].
Due to the complexity of algorithms and the large dif-ferences between the segmentation results and the real-ity, the current image segmentation research results limit the application of image segmentation results. The main reason is that there is a large loss of information between the continuous expression of the image and the discrete expression of the segmentation. This loss is often due to the generation of boundary information during the classification process. As a clustering method, K-mean has been successfully applied to the classifica-tion research of many studies. For example, Kang S H [13] and others proposed a data clustering model based on a variational approach. This model is an extension of the classical K-mean method, a regularized K-mean method, by selecting a parameter that automatically gives a reasonable number of clusters. The Walvoort D J J [14] team chose the mean squared shortest distance (MSSD) as an objective function to minimize it using K-mean clustering. The results describe two K-mean methods: one for unequal areas and the other for equal-area-segmentation; the results of simulation exper-iments on soil samples show that the algorithm gives satisfactory results within reasonable calculations. Frigg-stad Z [15] described how to solve better worst-case ap-proximation guarantee problem in the results. Friggstad Z and others settle this problem by showing that a sim-ple local search algorithm provides a polynomial time approximation scheme (PTAS) for K-means for a Euclid-ean space for any fixed point. Due to the advantage of K-mean in clustering, clustering studies in many fields today use K-mean as a classification tool and achieved good results [16–20].
This paper uses gray-gradient maximum entropy method to extract features from the image, uses K-mean method to classify the images, and uses AP and IU evaluation methods to evaluate the results. The results show that the K-mean method can be used to achieve good image segmentation. The main contributions of this paper are:
1) A feature extraction method based on gray-gradient maximum entropy method and an image segmentation method using K-mean method is defined
2) Contrast the difference between subjective evaluation and objective evaluation 3) Study the six scenarios using the same
2 Proposed method
2.1 Gray-level co-occurrence matrix
Gray-level co-occurrence matrix (GLCM) refers to a common method for describing texture by studying the spatial correlation characteristics of grayscale. Because the texture is formed by the repeated occurrence of the gray distribution in the spatial position, there will be a certain gray relationship between two pixels at a certain distance in the image space, that is, the spatial correl-ation characteristics of the gray in the image. A grayscale histogram is a result of statistics on a single pixel having a certain grayscale on the image, and a GLCM is ob-tained by statistically obtaining a state in which two pixels having certain distances on the image each have a certain grayscale.
Take any point (x,y) in the image (N×N) and another point (x+a,y+b) that deviates from it and set the gray value of the point pair to (g1, g2). Point (x,y) moves on the whole picture, then a variety of (g1, g2) values are obtained. The series of gray values isk, and the combin-ation of (g1, g2) has a square of K. For the whole pic-ture, count the number of occurrences of each (g1, g2) value and arrange them into a square matrix, and then, the total number of (g1, g2) appears to be normalized to the occurrence probability P(g1, g2), which is called the GLCM. The distance difference values (a, b) can be combined with different values to obtain a joint prob-ability matrix under different conditions. The values of (a,b) are selected according to the characteristics of the periodic distribution of the texture. For finer textures, small difference values, such as (1, 0), (1, 1), and (2, 0) are selected. Whena= 1,b= 0, the pixel pair is horizon-tal, that is 0° scanning. Whena= 0, b= 1, the pixel pair is vertical, that is 90° scanning. When a= 1, b= 1, the pixel pair is right diagonal, that is 45° scanning. Whena
=−1, b= 1, the pixel pair is left diagonal, that is 135° scanning. In this way, the probability of simultaneous occurrence of two pixel gray-level converts the spatial coordinates of (x,y) to the description of“gray pair”(g1, g2), forming a GLCM.
The method of normalizing the GLCM is as follows:
p gð 1;g2Þ ¼p gð 1;g2Þ
R ð1Þ
The calculation method of R is:
R¼ N Nð −1Þ θ¼0orθ¼90 N‐1
ð Þ2 θ¼
45orθ¼135
ð2Þ
If the image is composed of blocks of pixels with simi-lar gray values, the diagonal elements of the GLCM will have relatively large values; if the image pixel gray values change locally, then the elements that deviate from the diagonal will have bigger value.
Angular second moment (ASM) energy reflects the uniformity of the gray distribution of the image and the texture thickness. If all values of the co-occurrence matrix are equal, the ASM value is small; conversely, if some of the values are large and the other values are small, the ASM value is large. When the elements in the co-occurrence matrix are concentrated, the ASM value is large at this time. A large ASM value indicates a more uniform and regular texture pattern. The ASM calcula-tion method for imageGis as follows:
ASM¼Xk
i¼1
Xk
j¼1ðG i;ð Þj Þ
2 ð
3Þ
Entropy is a measure of the amount of information an image has. The texture information also belongs to the information of the image and is a measure of random-ness. When all elements in the co-occurrence matrix have the greatest randomness and all values in the spatial co-occurrence matrix are almost equal, the ele-ments of a co-occurrence matrix are distributed, the en-tropy is large. It indicates the degree of non-uniformity or complexity of the texture in the image.
The entropy E(G) for the image G is calculated as follows:
E Gð Þ ¼−Xk i
Xk
j¼1G i;ð Þj logG i;ð Þj ð4Þ
2.2 Maximum entropy of grayscale gradient
The co-occurrence matrix of image G is an Lf×Lg
di-mensional matrix. If (Lf−1) × (Lg−1) represents a
two-dimensional histogram of the size of the image re-gion, as shown in Fig.1, the origin of the co-occurrence matrix coordinate system is the upper left corner, where the x-axis is the gradient of the image and y is the gray value. The threshold is set to (s, t). Since the gray level
and the gradient value are clearly distinguished at the threshold, the gray value of the target is lower and the gray value of the background is higher, so the co-occurrence matrix can be divided into four areas: A, B, C, and D.
The gray value of the image and background does not change much, so the gray value is relatively small. Using
A(0≤i≤s, 0≤j≤t) to represent images,D(s+ 1≤i≤Lf−
1, 0≤j≤t) represents the background. As tbecomes lar-ger, the probability of the boundary between the target and the background of the corresponding pixel in-creases. Therefore, the element kijof the co-occurrence matrix inB(0≤i≤s,t+ 1≤j≤Lg−1) is the image of gray
scalei, and the gradientjbelongs to the number of edge transitions. The elementkijof the co-occurrence matrix in C(s+ 1≤i≤Lf−1,t+ 1≤j≤Lg−1) is the gray scale i
belongs to the background, and the gradientjbelongs to the number of edge transitions. From this, we can get the pixels for the four regions in Fig.1as follows:
PA¼ Xs
i¼0
Xt
j¼0pij PB¼
Xs i¼0
XLg−1
j¼t pij
PC¼ XLf−1
i¼s Xt
j¼0pij PD ¼
XLf−1
i¼s XLg−1
j¼t pij
ð5Þ
Regularizepij:
PAij ¼Pij PA¼
kij= Xs
i¼0
Xt j¼0kij
ð6Þ
Thus, the conditional entropy formula can be
obtained:
Hðedge;objectÞ ¼−X s
i¼0
X Lg−1
j¼tþ1
pBij logpBij
Hðedge;backgroundÞ ¼−X Lf−1
i¼sþ1
X Lg−1
j¼tþ1
pCij logpCij
ð7Þ
Finally, the conditional entropy of the image can be calculated:
H sð Þ ¼;t ðHðedge;objectÞ þHðedge;backgroundÞÞ=2
ð8Þ
According to the maximum entropy theory, the max-imum value of s and t obtained by H is the best threshold.
2.3 K-mean segmentation
The K-mean algorithm is a classical distance-based algo-rithm. The similarity is evaluated by the distance. That is to say, the longer the two objects are, the smaller the similarity is, and the closer the distance is, the greater the similarity is. So the algorithm eventually gets a com-pact and independent cluster.
The algorithm process is as follows:
1) K clusters are arbitrarily selected from the overall
Ncategories as cluster centers.
2) Calculate the distance to each cluster center for each other category and classify the category as the nearest cluster center.
3) Recalculate the cluster centers of each class that have been separated.
4) Iterate through steps (2) to (3) until the new center is equal to or less than the specified threshold, and the algorithm ends.
Mean clustering algorithm divides objects into K cat-egoriesKc= {c1,c2,…,ck}, eachckhas a cluster center μk;
apply the Euclidean distance formula to calculate the sum of the squares of the distances from the points in the class to the cluster centerμk:
Meanð Þ ¼ck X
xi∈ck xi−μk
2
ð9Þ
The goal of clustering is to minimize square sum mean
(Kc) =
P
k¼1
K
meanðckÞ of distance. The clustering method
in this paper is to replace the original values of the same kind of pixels with their defined values (colors) and take each color component of the RGB as the input param-eter to replace the pixels of the same kind of the original image. The resulting categories are displayed on an image without displaying them one by one.
The K-mean algorithm has less space requirements be-cause it only needs to store data points and centers. The required storage capacity is O (n+K), where n is the number of data points and the K-mean algorithm has less time requirements. Basically, it has a linear relation-ship with the number nof data points, that is, O (IKn), where Iis the number of iterations of convergence, Iis usually small, and can be bounded, that is, most of the changes usually occur in general. In the first few itera-tions, the K-mean algorithm is the most widely used al-gorithm because of its simplicity and high complexity.
However, the K-mean algorithm also has many
disadvantages.
2.4 Image segmentation evaluation method
The image segmentation evaluation method is divided into subjective evaluation and objective evaluation. As an evaluation system, it should have the following three characteristics:
1) Consistency, the results of automatic segmentation algorithm segmentation and artificially specified real segmentation regions should be matched as closely as possible, and the boundaries should be as close as possible;
2) The stability of the parameters, according to the predetermined parameters, the segmentation result should be consistent with the real value as much as possible;
3) The stability of the image, corresponding to different images, the segmentation results selected in the same parameters should be consistent.
Because the results of subjective evaluation methods are not controllable, this paper chooses quantitative standard methods to evaluate image segmentation algorithms.
2.4.1 AP
This method draws on the accuracy and recall rate in text retrieval, first marking the segmented image, and mapping the relevance of the tag to the text, so that the performance evaluation in the text retrieval can be intro-duced into the image segmentation performance evalu-ation. The accuracy rateP refers to the ratio of all pixel markers whose correct pixel markings match the artifi-cial results. The recall rateRrefers to the proportion of pixels marked correctly in the mark of the result of arti-ficial marking. Gupta S [21] and others used AP as the evaluation standard parameter for image segmentation in research results.
The AP standard calculation method is:
AP¼ Z 1
0
P rð Þdr ð10Þ
2.4.2 IU
LongJ [22] defines IU in their research results to evalu-ate segmentation methods.
For the two regionsRandR’, their overlap calculations are as follows:
O R;R0
¼jR∩R
0
j
jR∪R0 j ð11Þ
The IU indicator can be calculated as follows:
IU S0→S
¼ 1
N X
R∈S
jRj max R0∈S0
O R;R0
ð12Þ
3 Experimental results 3.1 Simulation environment
1) Processor: Intel’s fourth-generation Core i7-4710HQ @ 2.50 GHz quad-core Speed: 2.50 GHz (100 MHz × 25.0)
Number of processors: core number: 4/number of threads: 8
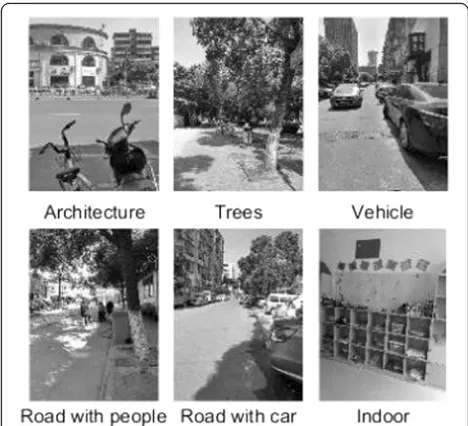
Fig. 2The scene pictures taken in this paper
2) Main board: Chipset: Intel Haswell - Lynx Point BIOS: Guangda NL8HP192_T1/date of
manufacture: October 16, 2014 The size of BIOS: 4096 KB
3) Memory information: ChannelA-DIMM0 Kingston DDR3L 1600 MHz 4G B
4) Operating system: Windows 7 Ultimate 64-bit SP1 5) Software environment: MATLAB R2014b 8.4
3.2 Image source
The images used in this paper are photographs taken by the author using a millet 5 mobile phone, includ-ing buildinclud-ings, trees on the street, vehicle, roads with people, streets with cars only, and indoor scenes. Each of them has 300 pictures, each with a size of 720 × 960 and a resolution of 96dpi. Each scene is shown in Fig. 2.
3.3 Sample division
Cross validation is a practical method of statistically cut-ting a sample of data into smaller subsets. The basic idea
is to group the data set in a sense, one part as a training set and the other as a validation set or test set. First, train the classifier with the training set, and then use the validation set to test the trained model, and use it as a performance indicator for evaluating the classifier. This paper selects 10-fold cross validation to divide the data set into ten parts and takes 9 of them as training and 1 of them as verification. The average of the 10 results is used as an estimate of the accuracy of the algorithm.
4 Discussion
4.1 Subjective effect analysis
As shown in Fig. 3, using the above method to process the picture, the following results can be obtained.
As can be seen from Fig.3, the use of this method for image segmentation, the performance of antinoise in dif-ferent scenes is difdif-ferent. The results of Fig.3show that this method is effective for street segmentation with less construction vehicles and scenery. For example, the de-tails of the building (upper left in Fig.3) can be well rec-ognized. However, for the trees in the street and indoor scenes, there is poor segmentation (top and bottom right in Fig. 3). The main reason for this is that the light in the trees and the indoor environment is dark, and the boundary is not as good as the street under the strong light. At the same time, because the shape of the build-ing and vehicle is large, the contour boundary is clear, especially the building, and there are special signs between the boundaries.
Find the entropy values in four directions (0o, 45o, 90o, 135o) for the above six scenes; the results are
Table 1Entropy of different scenes in four directions
0o 45o 90o 135o
Scene 1 3.86 4.04 3.9 4.07
Scene 2 4.22 4.49 4.33 4.45
Scene 3 4.06 4.21 3.99 4.17
Scene 4 4.02 4.18 4.01 4.21
Scene 5 3.74 3.79 3.76 3.94
Scene 6 3.6 3.84 3.58 3.85
shown in Table 1. The entropy values of the six scenes in the four directions are consistent at 00 and 135o. In the four directions, the entropy value of 0o is the smallest and the entropy value of 135o is the largest.
The results in Table 1 also show that the entropy values of different scenes are not the same, with scene 2 being the largest and scene 6 being the smallest.
4.2 Analysis of AP and IU results
Subjective methods can only describe the results qualita-tively, so it is difficult to accurately evaluate the segmen-tation results. This paper uses AP and UI methods to quantitatively evaluate image segmentation.
It can be seen from the results of Fig. 4 that the AP value of the architecture is 85.03, the AP value of the tree is 76.49, the AP value of the vehicle is 74.03, the AP value of the road with people is 77.61, the AP value of Fig. 5The IU results of six scenarios
the road with car is 82.11, and the AP value of the in-door is 73.56. Compared with subjective evaluation, the quantitative results provided by AP values are more ac-curate. It can be seen from the definition of AP that the larger the AP value, the better the result of image seg-mentation. Therefore, the results of Fig. 4 can be seen that the architecture and road with car distinguish the best, but the indoor is the worst. Different from subject-ive evaluation, there is little difference between the AP of the tree and the AP of road with people, but the effect of vehicle is worse than that of trees and road with people. After checking 300 scene photos, it was found that two of the photos were blurred due to the close ar-rangement of multiple vehicles. The above results are also reflected in the IU value; Fig. 5shows the IU mean for 6 groups of 300 photos in each category. From the IU mean value, it can be clearly seen that IU and AP show the same quantitative evaluation results, and this consistency is not found in subjective evaluation.
As shown in Fig.6, the image is classified by K-mean method. Figure 6 shows that the different elements of the image are clustered into different “blocks” before and after clustering, and the image is processed by K-mean method. The biggest difference between seg-mentation and other segseg-mentation methods is that the different elements in the image are not classified accord-ing to strict boundaries, but are clustered accordaccord-ing to the differences in the elements in the image, so the dis-tance between the classes is not fixed.
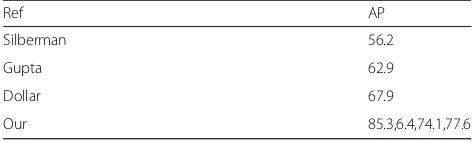
Comparison of different segmentation methods can be achieved by using AP and UI as parameters. Table2shows the comparison between Silberman [23], Gupta [24], Dol-lar [25], and this paper. From the results of Table 2, the AP values of the four scenarios are larger than other methods, which show that the image segmentation can be better achieved by the method of this paper.
5 Conclusions
Cluster analysis is an important means of data mining, and its application fields include statistics, image pro-cessing, medical diagnosis, information retrieval, biology, and machine learning. The clustering algorithm can obtain a good segmentation effect when applied to image segmentation and has been widely concerned and applied. Image segmentation is the basis of image recog-nition research. The quality of image segmentation
directly affects the result of image recognition. This paper uses gray-gradient maximum entropy method to extract features from the image, uses K-mean method to classify the images, and uses AP and IU evaluation methods to evaluate the results. The result shows that the image segmentation can be realized well by using the method of K-mean.
Abbreviations
AP:Average precision; ASM: Angular second moment; GLCM: Gray-level co-occurrence matrix; IU: Intersection over union; MSSD: Mean squared shortest distance; PTAS: Polynomial time approximation scheme
Acknowledgements
The authors thank the editor and anonymous reviewers for their helpful comments and valuable suggestions.
About the Authors
Xi′an University of Science and Technology, No. 58 Yanta middle road, Beilin District, Xi′an, Shaanxi, People’s Republic of China
Shan Pengfei was born in Huaibei, Anhui, People’s Republic of China, in 1987. He received the doctor’s degree from Xi′an University of Science and Technology, People’s Republic of China. Now, he works in School of Energy Engineering, Xi′an University of Science and Technology. His research interest includes rock dynamic mechanics and its image process.
Funding
Financial support for this work was provided by the 973 Key National Basic Research Program of China (no. 2015CB251602), the National Natural Science Foundation of China (nos. 51504184 and 51604264), the China Postdoctoral Science Foundation (no. 2017M196372XB), the Doctoral and Post-doctoral Start Foundation of Xi’an University of Science and Technology (nos. 2016QDJ048 and 2017QDJ060), and the Open Projects of Research Center of Coal Resources Safe Mining and Clean Utilization, Liaoning (no. LNTU17KF08). Support from these agencies is gratefully acknowledged, Natural Science Foundation of Shaanxi Province (no. 2018JQ5194).
Availability of data and materials We can provide the data.
Authors’contributions
The author makes contributions to all the works described in this paper. The author read and approved the final manuscript.
Ethics approval and consent to participate Approved.
Consent for publication Approved.
Competing interests
The authors declare that they have no competing interests. And all authors have seen the manuscript and approved for submission and confirmed that the content of the manuscript has not been published or submitted for publication elsewhere.
Publisher’s Note
Springer Nature remains neutral with regard to jurisdictional claims in published maps and institutional affiliations.
Received: 12 June 2018 Accepted: 15 August 2018
References
1. R. Shapley, N. Rubin, D. Ringach, Visual segmentation and illusory contours. Vis. Neurosci.2, 1119–1128 (2004)
2. R. Von Der Heydt, Image parsing mechanisms of the visual cortex. Vis. Neurosci., 1139–1150 (2003)
Table 2Comparison of different methods
Ref AP
Silberman 56.2
Gupta 62.9
Dollar 67.9
3. J. Shi, J. Malik, Normalized cuts and image segmentation. IEEE Trans. Pattern Anal. Mach. Intell.22(8), 888–905 (1997)
4. P.F. Felzenszwalb, D.P. Huttenlocher, Efficient graph-based image segmentation. Int. J. Comput. Vis.59(2), 167–181 (2004) 5. I.J. Cox, S.B. Rao, Y. Zhong,“Ratio regions”: a technique for image
segmentation, vol 2 (2017), pp. 557–557
6. M.S. Keegan, B. Sandberg, T.F. Chan, A multiphase logic framework for multichannel image segmentation [J]. Inverse Prob. Imaging6(1), 95–110 (2017) 7. D.L. Pham, J.L. Prince, An adaptive fuzzy c-means algorithm for image
segmentation in the presence of intensity inhomogeneities [J]. Pattern Recogn. Lett.20(1), 57–68 (2016)
8. Moreno R, Grana M, Ramik D, et al. Image segmentation by spherical coordinates 2018
9. Dewi M P, Armiati A, Alvini S. Image segmentation using minimum spanning tree. 2018, 335(1):012135
10. Q. Huang, Y. Luo, Q. Zhang, Breast ultrasound image segmentation: a survey. Int. J. Comput. Assist. Radiol. Surg.12(3), 1–15 (2018)
11. Romero A, Drozdzal M, Erraqabi A, et al. Image segmentation by iterative inference from conditional score estimation. 2018
12. Y. Yu, C. Fang, Z. Liao,Piecewise flat embedding for image segmentation (2018), pp. 1368–1376
13. S.H. Kang, B. Sandberg, A.M. Yip, A regularized k-means and multiphase scale segmentation. Inverse Prob. Imaging5(2), 407–429 (2017) 14. D.J.J. Walvoort, D.J. Brus, J.J. De Gruijter, An R package for spatial coverage
sampling and random sampling from compact geographical strata by k-means. Comput. Geosci.36(10), 1261–1267 (2018)
15. Z. Friggstad, M. Rezapour, M.R. Salavatipour, inFoundations of Computer Science. IEEE. Local search yields a PTAS for k-means in doubling metrics (2016), pp. 365–374
16. S. Shahrivari, S. Jalili, Single-pass and linear-time k-means clustering based on MapReduce. Inf. Syst.60(C, 1–12 (2016)
17. Bachem O, Lucic M, Hassani H, et al. Fast and provably good seedings for k-means. 2016
18. Yang B, Fu X, Sidiropoulos N D, et al. Towards K-means-friendly spaces: simultaneous deep learning and clustering. 2016
19. P. Arora, Deepali, S. Varshney, Analysis of k-means and k-medoids algorithm for big data. Procedia Comput Sci78, 507–512 (2016)
20. S.M. Ferrandez, T. Harbison, T. Weber, et al., Optimization of a truck-drone in tandem delivery network using k-means and genetic algorithm. J Ind Eng Manag9(2), 374 (2016)
21. S. Gupta, R. Girshick, P. Arbeláez, et al., inEuropean Conference on Computer Vision. Learning rich features from RGB-D images for object detection and segmentation (Springer, Cham, 2014), pp. 345–360
22. J. Long, E. Shelhamer, T. Darrell, Fully convolutional networks for semantic segmentation. IEEE Trans. Pattern Anal. Mach. Intell.39(4), 640–651 (2017) 23. N. Silberman, D. Hoiem, P. Kohli, et al., inEuropean Conference on Computer
Vision. Indoor segmentation and support inference from RGBD images (Springer, Berlin, 2012), pp. 746–760
24. S. Gupta, P. Arbelaez, J. Malik, inComputer Vision and Pattern Recognition. IEEE. Perceptual organization and recognition of indoor scenes from RGB-D images (2013), pp. 564–571


disilver(I)]](data:image/gif;base64,R0lGODlhAQABAIAAAP///wAAACH5BAEAAAAALAAAAAABAAEAAAICRAEAOw==)